


Abstract
The p53 core domain binds to response elements (REs) that contain two continuous half-sites as a cooperative tetramer, but how p53 recognizes discontinuous REs is not well understood. Here we describe the crystal structure of the p53 core domain bound to a naturally occurring RE located at the promoter of the Bcl-2-associated X protein (BAX) gene, which contains a one base-pair insertion between the two half-sites. Surprisingly, p53 forms a tetramer on the BAX-RE that is nearly identical to what has been reported on other REs with a 0-bp spacer. Each p53 dimer of the tetramer binds in register to a half-site and maintains the same protein–DNA interactions as previously observed, and the two dimers retain all the protein–protein contacts without undergoing rotation or translation. To accommodate the additional base pair, the DNA is deformed and partially disordered around the spacer region, resulting in an apparent unwinding and compression, such that the interactions between the dimers are maintained. Furthermore, DNA deformation within the p53-bound BAX-RE is confirmed in solution by site-directed spin labeling measurements. Our results provide a structural insight into the mechanism by which p53 binds to discontinuous sites with one base-pair spacer.
INTRODUCTION
The tumor suppressor protein p53 plays an essential role in preventing cancer development (1,2). One of the major mechanisms by which p53 suppresses tumor formation and progression is to regulate transcriptional programs involved in cell cycle arrest, DNA repair and apoptosis (3). p53 response elements (REs) are composed of two decameric half-sites (consensus sequence RRRCWWGYYY; R = A, G; W = A, T; Y = C, T) (4,5) that are adjacent to each other in most promoters but are separated by 1 bp in some others (6,7). Hundreds of functional p53 RE sequences of this form have been validated (8). As with many other transcription factors (9–13), the binding site sequence of a given RE confers specific transcriptional activity to p53, enabling p53 to regulate diverse sets of genes under different cellular conditions (8,14,15). For example, the high-affinity sites tend to have no spacer and few deviations from the consensus sequence, and these sites are predominantly found in genes active in cell cycle arrest, such as p21, cyclin G and 14-3-3σ. On the other hand, low-affinity sites tend to have spacers or several mismatches from the consensus motif, and are found in the regulatory elements of apoptosis-related genes, such as Bcl-2-associated X protein (BAX), PUMA and IGFBP3 (16).
Variation of RE sequence may affect binding affinity as well as the architecture of the p53 core tetramer (here core tetramer refers to the tetramer of p53 DNA-binding core domains bound to DNA). p53 and its complexes with DNA have been extensively studied (17–25), and recently tetrameric p53 core domain crystal structures have been solved for full REs containing continuous sites (i.e. no spacer between two half-sites) (22–25). In addition, tetrameric core domain crystal structures of p53 family members, p63 and p73, were reported bound to REs with spacers of different length. However, these studies used DNA of half-sites and assumed that the DNA in the crystal lattice mimicked the continuous DNA (26,27). More importantly, when the continuous 22-bp DNA with a 2-bp spacer was used, the two p63 dimers did not interact (26). Based on this observation and other modeling studies (28), it is assumed that p53 bound to discontinuous sites would adopt a different tetrameric architecture due to the different relative orientation of the p53 dimers bound to each half-site. Here, we determined a crystal structure at 1.9 Å resolution of the p53 core domain tetramer bound to a 21-bp RE from the BAX promoter in which the two decameric half-sites are separated by a 1-bp spacer.
MATERIALS AND METHODS
Sample preparation and crystallization
Human p53 core domain (amino acids 92–292) was prepared as previously described (22). The DNA oligonucleotides used for crystallization were synthesized by Integrated DNA Technologies (Coralville, IA, USA) and purified as described elsewhere (22). The p53–DNA complex was prepared by mixing purified p53 core domain and DNA at a 4:1 molar ratio, with a final concentration of the complex of ∼10 mg/ml. Crystals were grown by the hanging drop method at 18°C using a reservoir buffer of 50 mM Bis-Tris propane (pH 6.68), 12% (w/v) polyethylene glycol 4000, 100 mM NaCl. Crystals belong to the space group P212121 with cell dimensions of a = 65.420 Å, b = 93.880 Å, c = 145.634 Å.
Data collection, structure determination and analysis
Crystals were stabilized in the crystallization buffer with 20% (v/v) glycerol and flash frozen with liquid nitrogen for cryo-crystallography. Data were collected at the ALS BL8.2.1, BL8.2.2 beamline at the Lawrence Berkeley National Laboratory. Data were reduced using HKL2000 (29). Initial phase determination was performed by molecular replacement (MR) with Phaser from the CCP4 package (30), using chain A of a previously solved p53 structure (PDB ID 3KMD) as the search model. We used CCP4 refmac5 (30) for the refinement. DNA was initially built manually using O (31), and then subjected to Phenix.autobuild (32). The structure was further refined using Phenix.refine (32). The statistics of crystallographic analysis is presented in Table 1.
Table 1.
Data collection and refinement statistics
| Complex | P53/BAX-RE complex |
|---|---|
| Data collection | |
| Space group | P212121 |
| Cell dimensions | |
| a, b, c (Å) | 65.42, 93.88, 145.63 |
| Resolution (Å) | 1.91 (1.94–1.91)a |
| Rsym or Rmerge | 6.4 (44.2) |
| I / σI | 35.2 (3.3) |
| Completeness (%) | 99.9 (99.4) |
| Redundancy | 7.1 (5.5) |
| Refinement | |
| Resolution (Å) | 48.67–1.91 |
| Number of reflections | 67 896 |
| Rwork / Rfree | 18.80/22.77 |
| No. atoms | |
| Protein | 6284 |
| DNA | 855 |
| Ligand/ion | 4 |
| Water | 832 |
| B-factors | |
| Protein | 31.9 |
| DNA | 48.8 |
| Ligand/ion | 20.6 |
| Water | 38.9 |
| Root mean square deviations | |
| Bond lengths (Å) | 0.006 |
| Bond angles (°) | 1.446 |
aValues in parentheses are for highest-resolution shell.
Computational analysis
Structural analysis of the DNA in the complex was performed with Curves (33) by calculating the helix axis, helix diameter, minor groove width, and helix twist. DNA unwinding was analyzed based on the sum of the helix twist of a specified number of base-pair steps. The BAX and 3KMD structures were compared based on the difference in total helix twist between two given base-pair steps. The BAX and 3KMD sequences were aligned for this purpose based on the half-site positions.
Electron Paramagnetic Resonance measurement of solution conformation of the bound DNA in p53/BAX-RE complex
Following previously reported procedures (34–36), Double Electron–Electron Resonance (DEER) spectroscopy was used to measure distances between a pair of nitroxide spin labels attached at specific sites of the BAX-RE. The nitroxide probes were attached to the backbone of the DNA using a nucleotide-independent labeling scheme, and were designated as R5. Details on spin label attachment, electron paramagnetic resonance (EPR) sample preparation, DEER measurement and analysis are reported in Supplementary Methods. All DEER measurements were carried out at 80K, with each sample containing 50 µM of tetrameric protein–DNA complex, 50 mM 4-(2-hydroxyethyl)-1-piperazineethanesulfonic acid (pH 7.5), 100 mM NaCl, 5 mM MgCl2, 10 µM ZnOAc and 40% (v/v) glycerol. The measurements yielded the average distance (r0) and the standard deviation of the distance distribution (σ) between a pair of nitroxides (34–36). Based on repeated measurements, errors in measured r0 were <1 Å.
Expected inter-R5 distances based on the p53/BAX core tetramer crystal structure were computed using the previously validated NASNOX program (35) (see details in Supplementary Methods). Controls showed that varying the NASNOX search parameters resulted in <1 Å difference in the predicted averaged inter-R5 distances.
RESULTS
The overall structure of the p53 core domain tetramer bound to the BAX RE is similar to that seen on contiguous sites (e.g. the complex with PDB ID 3KMD) (22) (Figures 1A and B). Each p53 dimer binds to its decameric half-site in the canonical mode, and remarkably, the dimer–dimer interface between the two half-sites is preserved compared to the structure with contiguous sites (Figure 1B). This is a rather surprising result, as the 1-bp insertion was expected to cause separation and rotation with respect to the helical axis of the two dimers based on models proposed in prior studies (28). Detailed analysis reveals that protein–protein interactions at the intra- and inter-dimer interfaces are almost identical between the BAX structure (with 1-bp insertion in the DNA) and the structures observed with contiguous REs (Figures 1C and D). Moreover, all four p53 monomers bind to their respective quarter site without ‘slippage’ as seen in some protein–DNA complexes (10,11), and the protein–DNA interactions are largely conserved between the current structure and the previously solved p53–DNA complexes (22) (Figure 1E). For instance, the Arg280 residues form bidentate hydrogen bonds with the two guanines of the CWWG core elements of each half-site. The conservation of protein–protein interactions within the p53 core tetramer and the protein–DNA interactions between p53 and DNA raise inevitably the question of how the 1-bp insertion is accommodated in the p53/BAX-RE complex.
Figure 1.
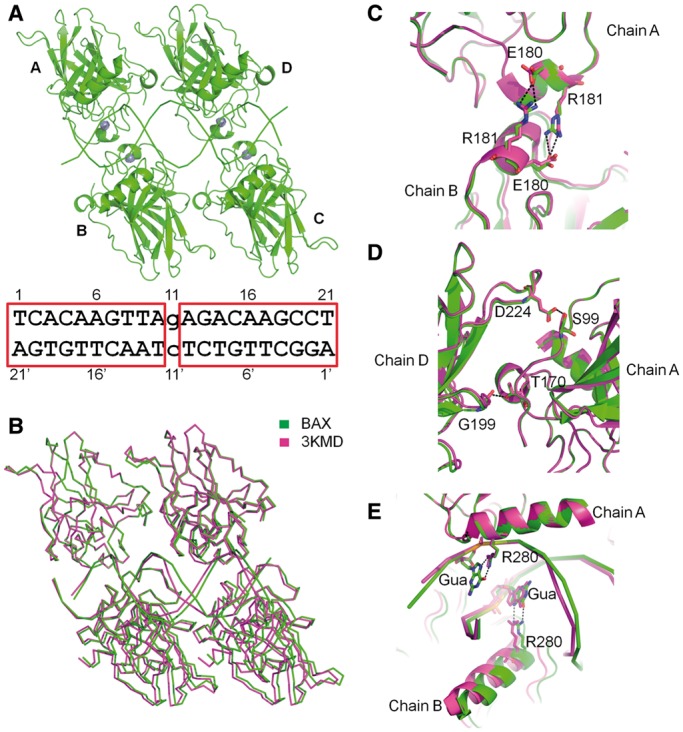
Structure of the p53 core domain bound to the BAX-RE with the two half-sites separated by a 1-bp spacer. (A) Overall structure of p53 core domain tetramer bound to the BAX-RE. The DNA sequence is shown with the two half-sites highlighted by red rectangles. (B) Structural comparison with p53 core domain tetramer bound to a continuous site (PDB ID 3KMD) shows that the two structures share the same overall architecture. (C) Structural comparison between the complexes BAX and 3KMD shows an almost identical intra-dimer interface between chains A and B. The similarity is also seen at the interface between chains C and D (not shown). (D) Structural comparison between the two complexes also shows an almost identical inter-dimer interface. The similarity is also seen at the interface between chains B and C (not shown). (E) Superimposition of the two complexes reveals that the p53 core domain tetramer binds DNA similarly in the two complexes. Here we use chains A and B as examples. Chains C and D also follow the same pattern (not shown).
The crystal structure was solved by MR using one p53 core domain as a partial search model. The electron densities for the DNA are generated after MR has yielded partial phases of the proteins, and are unbiased by the search model. In our previous study of p53 bound to a contiguous site (PDB ID 3KMD), the structure of the DNA is well-defined except for the two ends (Figure 2A, right panel). In the BAX structure, in addition to the two ends, the DNA structure around the spacer is somewhat disordered (Figure 2A, left panel). This is reflected by the disappearance of densities for the DNA backbone (Figure 2A, left panel), the weak and irregular electron densities for base pairs at the interface of both half-sites (Figure 2B, left panel) and the unusually high B-factors in the central region of the BAX-RE (Supplementary Figure S1, panels A and B). Specifically, electron densities for the DNA backbone between nucleotides A10 and A14 on chain E and nucleotides T10’ and A14’ on chain F are discontinuous (Figure 2A, left panel).
Figure 2.

DNA deformation in the p53/BAX-RE complex. (A) Electron densities of the DNA-binding sites in the p53/BAX-RE complex (left panel) and 3KMD structure (right panel). Both are shown within their respective electron density maps (2Fo − Fc at 1σ level). The central region of the phosphodiester backbones in the p53/BAX-RE complex shows poor and discontinuous electron densities. (B) Comparison of electron densities of base pairs in p53/BAX-RE complex (left panel) and 3KMD structure (right panel). Both are shown within their respective electron density maps (2Fo − Fc at 1σ level). The base pairs in the central region of the DNA in the p53/BAX-RE complex show weak electron density and do not match the canonical Watson–Crick base-pairing geometry.
In addition, although weak densities were observed for base pairs A10/T12’ and A12/T10’, they do not match the canonical Watson–Crick base-pairing geometry (Figure 2B, left panel). On the contrary, in our previously solved p53 core tetramer structure (3KMD), the corresponding base pairs showed well-defined densities, and fitted well with the standard Watson–Crick geometry (Figure 2B, right panel). The deformation in the central region of the DNA binding site of the BAX structure is more severe in the Fo-Fc omit map when the DNA is omitted (Supplementary Figure S2). The weak densities in this region of the BAX structure may be due to the multiple orientations of bases in this region, but we cannot rule out the possibility that, at least transiently, one or more bases may flip out of the double helix and yet are invisible due to a lack of structural constraints. The above observations suggest that the central region of the BAX p53-RE is distorted upon the binding of p53.
Although structural details of DNA distortion at the half-site interface are not definitive at present, such distortions are likely responsible for correctly positioning the two core CWWG elements to allow binding of a conserved p53 core tetramer structure to the BAX promoter in the presence of the 1-bp insertion. Computational analysis reveals that the DNA between the two CWWG elements exhibits a bending of ∼6° (Figure 3A), an increase in helix diameter (Figure 3B) and an increase in minor groove width in the central region (Figure 3C).
Figure 3.

DNA structure analyses. (A) Schematic representation of the DNA conformations in the BAX (green) and 3KMD (magenta) structures. The helix axes indicate a slight bending, while the backbones suggest an increase in helix diameter, due to deformations accommodating the additional base pair in the BAX-RE. (B) The increase in helix diameter in the center of the BAX (green) vs. the 3KMD (magenta) DNA target is illustrated based on a CURVES analysis. (C) The minor groove width comparison of the BAX (green) vs. the 3KMD (magenta) DNA conformation. (D) The difference in helix twist between an increasing number of base pairs centered around the interface of both half-sites of the BAX and 3KMD DNA structures demonstrates that 7 bp in the BAX-RE are accommodated in the same rotational space as 6 bp in the 3KMD structure. This arrangement places the CWWG core elements at a similar relative positioning, allowing for the formation of bidentate hydrogen bonds between the guanines of the CWWG core elements and Arg280 residues of an almost identical p53 core tetramer assembly.
The main feature of the BAX-RE, however, is a partial unwinding of the region between both core CWWG elements, which fully absorbs the helix twist of the additional base-pair step and enables the formation of favorable inter-dimer interactions. The structural details at the intersection of the two half-sites cannot be resolved with high accuracy, but comparison of the BAX and 3KMD structures yields a negligible difference in helix twist between the two most central G/C base pair of the core elements (positions 7 and 15 in the 21-mer, and positions 7 and 14 in the 20-mer), which form bidentate hydrogen bonds with Arg280, indicating an almost identical relative positioning (Figure 3D). This is also indicated by the helix twist values with an average helix twist of 31.3° between the inner C/G base pairs of the CWWG core elements in the BAX structure compared with 36.1° between the equivalent base pairs in the 3KMD structure (Supplementary Figure S3).
Owing to this partial unwinding, the critical Arg280 residues contact the G/C base pairs in almost congruent geometries in the BAX and 3KMD structures, and the closely related spatial positioning of these contacts allows the formation of approximately identical inter-dimer interfaces (Figure 1D). With a partial unwinding of the double helix and increase of its diameter and minor groove width, the central 7 bp between the core elements of the BAX-RE are adequately accommodated in the space occupied by only 6 bp in the 20-mer of our previously solved structure (3KMD), thus adjusting to the formation of the p53 core tetramer. Further computational analysis shows that such adjustment leads to deformations mainly on the side of the double helix that is not in close contact with the protein (outer region) (Supplementary Figure S4), which has more conformational freedom to fit the DNA into its bound form.
The DNA conformational change described above apparently affects protein–DNA interactions in the corresponding region. The L1 loop of monomers B and D, which contacts the central region of the BAX site, is partially disordered (Figure 4A). Most notable is the loss of electron density for the Lys120 residues at the tip of the L1 loop in the BAX structure, whereas the Lys120 residues show well-defined densities and interactions with DNA in p53 core tetramer structures bound to contiguous sites (22) (Figure 4B). There are two possibilities: one is that the L1 loop loses its binding to DNA, the other is that the L1 loop still binds to DNA but becomes partially disordered because of the flexibility of the bound DNA.
Figure 4.
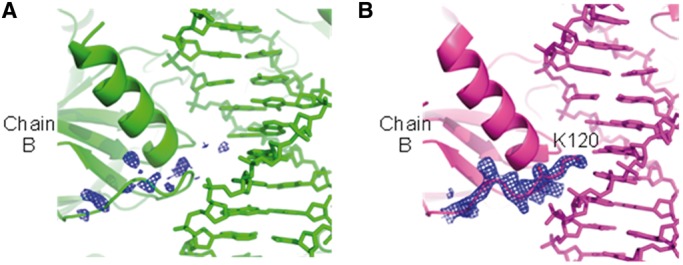
Structural comparison of the L1 loop of chain B in the BAX (A) and 3KMD (B) structures. The electron density (2Fo − Fc at 1σ level) of the L1 loop of chain B is well-defined in the 3KMD structure, but is disordered in the BAX structure.
To investigate whether the observed deformation is caused by crystal packing, we characterized DNA conformations within the p53/BAX-RE complex in the solution state using EPR spectroscopy and site-directed spin labeling (37,38). Stable nitroxide radical probes (Figure 5A) were attached, one pair at a time, to specific nucleotides where labeling does not interfere with p53 core domain tetramer formation, and eight inter-nitroxide distances spanning the interface between the two half-sites were measured using pulsed DEER spectroscopy (Figures 5B, Table 2 and Supplementary Figures S5–S7) (34–36). The measured distances are in excellent agreement with expected values predicted based on the p53/BAX-RE crystal structure (Figure 5B and C), with the maximal difference being <1.2 Å, well within the experimental errors (Table 2). The data indicate that in solution the DNA region around the spacer within the p53/BAX-RE complex adopts a similar conformation to that observed in the crystal structure, and therefore it is unlikely that crystal packing causes the DNA deformation observed in our crystal structure.
Figure 5.
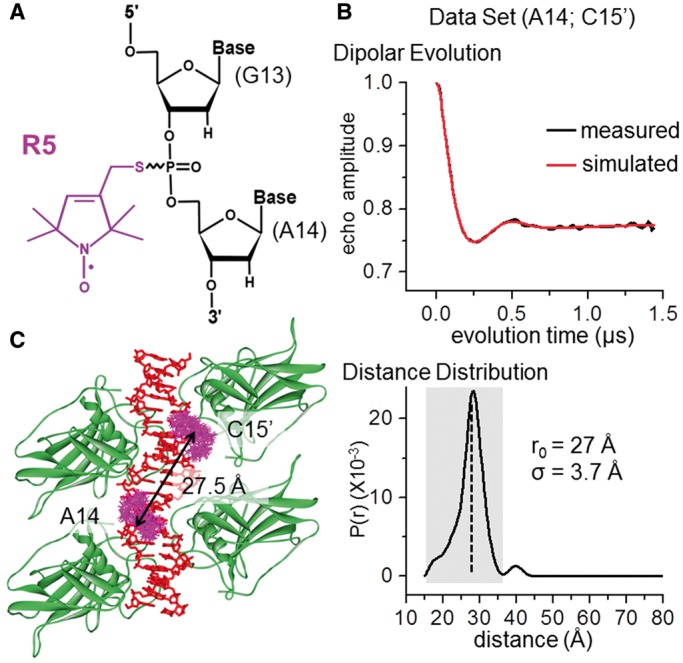
Assessment of p53/BAX-RE conformation in solution. (A) The R5 nitroxide probe. In this particular example, the label was designated as A14, as the R5 probe is attached at the phosphorothioate group sandwiched between G13 and A14. Note that following previously validated distance measurement protocols (35), all data reported here were acquired without separating the Rp and Sp phosphorothioate diastereomers present at each attachment site. (B) An example of measured DEER dipolar evolution data (top panel) and the resulting inter-nitroxide distance distribution (bottom panel). The pair of R5s were attached at A14 and C15’ (see Figure 1A). The shaded box indicates the major band in the distance distribution profile, from which the mean distance of 27 Å (r0, marked by the dotted line) and the width of the distance distribution (σ = 3.7 Å) were determined. Additional data sets are reported in Supplementary Figure S7. (C) Allowable R5 ensembles at A14 and C15’ within the p53/BAX-RE core tetramer predicted using NASNOX (see ‘Materials and Methods’ section). The NASNOX search parameters were t1 steps: 3; t2 steps: 6; t3 steps: 6; fine search: on; t1 starting value: 180°; t2 starting value: 180°; t3 starting value 180°. The average distance between these two nitroxide ensembles were found to be 27.5 Å.
Table 2.
Comparison of DEER-measured distances and predicted distances based on the reported BAX crystal structure
| Data setsa | Average distances (Å) |
||
|---|---|---|---|
| Measuredb | Predictedc | Δd | |
| (A14;C15’) | 27 | 27.5 | −0.5 |
| (C15;C15’) | 32 | 32.5 | −0.5 |
| (C4’;C15’) | 35 | 36.1 | −1.1 |
| (T9;C15) | 33 | 32.3 | 0.7 |
| (A10;A14) | 28 | 29.0 | −1.0 |
| (T9;T10’) | 23 | 23.9 | −0.9 |
| (A12;C4’) | 22 | 21.5 | 0.5 |
| (A10;C4’) | 34 | 32.8 | 1.2 |
aEach data set is designated by the pair of R5-labeled nucleotides, with nucleotide numbering following that of Figure 1A. See Supplementary Material for more details.
bDEER-measured values obtained as described. Errors were ≤1 Å as determined by repeated measurements.
cPredicted from the BAX core tetramer structure using the program NASNOX (see ‘Materials and Methods’ section). Variations of these values primarily arise from changes in NASNOX search parameters, and have been determined to be ≤1 Å.
dΔ = measured-predicted. Given that the error of the measured values is ±1 Å and the variable range of the predicted values is ±1 Å, a value of Δ ≤ 2 Å indicates the predicted and measured distances agree with each other.
We also used potassium permanganate to probe for the formation of single-stranded DNA within the complex. However, permanganate was unable to cleave DNA in the spacer region of the p53/BAX-RE complex (data not shown). As permanganate primarily modifies unpaired bases, this result suggests that p53DBD binding to BAX does not result in significant exposure of the DNA bases. This is consistent with the observed electron density map (Figure 2), which shows that every base pair, including those at the central region of the DNA, remains in paired configurations. Overall, the data indicate that deformation in the bound BAX-RE is not a melting that results in formation of unpaired bases, but is achieved through partial unwinding of the duplex.
DISCUSSION
In prior studies, it has been assumed that an extra base pair inserted between the two half-sites will change the relative orientation and distance between the two p53 dimers, leading to a loss of binding cooperativity (upper right panel in Figure 6). Another possible outcome could be that one p53 dimer binds to a half-site, while the other dimer binds nonspecifically by moving out of register by 1 bp to maintain the stabilizing protein–protein interactions. This mechanism has been observed for the binding of the homomeric glucocorticoid receptor to a DNA target with an additional 1-bp insertion (10). However, our studies show that p53 binds the BAX-RE through a conserved core domain tetramer architecture similar to the one observed on contiguous sites (middle and lower right panel in Figure 6). The DNA is unwound and compressed to accommodate the 1-bp insertion in the BAX-RE. Unlike many higher-order protein–DNA complexes in which DNA bends to facilitate protein–protein interactions (39), the DNA structural change observed here is not a global bend but rather a highly localized distortion of the double helix in the central region between the two half-sites. This unique feature of structural change in DNA is likely imposed by the four protein–protein interfaces and the planar structure of the p53 core domain tetramer. In other words, to compensate for the 1-bp insertion, DNA bending apparently cannot simultaneously satisfy the geometric constrains of all four protein–protein interfaces, whereas unwinding and compression of the central DNA region will enable the p53 dimers to bind in a sequence-specific manner and reestablish the spatial orientation required for core tetramer assembly.
Figure 6.

A model for the p53 core domain tetramer bound to DNA. The model is based on the BAX and 3KMD structures. When individual p53 core domains bind to continuous half-sites, they will form a tetramer and lead to cooperative binding (lower right). When they bind to the discontinuous BAX site, the additional base pair (red), if in B-DNA conformation, will cause separation and rotation between the two p53 dimers, leading to a loss of binding cooperativity (upper right). To maintain the cooperativity, the interactions between the two p53 dimers override the DNA constraints, unwinding and compressing the central region (purple). This effect reestablishes the p53 tetramer (middle right) in almost identical conformation to the tetramer observed on continuous half-sites (lower right).
The protein–protein interactions in the core domain tetramer apparently provide the driving force for the DNA distortion. Interestingly, in crystal structures of the p53 core domain bound to DNA containing decameric half-sites, p53 dimers tend to self-associate into a tetramer, and the DNA molecules from neighboring complexes form a pseudo-continuous helix with a 2-bp spacer (20). In some cases, the DNA ends will splay apart so the two decameric half-sites will align to mimic a continuous p53 RE with 0-bp spacer allowing for intensive interactions between the p53 dimers (23). These observations suggest that the protein–protein interactions in the core tetramer energetically dominate the formation of the tetrameric complex and deformation of the DNA structure.
It is known that p53 binds to BAX with a weaker affinity than many REs with contiguous half-sites. For example, in vitro studies reported that full-length p53 binds to BAX with a dissociation constant (Kd) of 73 nM, while the corresponding value is 4.9 nM for p21, which is a contiguous RE and is involved in cell cycle arrest (16). Current crystal structures of the p53 core domain tetramer [this work and (22)] suggest that the protein–protein and protein–DNA interactions are largely conserved between the BAX and the p21 structures. Therefore, the difference in p53 affinity, which amounts to a binding free energy difference (ΔΔG) of ∼1.6 kcal/mol, may largely arise from the difference in ‘distorting’ the unbound DNA into the bound form. The relatively small ΔΔG value indicates that deformation in BAX may not be drastically different from that of p21. Further studies will be required to see if this holds true for p53 binding to other noncontinuous sites. We also note that the affinity difference between BAX and p21 has been linked to p53 transactivation activity, which leads to a drastically different functional outcome, i.e. apoptosis vs. cell cycle arrest (8,14,15). Our results therefore suggest a mechanism by which deformation of REs plays a role in p53 binding and transactivation, thereby contributing to the decision between cell cycle arrest and apoptosis.
In summary, our studies provides an unexpected structural mechanism by which p53 binds discontinuous sites with a 1-bp spacer, that is, maintaining the core domain tetramer conformation by unwinding and compression of the DNA at the central region between the two half-sites. This mechanism may be used by other DNA-binding proteins to recognize targets with a small number of base pairs inserted between individual recognition elements.
ACCESSION NUMBERS
RCSB Protein Data Bank: coordinates and structural factors have been deposited under the accession code 4HJE.
SUPPLEMENTARY DATA
Supplementary Data are available at NAR Online, including [40–43].
FUNDING
NIH [GM064642 and GM077320 to L.C., GM069557 and RR028992 to P.Q.] (in part); NSF [MCB-0546529 and CHE-1213673 to P.Q.] (in part); American Cancer Society [IRG-58-007-51 to R.R.] (in part); National Natural Science Foundation of China [project number 81272971 to Z.C. and Y.C.]; NIH postdoctoral fellowship (to Y.C.) (in part). R.R. is an Alfred P. Sloan Research Fellow. Funding for open access charge: NIH.
Conflict of interest statement. None declared.
Supplementary Material
ACKNOWLEDGEMENTS
We thank Yongqing Wu, Shuxing Li, Yankun Duan, Yongping Tong for experimental assistance and discussion. We thank ALS BCSB staff member Corie Ralston, Peter Zwart and Kevin Royal for help with data collection.
REFERENCES
- 1.Vogelstein B, Lane D, Levine AJ. Surfing the p53 network. Nature. 2000;408:307–310. doi: 10.1038/35042675. [DOI] [PubMed] [Google Scholar]
- 2.Horn HF, Vousden KH. Coping with stress: multiple ways to activate p53. Oncogene. 2007;26:1306–1316. doi: 10.1038/sj.onc.1210263. [DOI] [PubMed] [Google Scholar]
- 3.Vousden KH, Prives C. Blinded by the light: the growing complexity of p53. Cell. 2009;137:413–431. doi: 10.1016/j.cell.2009.04.037. [DOI] [PubMed] [Google Scholar]
- 4.el-Deiry WS, Kern SE, Pietenpol JA, Kinzler KW, Vogelstein B. Definition of a consensus binding site for p53. Nat. Genet. 1992;1:45–49. doi: 10.1038/ng0492-45. [DOI] [PubMed] [Google Scholar]
- 5.Funk WD, Pak DT, Karas RH, Wright WE, Shay JW. A transcriptionally active DNA-binding site for human p53 protein complexes. Mol. Cell. Biol. 1992;12:2866–2871. doi: 10.1128/mcb.12.6.2866. [DOI] [PMC free article] [PubMed] [Google Scholar]
- 6.Wei CL, Wu Q, Vega VB, Chiu KP, Ng P, Zhang T, Shahab A, Yong HC, Fu Y, Weng Z, et al. A global map of p53 transcription-factor binding sites in the human genome. Cell. 2006;124:207–219. doi: 10.1016/j.cell.2005.10.043. [DOI] [PubMed] [Google Scholar]
- 7.Smeenk L, van Heeringen SJ, Koeppel M, van Driel MA, Bartels SJ, Akkers RC, Denissov S, Stunnenberg HG, Lohrum M. Characterization of genome-wide p53-binding sites upon stress response. Nucleic Acids Res. 2008;36:3639–3654. doi: 10.1093/nar/gkn232. [DOI] [PMC free article] [PubMed] [Google Scholar]
- 8.Riley T, Sontag E, Chen P, Levine A. Transcriptional control of human p53-regulated genes. Nat. Rev. Mol. Cell. Biol. 2008;9:402–412. doi: 10.1038/nrm2395. [DOI] [PubMed] [Google Scholar]
- 9.Lefstin JA, Yamamoto KR. Allosteric effects of DNA on transcriptional regulators. Nature. 1998;392:885. doi: 10.1038/31860. [DOI] [PubMed] [Google Scholar]
- 10.Luisi BF, Xu WX, Otwinowski Z, Freedman LP, Yamamoto KR, Sigler PB. Crystallographic analysis of the interaction of the glucocorticoid receptor with DNA. Nature. 1991;352:497–505. doi: 10.1038/352497a0. [DOI] [PubMed] [Google Scholar]
- 11.Meijsing SH, Pufall MA, So AY, Bates DL, Chen L, Yamamoto KR. DNA binding site sequence directs glucocorticoid receptor structure and activity. Science. 2009;324:407. doi: 10.1126/science.1164265. [DOI] [PMC free article] [PubMed] [Google Scholar]
- 12.Giffin MJ, Stroud JC, Bates DL, von Koenig KD, Hardin J, Chen L. Structure of NFAT1 bound as a dimer to the HIV-1 LTR [kappa]B element. Nat. Struct. Mol. Biol. 2003;10:800–806. doi: 10.1038/nsb981. [DOI] [PubMed] [Google Scholar]
- 13.Leung TH, Hoffmann A, Baltimore D. One nucleotide in a ΰB site can determine cofactor specificity for NF-ΰB Dimers. Cell. 2004;118:453–464. doi: 10.1016/j.cell.2004.08.007. [DOI] [PubMed] [Google Scholar]
- 14.Beckerman R, Prives C. Transcriptional regulation by P53. Vol. 2. Cold Spring Harb: Perspect. Biol; 2010. [DOI] [PMC free article] [PubMed] [Google Scholar]
- 15.Laptenko O, Prives C. Transcriptional regulation by p53: one protein, many possibilities. Cell Death Differ. 2006;13:951–961. doi: 10.1038/sj.cdd.4401916. [DOI] [PubMed] [Google Scholar]
- 16.Weinberg RL, Veprintsev DB, Bycroft M, Fersht AR. Comparative binding of p53 to its promoter and DNA recognition elements. J. Mol. Biol. 2005;348:589–596. doi: 10.1016/j.jmb.2005.03.014. [DOI] [PubMed] [Google Scholar]
- 17.Joerger AC, Fersht AR. Structural biology of the tumor suppressor p53. Annu. Rev. Biochem. 2008;77:557–582. doi: 10.1146/annurev.biochem.77.060806.091238. [DOI] [PubMed] [Google Scholar]
- 18.Cho Y, Gorina S, Jeffrey PD, Pavletich NP. Crystal structure of a p53 tumor suppressor-DNA complex: understanding tumorigenic mutations. Science. 1994;265:346–355. doi: 10.1126/science.8023157. [DOI] [PubMed] [Google Scholar]
- 19.Ho WC, Fitzgerald MX, Marmorstein R. Structure of the p53 core domain dimer bound to DNA. J. Biol. Chem. 2006;281:20494–20502. doi: 10.1074/jbc.M603634200. [DOI] [PubMed] [Google Scholar]
- 20.Kitayner M, Rozenberg H, Kessler N, Rabinovich D, Shaulov L. Structural basis of DNA recognition by p53 tetramers. Mol. Cell. 2006;22:741. doi: 10.1016/j.molcel.2006.05.015. [DOI] [PubMed] [Google Scholar]
- 21.Malecka KA, Ho WC, Marmorstein R. Crystal structure of a p53 core tetramer bound to DNA. Oncogene. 2009;28:325–333. doi: 10.1038/onc.2008.400. [DOI] [PMC free article] [PubMed] [Google Scholar]
- 22.Chen Y, Dey R, Chen L. Crystal structure of the p53 core domain bound to a full consensus site as a self-assembled tetramer. Structure. 2010;18:246–256. doi: 10.1016/j.str.2009.11.011. [DOI] [PMC free article] [PubMed] [Google Scholar]
- 23.Kitayner M, Rozenberg H, Rohs R, Suad O, Rabinovich D. Diversity in DNA recognition by p53 revealed by crystal structures with Hoogsteen base pairs. Nat. Struct. Mol. Biol. 2010;17:423. doi: 10.1038/nsmb.1800. [DOI] [PMC free article] [PubMed] [Google Scholar]
- 24.Petty TJ, Emamzadah S, Costantino L, Petkova I, Stavridi ES, Saven JG, Vauthey E, Halazonetis TD. An induced fit mechanism regulates p53 DNA binding kinetics to confer sequence specificity. EMBO J. 2011;30:2167–2176. doi: 10.1038/emboj.2011.127. [DOI] [PMC free article] [PubMed] [Google Scholar]
- 25.Emamzadah S, Tropia L, Halazonetis TD. Crystal structure of a multidomain human p53 tetramer bound to the natural CDKN1A (p21) p53-response element. Mol. Cancer Res. 2011;9:1493–1499. doi: 10.1158/1541-7786.MCR-11-0351. [DOI] [PubMed] [Google Scholar]
- 26.Chen C, Gorlatova N, Kelman Z, Herzberg O. Structures of p63 DNA binding domain in complexes with half-site and with spacer-containing full response elements. Proc. Natl Acad. Sci. USA. 2011;108:6456–6461. doi: 10.1073/pnas.1013657108. [DOI] [PMC free article] [PubMed] [Google Scholar]
- 27.Ethayathulla AS, Tse P-W, Monti P, Nguyen S, Inga A, Fronza G, Viadiu H. Structure of p73 DNA-binding domain tetramer modulates p73 transactivation. Proc. Natl Acad. Sci. USA. 2012;109:6066–6071. doi: 10.1073/pnas.1115463109. [DOI] [PMC free article] [PubMed] [Google Scholar]
- 28.Pan Y, Nussinov R. Cooperativity dominates the genomic organization of p53-response elements: a mechanistic view. PLoS Comput. Biol. 2009;5:e1000448. doi: 10.1371/journal.pcbi.1000448. [DOI] [PMC free article] [PubMed] [Google Scholar]
- 29.Otwinowski Z, Minor W. Processing of X-ray diffraction data collected in oscillation mode. Methods Enzymol. 1997;276:307–326. doi: 10.1016/S0076-6879(97)76066-X. [DOI] [PubMed] [Google Scholar]
- 30.CCP4. The CCP4 suite: programs for protein crystallography. Acta Crystallogr. D Biol. Crystallogr. 1994;50:760–763. doi: 10.1107/S0907444994003112. [DOI] [PubMed] [Google Scholar]
- 31.Jones TA, Zou JY, Cowan SW, Kjeldgaard M. Improved methods for building protein models in electron density maps and the location of errors in these models. Acta Crystallogr. A. 1991;47(Pt 2):110–119. doi: 10.1107/s0108767390010224. [DOI] [PubMed] [Google Scholar]
- 32.Adams PD, Grosse-Kunstleve RW, Hung LW, Ioerger TR, McCoy AJ, Moriarty NW, Read RJ, Sacchettini JC, Sauter NK, Terwilliger TC. PHENIX: building new software for automated crystallographic structure determination. Acta Crystallogr. D Biol. Crystallogr. 2002;58:1948–1954. doi: 10.1107/s0907444902016657. [DOI] [PubMed] [Google Scholar]
- 33.Lavery R, Sklenar H. Defining the structure of irregular nucleic-acids - conventions and principles. J. Biomol Struct. Dynamics. 1989;6:655–667. doi: 10.1080/07391102.1989.10507728. [DOI] [PubMed] [Google Scholar]
- 34.Zhang X, Tung CS, Sowa GZ, Hatmal MM, Haworth IS, Qin PZ. Global structure of a three-way junction in a phi29 packaging RNA dimer determined using site-directed spin labeling. J. Am. Chem. Soc. 2012;134:2644–2652. doi: 10.1021/ja2093647. [DOI] [PMC free article] [PubMed] [Google Scholar]
- 35.Qin PZ, Haworth IS, Cai Q, Kusnetzow AK, Grant GPG, Price EA, Sowa GZ, Popova A, Herreros B, He H. Measuring nanometer distances in nucleic acids using a sequence-independent nitroxide probe. Nat. Protocols. 2007;2:2354–2365. doi: 10.1038/nprot.2007.308. [DOI] [PMC free article] [PubMed] [Google Scholar]
- 36.Cai Q, Kusnetzow AK, Hubbell WL, Haworth IS, Gacho PC, Van Eps N, Hideg K, Chambers EJ, Qin PZ. Site-directed spin labeling measurements of nanometer distances in nucleic acids using a sequence-independent nitroxide probe. Nucleic Acids Res. 2006;34:4722–4734. doi: 10.1093/nar/gkl546. [DOI] [PMC free article] [PubMed] [Google Scholar]
- 37.Altenbach C, Flitsch SL, Khorana HG, Hubbell WL. Structural studies on transmembrane proteins. 2. Spin labeling of bacteriorhodopsin mutants at unique cysteines. Biochemistry. 1989;28:7806–7812. doi: 10.1021/bi00445a042. [DOI] [PubMed] [Google Scholar]
- 38.Sowa GZ, Qin PZ. Site-directed spin labeling studies on nucleic acid structure and dynamics. Prog. Nucleic Acids Res. Mol. Biol. 2008;82:147–197. doi: 10.1016/S0079-6603(08)00005-6. [DOI] [PMC free article] [PubMed] [Google Scholar]
- 39.Chen L, Glover JN, Hogan PG, Rao A, Harrison SC. Structure of the DNA-binding domains from NFAT, Fos and Jun bound specifically to DNA. Nature. 1998;392:42–48. doi: 10.1038/32100. [DOI] [PubMed] [Google Scholar]
- 40.Pannier M, Veit S, Godt A, Jeschke G, Spiess HW. Dead-time free measurement of dipole-dipole interactions between electron spins. J. Magn. Reson. 2000;142:331–340. doi: 10.1006/jmre.1999.1944. [DOI] [PubMed] [Google Scholar]
- 41.Weber RT. 2006 Bruker Pulsed ELDOR Option User's Manual (v. 1.0) [Google Scholar]
- 42.Fajer PG, Brown L, Song L. In: ESR Spectroscopy in Membrane Biophysics. Hemminga MA, Berliner LJ, editors. Vol. 27. Springer, US: 2007. pp. 95–128. [Google Scholar]
- 43.Jeschke G, Chechik V, Ionita P, Godt A, Zimmermann H, Banham J, Timmel C, Hilger D, Jung H. DeerAnalysis2006—a comprehensive software package for analyzing pulsed ELDOR data. Appl. Magn. Reson. 2006;30:473–498. [Google Scholar]
Associated Data
This section collects any data citations, data availability statements, or supplementary materials included in this article.