

Abstract
Background and Aims
Resistance of plants to ozone stress can be classified as either avoidance or tolerance. Avoidance of ozone stress may be explained by decreased stomatal conductance during ozone exposure because stomata are the principal interface for entry of ozone into plants. In this study, a coupled photosynthesis–stomatal model was modified to test whether the presence of ozone can induce avoidance of ozone stress by stomatal closure.
Methods
The response of Siebold's beech (Fagus crenata), a representative deciduous tree species, to ozone was studied in a free-air ozone exposure experiment in Japan. Photosynthesis and stomatal conductance were measured under ambient and elevated ozone. An optimization model of stomata involving water, CO2 and ozone flux was tested using the leaf gas exchange data.
Key Results
The data suggest that there are two phases in the avoidance of ozone stress via stomatal closure for Siebold's beech: (1) in early summer ozone influx is efficiently limited by a reduction in stomatal conductance, without any clear effect on photosynthetic capacity; and (2) in late summer and autumn the efficiency of ozone stress avoidance was decreased because the decrease in stomatal conductance was small and accompanied by an ozone-induced decline of photosynthetic capacity.
Conclusions
Ozone-induced stomatal closure in Siebold's beech during early summer reduces ozone influx and allows the maximum photosynthetic capacity to be reached, but is not sufficient in older leaves to protect the photosynthetic system.
Keywords: Tropospheric ozone, stomatal conductance, stomatal closure, stress avoidance, photosynthesis–stomatal model, Siebold's beech, Fagus crenata
INTRODUCTION
The concentration of tropospheric ozone (O3) has doubled in the northern hemisphere since the first direct measurements in 1874, and it is expected to increase further throughout the 21st century (Volz and Kley, 1988; Akimoto, 2003; Vingarzan, 2004; Fowler, 2008). Ozone enters plants through stomata, and reacts with water in the apoplast to form reactive oxygen species, which damage physiological and biochemical processes in leaves of forest trees (e.g. Karnosky et al., 2003; Matyssek and Sandermann, 2003).
Plants have resistance mechanisms to O3-induced stresses. According to Levitt's (1972) definition, resistance of forest trees to O3-induced stress can be classified as avoidance or tolerance (Taylor, 1978; Andersen, 2003; Tausz et al., 2007). Avoidance of stress may be explained by decreased stomatal conductance during O3 exposure because stomata are the principal interface for entry of O3 into plants. When plants are exposed to O3, the size of the stomatal aperture and thereby the stomatal conductance may decrease with O3 (e.g. Wittig et al., 2007). Stomatal closure is also often caused by an increase in internal CO2 concentration resulting from O3-induced inhibition of carbon assimilation by chloroplasts (Reich, 1987; Weber et al., 1993; Heath and Taylor, 1997). In addition, several studies have found evidence that O3 induces stomatal closure resulting from direct modulation of K+ channels (Torsethaugen et al., 1999; Vahisalu et al., 2010) and altered Ca2+ homeostasis of guard cells (McAinsh et al., 2002).
Modelling efforts have contributed in analysing the relationship between stomatal O3 flux and O3-induced decline of plant carbon acquisition (Ollinger et al., 1997; Emberson et al., 2000; Martin et al., 2000; Karlsson et al., 2007; Sitch et al., 2007; Mills et al., 2010). Recent studies tried to include an empirical modification of the model parameter, which considered O3-induced stomatal closure (Hoshika et al., 2012b; Lombardozzi et al., 2012). Hoshika et al. (2012b) estimated that O3 influx into Siebold's beech leaves may have been limited by 20% due to O3-induced stomatal closure during summer 2011. Reduction in stomatal conductance may thus result in decreased diffusion of O3 into the metabolic system. However, there would be little useful protection to physiological and biochemical processes in a leaf, if the stomatal closure was a consequence of O3-induced injury to the metabolic systems (Robinson et al., 1998). The question thus arises of whether O3-induced stomatal closure could act as a stress avoidance response.
Theoretical models may help us to interpret experimental data regarding plant response, such as stomatal movements, to various environments (e.g. Cowan, 2002). Stomata regulate CO2 uptake and water vapour loss. The optimization theory of stomata suggested that stomata simultaneously control the trade-off between carbon gain and accompanying water loss (e.g. Cowan and Farquhar, 1977; Hari et al., 1986; Mäkelä et al., 1996; Katul et al., 2009; Medlyn et al., 2011). If stomata could also act to minimize the O3-induced damage by avoidance of O3 entry, then stomatal behaviour could be optimized not only to control the balance between carbon gain and water losses, but also to reduce accompanying O3 influx with some small loss of carbon assimilation.
To test this hypothesis, we used data on the effects of O3 on photosynthesis and stomatal conductance in Siebold's beech, in a coupled photosynthesis–stomatal model based on the optimal stomatal control that also considered an avoidance of O3-induced stress by stomatal closure.
MATERIALS AND METHODS
Experimental site and plant material
The experimental site was in the Sapporo Experimental Forest, Hokkaido University, in northern Japan (43°04′N, 141°20′E, 15 m a.s.l.; annual mean temperature, 9·3 °C; total precipitation, 1279 mm in 2012). The snow-free period is usually from early May to late December. The soil type is brown forest soil. We set two plots, one for ambient and another for elevated O3. The size of each plot is 5·5 × 7·2 m. The distance between the O3-enhanced plot and the ambient plot was about 20 m. There is a small stand composed of maple (Acer mono), elm (Ulmus davidiana var. japonica), ash (Fraxinus mandschrica var. japonica), basewood (Tilia japonica) and Japanese white birch (Betula platyphylla var. japonica) between the ambient and elevated O3 plot. Ten seedlings of 2-year-old Siebold's beech (Fagus crenata) and deciduous oak (Quercus mongolica var. crispula) were planted in each plot in May 2003, and were grown under ambient conditions from 2003 to 2010. They were therefore 10 years old when the fumigation with O3 began in 2011. Also, ten seedlings of 3-year-old Japanese white birch were planted in each plot in June 2011. In the present study, measurements were made, in this free-air O3 exposure experiment, on Siebold's beech, which is a widely distributed deciduous tree species in cool-temperate regions of Japan. The method of O3 exposure employed the system used at Kranzberg Forest in Germany (Nunn et al., 2002; Werner and Fabian, 2002). Ozone generated from pure oxygen is diluted with ambient air in a pressurized tank and fumigated into the canopies by a system of 48 teflon tubes hanging down from a fixed grid above the trees (for details of the system, see Watanabe et al., 2013a). Target O3 concentration was set to 60 nmol mol−1 during daylight hours. This enhanced O3 treatment during daytime was applied to ten Siebold's beech saplings from August to November 2011, and from May to November 2012. Ozone concentrations at canopy height were continuously recorded by an O3 monitor (Mod. 202, 2B Technologies, Boulder, CO, USA). The daytime hourly mean O3 concentrations of ambient and elevated O3 were 25·7 ± 11·4 and 56·7 ± 10·5 nmol mol−1, respectively, during the experimental period in 2011, and 27·5 ± 11·6 and 61·5 ± 13·0 nmol mol−1, respectively, during the experimental period in 2012. Monthly AOT40 values (accumulated exposure over a threshold of 40 nmol mol−1) of ambient and elevated O3 were 445 and 6758 nmol mol−1 h−1, respectively, in June, 39 and 9459 nmol mol−1 h−1, respectively, in August, and 1 and 7663 nmol mol−1 h−1, respectively, in October 2012. In 2012 the mean tree height was 3·4 ± 0·4 m, and the mean stem diameter at breast height was 33·2 ± 7·1 mm. Leaf area per tree was not different between the treatments (Watanabe et al., 2013b). The soil moisture was measured in the root layer (20 cm depth) by 10HS sensors equipped with an EM5b data logger (Decagon Devices, Pullman, WA, USA). On average, soil moisture was 28·1 ± 2·8 % during the growing season (May to October). These values approached field capacity (32 %). Soil water content was similar in both O3 treatments during the experimental period.
Measurement of leaf gas exchange
Diurnal change in leaf gas exchange was measured every 30 min for fully expanded leaves exposed to full sun at the top of the canopy, using a portable infra-red gas analyser (Model 6400, Li-Cor instruments, Lincoln, NE, USA). The measurements were made in June, August and October 2012 (4 d for each month, i.e. 2 d for both ambient and elevated O3, 0800–1900 h for June and August, and 0930–1700 h for October). Night-time stomatal conductance was also assessed in both O3 treatments on relatively dry days (relative humidity <70 %), between 2200 and 2330 h on 27 June, 30 August and 4 October. In one round of measurements, five replicated beech trees were measured in a random sequence with one leaf per tree at the top of the canopy. First-flush leaves with leaf order of 4–6 from the tip of a shoot, which had a healthy appearance, were measured. This is because the number of second-flush leaves was <1 % of the total number of leaves. During the measurement, the leaf chamber was placed in a position which did not to change the leaf angle to the sun. The light source was used to control the photosynthetic photon flux density (PPFD) in the leaf chamber, with tracking of the ambient PPFD so as to prevent shading of the leaf by the chamber walls. The CO2 concentration in the chamber (Ca) was set to 380 µmol mol−1. The temperature in the chamber was adjusted manually to the ambient conditions, which was measured by a thermometer under shaded conditions at the same height. Relative humidity in the chamber was maintained to be similar to the ambient humidity.
To measure leaf photosynthetic capacity, the response curve of the net photosynthetic rate (A) to the intercellular CO2 concentration (Ci), i.e. the A/Ci curve, was measured on 13–18 June, 26–30 August and 9–16 October. The measurements were carried out at controlled PPFD (1500 µmol m−2 s−1), leaf temperature (25 °C) and leaf-to-air vapour pressure deficit (VPD, 1·4 kPa), according to Watanabe et al. (2011). The A/Ci curve was obtained by measurement over 12 CO2 steps (Ca, 50–1700 µmol mol−1). Asat was measured at a CO2 concentration of 380 µmol mol−1, together with the stomatal conductance (gs). The ambient CO2 concentration (Ca) was measured so that the ratio of the Ci of a leaf to the ambient CO2 concentration (380 µmol mol−1), i.e. the Ci/Ca ratio, could be calculated. The maximum rate of carboxylation (Vcmax) and the maximum rate of electron transport (Jmax) were calculated from the A/Ci curve (Farquhar et al., 1980; Long and Bernacchi, 2003). Values of the Rubisco (ribulose-1,5-bisphosphate carboxylase/oxygenase) Michaelis constants for CO2 (Kc) and O2 (Ko), and the CO2 compensation point in the absence of dark respiration (Γ*), for analysis of the A/Ci curve, were derived according to the methodology of Bernacchi et al. (2001). The dark respiration rate (Rd) was also measured at controlled values of the leaf temperature (25 °C). All gas exchange measurements relevant to the A/Ci curve and dark respiration were carried out on days with clear skies between 0800 and 1600 h.
Measurement of leaf traits
After measurement of gas exchange, the leaves were collected to determine their mass per area (LMA). They were then dried in an oven at 70 °C for 1 week and weighed. The LMA was calculated as the ratio of the dry mass to the area of the leaves. The stomatal density was determined by the SUMP method, which makes a replica of the abaxial leaf surface using a celluloid sheet (Universal Micro-printing, SUMP, Tokyo, Japan: Umemoto-Mori et al., 1998). Stomata were counted under a light microscope at 5–7 randomly chosen positions on an area of 0·4 mm−2, situated in intercoastal fields.
In August, the nitrogen content of the leaves per unit mass (Nmass) was determined by gas chromatography (GC-8A, Shimadzu, Kyoto, Japan) after combustion with circulating O2 using an NC analyzer (Sumigraph NC-900, Sumika Chemical Analysis Service, Osaka, Japan). A calibration curve was generated using acetanilide (N = 10·36 %, C = 71·09 %, Wako, Osaka, Japan). We calculated the area-based nitrogen content (Narea) as the product of Nmass and LMA.
Leaf photosynthesis–stomatal model
The control of leaf gas exchange may be considered optimal when it maximizes carbon gain (net assimilation) while minimizing water loss (transpiration) (Cowan and Farquhar, 1977). This optimization gives the following equation:
| (1) |
where λ is a Lagrange multiplier that represents the marginal water cost of plant carbon gain (mol H2O mol−1 CO2), E is the transpiration rate, and A is the rate of carbon assimilation. Medlyn et al. (2011), as corrected by Medlyn et al. (2012), proposed the coupled photosynthesis–stomatal model derived from this theory of optimal stomatal behaviour. The equation is:
| (2) |
where g0 is stomatal conductance at zero A, and g1 is a slope parameter. D is the mole fraction of the VPD (mol mol−1), and 1·6 is the ratio of the diffusion coefficients for water vapour to CO2. This equation is similar to those of earlier models by Ball et al. (1987) and Leuning (1995).
If stomata also act to minimize O3 damage in addition to the water cost, the optimization can be expressed as:
| (3) |
where λº is the marginal ozone damage of plant carbon gain (mol O3 mol−1 CO2). Here Fst is stomatal ozone flux (mol m−2 s−1), and given by:
| (4) |
where [O3]air is the ambient O3 concentration (mol mol−1) and [O3]leaf is the O3 concentration inside the leaf, which can be assumed to be approximately zero (e.g. Omasa et al., 1979; Laisk et al., 1989). The coefficient of 1·6 is the ratio of the diffusion coefficients for water vapour to O3 (Hicks et al., 1987). Equation (3) can be rewritten as:
| (5) |
where k is the ratio of λ/λº (mol H2O mol−1 O3). If O3 stress cannot be ignored for plants, the marginal O3 damage cost to carbon gain may not be small in comparison with the marginal cost of water. Moreover, Löw et al. (2006) suggested that the closing response induced by water stress (such as drought) may basically over-rule stomatal sensitivity to O3. The term
| (5hboxB) |
can then be expressed as:
| (6) |
This is equivalent to:
| (7) |
where D̃ is the long-term mean VPD (mol mol−1) and [Õ3]air is the long-term mean ambient O3 concentration (mol mol−1). In this experiment, D̃ can be taken as approx. 8·5 mmol mol−1, which is the daytime mean value during the experiment, and likewise [Õ3]air is 20–60 nmol mol−1. As a result, k ranges approximately from 0·7 × 105 to 2·2 × 105 (mol H2O mol−1 O3) in this study.
According to the same procedure to derive eqn (2) from the theory of optimal stomatal behaviour (Arneth et al., 2002; Medlyn et al., 2011), the following equation derived from eqn (5) is given as:
 |
(8) |
If the term involving k is taken to be zero, the form of this equation is the same as eqn (2).
Two values of k were tested (k = 1·2 × 105 or k = 1·8 × 105) for the photosynthesis–stomatal model with avoidance of O3 stress by stomatal closure. The assumption that O3 stress can be ignored (k = 0) was also tested.
Data analysis
There was no replication of O3 treatments because of the limited number of free-air facilities to provide O3 exposure. Therefore, the individual tree treated was used as the statistical unit; such pseudoreplication allows responses to be established within statistical limitation. The response of stomatal conductance (gs) to VPD was fitted by general functional form {gs = gref [1 – m ln(VPD)]} presented by Oren et al. (1999), where m is a parameter indicating stomatal responsiveness to VPD and gref is stomatal conductance at VPD = 1 kPa. The Student's t-test was used to test the effects of O3 on the leaf gas exchange parameters and on the leaf traits. The effect of O3 on the relationship between gs and the dominant parameter of the photosynthesis–stomatal model, 1·6A/ , were tested by analysis of covariance (ANCOVA). Results were considered significant at P<0·05. All statistical analyses were performed with SPSS software (20.0, SPSS, Chicago, IL, USA).
RESULTS
Leaf traits
No difference in LMA was recorded between O3 treatments in June, August and October (Table 1). The stomatal density of beech leaves ranged from 125 to 140 mm−2 (Table 1). Throughout the experiment there was no difference in stomatal density between the treatments. Also, no difference of Narea between O3 treatments was found in August (1·8 ± 0·3 and 2·0 ± 0·4 g m−2 in ambient and elevated O3, respectively; P = 0·311; n = 6 plants).
Table 1.
Leaf mass per area (LMA) and stomatal density of Siebold's beech saplings grown under ambient and elevated O3 measured in 2012
| Ambient | Elevated O3 | P-value for t-test | |
|---|---|---|---|
| June | |||
| LMA (g m−2) | 90·9 (17·9) | 83·0 (14·8) | 0·426 |
| Stomatal density (mm−2) | 127·3 (16·0) | 131·9 (40·0) | 0·817 |
| August | |||
| LMA (g m−2) | 90·0 (10·0) | 87·1 (12·3) | 0·664 |
| Stomatal density (mm−2) | 127·1 (17·1) | 141·4 (21·2) | 0·258 |
| October | |||
| LMA (g m−2) | 94·0 (19·6) | 96·6 (10·7) | 0·782 |
| Stomatal density (mm−2) | 136·7 (20·9) | 138·7 (14·3) | 0·847 |
Each value denotes the mean (±s.d.) of 5–6 replicated trees.
Gas exchange traits of leaves
Table 2 shows the leaf photosynthetic traits for Siebold's beech in both O3 treatments. Asat reached its maximum in June, and decreased over time. The Asat under elevated O3 was significantly lower than in the control in August and October (–34 % in August and –34 % in October), but not in June. Ozone significantly decreased gs in June and August (–21 % in June and –26 % in August). No significant difference in gs was observed between the treatments in October. The Ci/Ca ratio was maintained at 0·73–0·77 from June to October under the ambient condition. The Ci/Ca ratio was significantly lower under elevated O3 in June, while the Ci/Ca ratio was larger relative to the control in October. Both Vcmax and Jmax were similar in both treatments in June, while O3-exposed leaves had significantly lower Vcmax and Jmax compared with ambient in August and October (Vcmax, –31 % and –35 % in August and October, respectively; Jmax, –28 % and –25 % in August and October, respectively). There was a significant increase in Rd under elevated O3 in August and October (+ 79 % in August, + 81% in October), whereas there was no difference in Rd between the treatments in June.
Table 2.
Gas exchange traits of leaves of Siebold's beech saplings grown under ambient and elevated O3 measured in 2012
| Ambient | Elevated O3 | P-value for t-test | |
|---|---|---|---|
| June | |||
| Asat (μmol m−2 s−1) | 11·8 (1·8) | 11·7 (2·1) | 0·966 |
| gs (mol m−2 s−1) | 0·24 (0·03) | 0·19 (0·05) | 0·047 |
| Ci/Ca ratio | 0·74 (0·03) | 0·68 (0·03) | 0·006 |
| Vcmax (μmol m−2 s−1) | 59·8 (8·1) | 59·1 (9·0) | 0·896 |
| Jmax (μmol m−2 s−1) | 122·7 (22·6) | 122·8 (26·8) | 0·995 |
| Rd (μmol m−2 s−1) | 1·30 (0·69) | 1·79 (0·45) | 0·171 |
| August | |||
| Asat (μmol m−2 s−1) | 10·7 (1·4) | 7·1 (1·3) | 0·001 |
| gs (mol m−2 s−1) | 0·27 (0·03) | 0·20 (0·02) | 0·027 |
| Ci/Ca ratio | 0·73 (0·04) | 0·77 (0·03) | 0·088 |
| Vcmax (μmol m−2 s−1) | 46·4 (6·1) | 31·8 (7·5) | 0·004 |
| Jmax (μmol m−2 s−1) | 105·8 (8·1) | 76·5 (16·5) | 0·003 |
| Rd (μmol m−2 s−1) | 1·07 (0·39) | 1·91 (0·35) | 0·003 |
| October | |||
| Asat (μmol m−2 s−1) | 7·1 (1·0) | 4·7 (0·9) | 0·001 |
| gs (mol m−2 s−1) | 0·20 (0·06) | 0·22 (0·06) | 0·572 |
| Ci/Ca ratio | 0·77 (0·07) | 0·85 (0·04) | 0·031 |
| Vcmax (μmol m−2 s−1) | 39·7 (4·7) | 25·9 (5·8) | 0·001 |
| Jmax (μmol m−2 s−1) | 108·3 (10·3) | 80·8 (16·3) | 0·006 |
| Rd (μmol m−2 s−1) | 0·88 (0·25) | 1·59 (0·67) | 0·036 |
Each value is the mean (±s.d.) of six trees.
Asat, net photosynthetic rate at growing CO2 concentration (380 µmol mol−1); gs, stomatal conductance to water vapour; Ci/Ca ratio, the ratio of intercellular CO2 concentration of a leaf to ambient CO2 concentration (380 µmol mol−1); Vcmax, maximum rate of carboxylation; Jmax, maximum rate of electron trasport; Rd, dark respiration rate.
Diurnal variation of leaf gas exchange and stomatal response
The assimilation rate (A) of beech leaves reached a maximum during the morning, generally following the pattern of change in PPFD (Fig. 1). A similar pattern was observed for gs. The response of gs to VPD is shown in Fig. 2. Stomatal conductance in both treatments declined sharply with an increase in VPD. When we fitted the formula of the relationship between gs and VPD {gs = gref [l – m ln(VPD)]}, lower gref and higher m was found under elevated O3 in June (Table 3). In August, the value of m was, however, lower under elevated O3 than in ambient conditions, reflecting a reduced sensitivity of gs to changes in VPD under elevated O3.
Fig. 1.

Example of diurnal changes of environmental factors (photosynthetic photon flux density, PPFD; air temperature, Temp.; vapour pressure deficit, VPD) and diurnal changes in leaf gas exchange for Siebold's beech grown under ambient and elevated O3. Data are represented as the mean ± s.e.
Fig. 2.
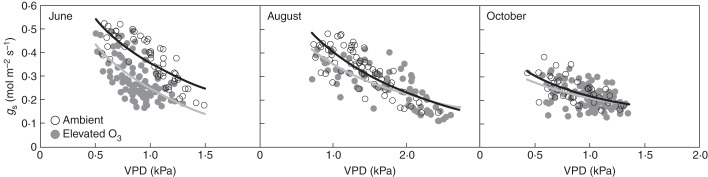
Relationship between stomatal conductance and leaf-to-air vapour pressure deficit (VPD) for Siebold's beech grown under ambient and elevated O3 (as indicated in the key). Data were obtained under a PPFD >500 µmol m−2 s−1. The fitting line denotes the model function gs = gref [l – m ln(VPD)] in ambient (black line) and elevated O3 (grey line). The determination coefficient (r2) in ambient and elevated O3 was 0·60 and 0·39 in June, 0·58 and 0·53 in August, and 0·36 and 0·15 in October.
Table 3.
Gas exchange parameters in the model function in the analysis of stomatal response to vapour pressure deficit (VPD) {gs = gref [l – m ln(VPD)]} under ambient and elevated O3
| Ambient |
Elevated O3 |
|||
|---|---|---|---|---|
| gref | m | gref | m | |
| June | 0·36 | 0·75 | 0·25 | 1·09 |
| August | 0·40 | 0·60 | 0·35 | 0·52 |
| October | 0·22 | 0·57 | 0·21 | 0·44 |
gref, stomatal conductance at VPD = 1 kPa (mol m−2 s−1); m, the slope of the regression indicating stomatal sensitivity to VPD.
During the night-time, gs did not differ between the treatments in June and August (Fig. 3). In both months, the night-time gs was approx. 0·03–0·05 mol m−2 s−1. In October, night-time gs was significantly higher under elevated O3 (+59 % relative to ambient treatment).
Fig. 3.

Night-time stomatal conductance for Siebold's beech grown under ambient (white bars) and elevated O3 (grey bars). Data are represented as the mean for five replicated trees ± s.d. The P-value was calculated from the t-test; n.s. denotes non-significant.
Application of a model with or without avoidance of ozone stress by stomatal closure
When assuming that k was equal to zero, the regression line had a significantly lower slope for elevated O3 than for ambient in June (0·63 and 0·53 in ambient and elevated O3, respectively) (Fig. 4; Table 4). When assuming that O3 stress could not be ignored (k = 1·2 × 105 or k = 1·8 × 105), there was no significant difference in either slope or y-intercept of the regression line between the treatments in June. No significant difference of the regression was found between the treatments when the k value was >1·2 × 105 (Table 4). In August and October, the y-intercept was significantly larger under elevated O3 regardless of the k value (Fig. 4).
Fig. 4.

Relationship between stomatal conductance and the dominant parameter of the photosynthesis–stomatal model 1·6A/ assuming that O3 stress is zero (k = 0) or an avoidance of O3 stress via stomatal closure (k = 1·2 × 105 or 1·8 × 105) for Siebold's beech grown under ambient and elevated O3 (as indicated in the key) in June, August and October 2012. The P-value was calculated from the ANCOVA; n.s. denotes non-significant.
Table 4.
Sensitivity analysis for the effects of k value on the regression line of the photosynthesis–stomatal model for Siebold's beech in June 2012, grown under ambient and elevated O3
| Ambient |
Elevated O3 |
P-value for ANCOVA |
||||
|---|---|---|---|---|---|---|
| k value | Slope | y-intercept | Slope | y-intercept | Slope | y-intercept |
| 0 | 0·63 | 0·042 | 0·53 | 0·044 | 0·002 | – |
| 0·3 × 105 | 0·65 | 0·040 | 0·57 | 0·042 | 0·014 | – |
| 0·6 × 105 | 0·68 | 0·038 | 0·61 | 0·040 | 0·056 | <0·001 |
| 0·9 × 105 | 0·70 | 0·037 | 0·65 | 0·040 | 0·136 | 0·012 |
| 1·2 × 105 | 0·73 | 0·035 | 0·68 | 0·039 | 0·251 | 0·102 |
| 1·5 × 105 | 0·75 | 0·034 | 0·71 | 0·039 | 0·387 | 0·374 |
| 1·8 × 105 | 0·77 | 0·033 | 0·74 | 0·039 | 0·533 | 0·811 |
| 2·1 × 105 | 0·79 | 0·032 | 0·77 | 0·039 | 0·678 | 0·740 |
| 2·4 × 105 | 0·81 | 0·031 | 0·80 | 0·039 | 0·816 | 0·405 |
| 2·7 × 105 | 0·83 | 0·031 | 0·83 | 0·039 | 0·943 | 0·201 |
| 3·0 × 105 | 0·85 | 0·030 | 0·85 | 0·039 | 0·941 | 0·094 |
– denotes not applied because slope was statistically significant.
DISCUSSION
The fitted line of the photosynthesis–stomatal model for both ambient and elevated O3 showed no difference in June when O3 stress was taken into account (Fig. 4; Table 4). This indicates that stomatal aperture may have been controlled efficiently and so reduced O3 influx (Table 2). A reduction in stomatal conductance was found, with no effect of O3 on leaf structural parameters such as stomatal density or on photosynthetic capacity in June (Tables 1 and 2). The observed reduction in stomatal conductance under elevated O3 may be due to a direct action of O3-derived reactive oxygen species in stomata, such as modulation of K+ channels (Torsethaugen et al., 1999; Vahisalu et al., 2010) or altered Ca2+ homeostasis of guard cells (McAinsh et al., 2002). The result suggests that Siebold's beech avoids damage to the photosynthetic mechanisms due to O3 by reducing stomatal conductance in June (Table 2). The photosynthetic capacity of Siebold's beech typically reached its maximum in the early summer (Yonekura et al., 2001; Iio et al., 2008). Siebold's beech exhibits a fixed growth pattern, opening its leaves simultaneously in a single flush, and maintaining leaves until the end of the growing season (Kikuzawa, 1983; Koike, 1988). Avoidance of O3 stress by stomatal closure may have some protective value during the early summer, allowing leaves to reach their maximum photosynthetic capacity.
In August and October, the fitted line for the photosynthesis–stomatal model, with and without avoidance of O3 stress by stomatal closure, had a larger y-intercept for elevated O3 (Fig. 4). This indicates that stomata could not efficiently regulate both O3 influx and water loss in August and October. Limitation of O3 influx was apparently continued by stomatal closure in August (Table 2). However, reduced sensitivity of stomatal conductance to VPD was also perceived under elevated O3 (Fig. 2; Table 3), indicating an increase in O3 influx under relatively high VPD. A similar finding was reported in O3-exposed leaves in pure aspen stands in the aspen FACE (free-air carbon dioxide enrichment) (Uddling et al., 2009). This effect could translate into a weaker ability to close stomata, i.e. slower or less effective stomatal control, in the enhanced O3 treatment (e.g. Paoletti, 2005). Mills et al. (2009) reported that O3 reduced the sensitivity of stomata to abscisic acid (ABA). The loss of stomatal response to ABA may be related to O3-induced ethylene emissions (Wilkinson and Davies, 2010). However, the mechanisms have not been adequately studied. Hoshika et al. (2012a) showed that O3 exposure progressively slowed the stomatal light response of Siebold's beech. Such progressive loss of stomatal control may inhibit the avoidance of O3 stress by stomatal closure.
Prolonged O3 exposure also led to an increase in night-time stomatal conductance in Siebold's beech in October (Fig. 3). Several studies reported a similar increase in night-time stomatal conductance in several tree species exposed to daytime O3 under controlled conditions (Skärby et al., 1987; Matyssek et al., 1995; Wieser and Harvanek, 1995; Grulke et al., 2007) and field conditions (Grulke et al., 2004). Matyssek et al. (1995) showed that O3 exposure at night decreased growth comparable with the effect of daytime exposure to O3 for European birch (Betula pendula), although O3 uptake at night was lower than during the daytime. Incomplete closure of stomata at night would lead to further O3 damage if O3 concentrations were elevated at night.
As a result of chronic O3 stress, a reduction of Asat of Siebold's beech was found in August and October (Table 2). The Ci/Ca ratio did not differ in August and increased in October under elevated O3, while stomatal conductance was reduced by elevated O3 in August and no difference was found between the treatments in October (Table 2). This indicates that the O3-induced reduction in Asat is due mainly to the reduction in photosynthetic capacity in chloroplasts (Table 2), consistent with previous studies (Farage et al., 1991; Yamaguchi et al., 2007). Increased intercellular CO2 concentrations (Ci) accompanying the O3-induced decline of photosynthetic capacity may often cause stomatal closure as a secondary response (e.g. Farage and Long, 1995). The reduction in stomatal conductance in August may be a consequence of O3 damage to carbon assimilation rather than an avoidance mechanism, although decreased stomatal conductance may limit O3 influx (Table 2).
The present results suggest that two phases may exist in avoidance of O3 stress via stomatal closure for Siebold's beech: (1) an efficient limitation of O3 influx by a reduction in stomatal conductance, without any clear effect on photosynthetic capacity in early summer; and (2) decreased efficiency of avoidance of O3 stress related to decreased photosynthetic capacity induced by O3 which accompanies the slow response of stomata or no direct stomatal response to O3 as the guard cells lose their ability to control the size of stomatal aperture to O3 in late summer and autumn. Previous studies have also reported a significant reduction of stomatal conductance under elevated O3 in early summer (e.g. Oksanen, 2003; Kitao et al., 2009). In contrast, several studies have found that O3-induced stomatal closure did not occur in early summer but occurred after inhibition of photosynthesis in late summer (e.g. Grams et al., 1999). This discrepancy may reflect inter- and intraspecies variation of the effect of O3 on stomata and on metabolism (e.g. Furukawa et al., 1990; Koch et al., 1998). Reiling and Davison (1995) found a difference in stomatal response to O3 between populations of plantain (Plantago major) obtained from various sites in UK. They reported that O3 caused a reduction in stomatal conductance from the first day of the fumigation. However, some populations responded more to O3 than others. The response was, however, gradually diminished on subsequent days. On the other hand, the other populations which had a smaller O3-induced reduction of stomatal conductance retained the effect for longer. This may emphasize the importance of differences in the strategies of stress resistance resulting from avoidance via stomatal closure and a tolerance to damage including the capacity for repair and detoxification (e.g. Oksanen et al., 2007). In the present study, the parameter of k relating to λº (i.e. the ozone damage cost of plant carbon gain) may reflect species-specific characteristics of tolerance to O3. Linking of stress avoidance with stress tolerance would help further mechanistic understanding of resistance to O3 stress (Wieser et al., 2002; Matyssek et al., 2007).
The presented formulation may help interpretation of parameters in the analysis such as of the relationship between stomatal conductance and VPD under elevated O3. For example, we can obtain the different parameters of the formula of stomatal response to VPD, gs = gref (l – m ln[VPD)] (Table 3). A hydraulic model, that assumes stomatal regulation of leaf water potential, suggested that the value of m is approx. 0·6 (e.g. Oren et al. 1999). A value of m <0·6 indicates that stomata are less sensitive than theoretically predicted based on plant hydraulics only, and a value of m >0·6 implies that stomatal conductance is less than the theoretical value in plant hydraulics due to the other limitation to stomatal aperture. Elevated O3 caused a much greater value of m, and the lower gref was shown relative to those in ambient conditions in June (Table 3). This is because stomatal control may regulate not only water loss but also O3 influx as avoidance (Fig. 4).
Despite the advantage of the present model for the diagnosis of stomatal response to O3, an application of the optimization theory for practical use over time might be limited during the growing season. The temporal changes in the slope of relationships between stomatal conductance and 1·6A/ was shown during the growing season (Fig. 4). Also, the increase in the intercept of the linear relationship was found in October (Fig. 4). Stomatal responsiveness to VPD was also gradually slowed even in ambient conditions (Table 3). These results may indicate gradual loss of stomatal control with leaf age. In fact, leaves could not show fully effective responsiveness of their stomata to environmental stimuli at the end of the growing season, called the ‘dull leaf’ phenomenon (Terashima, 2002). Moreover, O3 also apparently accelerated the loss of stomatal control (Fig. 2, Table 3). Integrating the optimization formulation presented here and an empirical parameter indicating loss of stomatal control (cf. Lombardozzi et al., 2012) might allow us to estimate not only the carbon gain of leaves but also the associated water loss under elevated O3 over time during the growing season.
In conclusion, by applying a photosynthesis–stomatal model, this study demonstrates that stomatal closure in the presence of O3 may act as a stress avoidance response in Siebold's beech in early summer. This suggests that future assessments of the effects of elevated O3 concentrations on plants, and analysis of the mechanisms, need to take account of species-specific responses and age of a leaf. The present model has an advantage of describing the effect of stomatal response to O3, and may contribute to further understanding of plants' resistance mechanisms to O3-induced stresses.
ACKNOWLEDGEMENTS
We are grateful for financial support from the Environment Research and Technology Development Fund of Japan (5B-1102) and for a Grant-in-aid from the Japanese Society for Promotion of Science (Type B 23380078, Young Scientists B 24710027 and B 24780239, Young Scientists for research abroad).
LITERATURE CITED
- Akimoto H. Global air quality and pollution. Science. 2003;302:1716–1719. doi: 10.1126/science.1092666. [DOI] [PubMed] [Google Scholar]
- Andersen CP. Source–sink balance and carbon allocation below ground in plants exposed to ozone. New Phytologist. 2003;157:213–228. doi: 10.1046/j.1469-8137.2003.00674.x. [DOI] [PubMed] [Google Scholar]
- Arneth A, Lloyd J, Santruckova H, et al. Response of central Siberian Scots pine to soil water deficit and long-term trends in atmospheric CO2 concentration. Global Biogeochemical Cycles. 2002;16:10054. [Google Scholar]
- Ball JT, Woodrow IE, Berry JA. A model predicting stomatal conductance and its contribution to the control of photosynthesis under different environmental conditions. In: Biggens J, editor. Progress in photosynthesis research. Dordrecht, The Netherlands: Martinus-Nijhoff Publishers; 1987. pp. 221–224. [Google Scholar]
- Bernacchi CJ, Singsaas EL, Pimentel C, Portis AR, Jr, Long SP. Improved temperature response functions for models of Rubisco-limited photosynthesis. Plant, Cell and Environment. 2001;24:253–259. [Google Scholar]
- Cowan IR. Fit, fitter, fittest; where does optimization fit in. Silva Fennica. 2002;36:745–754. [Google Scholar]
- Cowan IR, Farquhar GD. Stomatal function in relation to leaf metabolism and environment. In: Jennings DH, editor. Integration of activity in the higher plant. Cambridge: Cambridge University Press; 1977. pp. 471–505. [PubMed] [Google Scholar]
- Emberson LD, Ashmore MR, Cambridge HM, Simpson D, Tuovinen JP. Modelling stomatal ozone flux across Europe. Environmental Pollution. 2000;109:403–413. doi: 10.1016/s0269-7491(00)00043-9. [DOI] [PubMed] [Google Scholar]
- Farage PK, Long SP. An in vivo analysis of photosynthesis during short-term O3 exposure in three contrasting species. Photosynthesis Research. 1995;43:11–18. doi: 10.1007/BF00029457. [DOI] [PubMed] [Google Scholar]
- Farage PK, Long SP, Lechner EG, Baker NR. The sequence of change within the photosynthetic apparatus of wheat following short-term exposure to ozone. Plant Physiology. 1991;95:529–535. doi: 10.1104/pp.95.2.529. [DOI] [PMC free article] [PubMed] [Google Scholar]
- Farquhar GD, von Caemmerer S, Berry JA. A biochemical model of photosynthetic CO2 assimilation in leaves of C3 species. Planta. 1980;149:78–90. doi: 10.1007/BF00386231. [DOI] [PubMed] [Google Scholar]
- Fowler D. Ground-level ozone in the 21st century: future trends, impacts and policy implications. London: The Royal Society; 2008. [Google Scholar]
- Furukawa A, Park S, Fujinuma Y. Hybrid poplar stomata unresponsive to changes in environmental conditions. Trees. 1990;4:191–197. [Google Scholar]
- Grams TEE, Anegg S, Häberle K-H, Langebartels C, Matyssek R. Interactions of chronic exposure to elevated CO2 and O3 levels in the photosynthetic light and dark reactions of European beech (Fagus sylvatica) New Phytologist. 1999;144:95–107. [Google Scholar]
- Grulke NE, Alonso R, Nguyen T, Cascio C, Dobrowolski W. Stomata open at night in pole-sized and mature ponderosa pine: implications for O3 exposure metrics. Tree Physiology. 2004;24:1001–1010. doi: 10.1093/treephys/24.9.1001. [DOI] [PubMed] [Google Scholar]
- Grulke NE, Paoletti E, Heath RL. Chronic vs. short-term acute O3 exposure effects on nocturnal transpiration in two Californian oaks. Scientific World Journal. 2007;7:134–140. doi: 10.1100/tsw.2007.33. [DOI] [PMC free article] [PubMed] [Google Scholar]
- Hari P, Mäkelä A, Korpilahti E, Holmberg M. Optimal control of gas exchange. Tree Physiology. 1986;2:169–175. doi: 10.1093/treephys/2.1-2-3.169. [DOI] [PubMed] [Google Scholar]
- Heath RL, Taylor GE. Physiological processes and plant responses to ozone exposure. In: Sandermann H, Wellburn AR, Heath RL, editors. Forest decline and ozone. Ecological studies 127. Berlin: Springer-Verlag; 1997. pp. 317–368. [Google Scholar]
- Hicks BB, Baldocchi DD, Meyers TP, Hosker RP, Jr, Matt DR. A preliminary multiple resistance routine for deriving dry deposition velocities from measured quantities. Water, Air, and Soil Pollution. 1987;36:311–330. [Google Scholar]
- Hoshika Y, Watanabe M, Inada N, Koike T. Ozone-induced stomatal sluggishness develops progressively in Siebold's beech (Fagus crenata) Environmental Pollution. 2012a;166:152–156. doi: 10.1016/j.envpol.2012.03.013. [DOI] [PubMed] [Google Scholar]
- Hoshika Y, Watanabe M, Inada N, Koike T. Modeling of stomatal conductance for estimating ozone uptake of Fagus crenata under experimentally enhanced free-air ozone exposure. Water, Air, and Soil Pollution. 2012b;223:3893–3901. [Google Scholar]
- Iio A, Yokoyama A, Takano M, et al. Interannual variation in leaf photosynthetic capacity during summer in relation to nitrogen, leaf mass per area and climate within a Fagus crenata crown on Naeba Mountain, Japan. Tree Physiology. 2008;28:1421–1429. doi: 10.1093/treephys/28.9.1421. [DOI] [PubMed] [Google Scholar]
- Karlsson PE, Braun S, Broadmeadow M, et al. Risk assessments for forest trees: the performance of the ozone flux versus the AOT concepts. Environmental Pollution. 2007;146:608–616. doi: 10.1016/j.envpol.2006.06.012. [DOI] [PubMed] [Google Scholar]
- Karnosky D, Percy KE, Chappelka AH, Simpson C, Pikkarainen J. Air pollution, global change and forests in the new millennium. Oxford: Elsevier; 2003. [Google Scholar]
- Katul GG, Palmroth S, Oren R. Leaf stomatal responses to vapour pressure deficit under current and CO2-enriched atmosphere explained by the economics of gas exchange. Plant, Cell and Environment. 2009;32:968–979. doi: 10.1111/j.1365-3040.2009.01977.x. [DOI] [PubMed] [Google Scholar]
- Kikuzawa K. Leaf survival of woody plants in deciduous broad-leaved forests. 1. Tall trees. Canadian Journal of Botany. 1983;61:2133–2139. [Google Scholar]
- Kitao M, Löw M, Heerdt C, Grams TEE, Häberle K-H, Matyssek R. Effects of chronic elevated ozone exposure on gas exchange responses of adult beech trees (Fagus sylvatica) as related to the within-canopy light gradient. Environmental Pollution. 2009;157:537–544. doi: 10.1016/j.envpol.2008.09.016. [DOI] [PubMed] [Google Scholar]
- Koch JR, Scherzer AJ, Eshita SM, Davis KR. Ozone sensitivity in hybrid poplar is correlated with a lack of defense-gene activation. Plant Physiology. 1998;118:1243–1252. doi: 10.1104/pp.118.4.1243. [DOI] [PMC free article] [PubMed] [Google Scholar]
- Koike T. Leaf structure and photosynthetic performance as related to the forest succession of deciduous broad-leaved trees. Plant Species Biology. 1988;3:77–87. [Google Scholar]
- Laisk A, Kull O, Moldau H. Ozone concentration in leaf intercellular air spaces is close to zero. Plant Physiology. 1989;90:1163–1167. doi: 10.1104/pp.90.3.1163. [DOI] [PMC free article] [PubMed] [Google Scholar]
- Leuning R. A critical appraisal of a coupled stomatal–photosynthesis model for C3 plants. Plant, Cell and Environment. 1995;18:339–357. [Google Scholar]
- Levitt J. Responses of plants to environmental stresses. New York: Academic Press; 1972. [Google Scholar]
- Lombardozzi D, Sparks JP, Bonan G, Levis S. Ozone exposure causes a decoupling of conductance and photosynthesis: implications for the Ball–Berry stomatal conductance model. Oecologia. 2012;169:651–659. doi: 10.1007/s00442-011-2242-3. [DOI] [PubMed] [Google Scholar]
- Long SP, Bernacchi CJ. Gas exchange measurements, what can they tell us about the underlying limitations to photosynthesis? Procedures and sources of error. Journal of Experimental Botany. 2003;54:2393–2401. doi: 10.1093/jxb/erg262. [DOI] [PubMed] [Google Scholar]
- Löw M, Herbinger K, Nunn AJ, et al. Extraordinary drought of 2003 overrules ozone impact on adult beech trees (Fagus sylvatica) Trees. 2006;20:539–548. [Google Scholar]
- Mäkelä A, Berninger F, Hari P. Optimal control of gas exchange during drought: theoretical analysis. Annals of Botany. 1996;77:461–467. [Google Scholar]
- Martin MJ, Farage PK, Humphries SW, Long SP. Can the stomatal changes caused by acute ozone exposure be predicted by changes occurring in the mesophyll? A simpification for models of vegetation response to the global increase in tropospheric elevated ozone episodes. Australian Journal of Plant Physiology. 2000;27:211–219. [Google Scholar]
- Matyssek R, Sandermann H. Impact of ozone on trees: an ecophysiological perspective. In: Esser K, Lüttge U, Beyschlag W, Hellwig F, editors. An ecophysiological perspective. Progress in Botany vol. 64. Berlin: Springer-Verlag; 2003. pp. 349–404. [Google Scholar]
- Matyssek R, Günthardt-Goerg MS, Maurer S, Keller T. Nighttime exposure to ozone reduces whole-plant production in Betula pendula. Tree Physiology. 1995;15:159–165. doi: 10.1093/treephys/15.3.159. [DOI] [PubMed] [Google Scholar]
- Matyssek R, Bytnerowicz A, Karlsson P-E, et al. Promoting the O3 flux concept for European forest trees. Environmental Pollution. 2007;146:587–607. doi: 10.1016/j.envpol.2006.11.011. [DOI] [PubMed] [Google Scholar]
- McAinsh MR, Evans NH, Montgomery LT, North KA. Calcium signalling in stomatal responses to pollutants. New Phytologist. 2002;153:441–447. doi: 10.1046/j.0028-646X.2001.00336.x. [DOI] [PubMed] [Google Scholar]
- Medlyn BE, Duursma RA, Eamus D, et al. Reconciling the optimal and empirical approaches to modeling stomatal conductance. Global Change Biology. 2011;17:2134–2144. [Google Scholar]
- Medlyn BE, Duursma RA, Eamus D, et al. Corrigendum: reconciling the optimal and empirical approaches to modeling stomatal conductance. Global Change Biology. 2012;18:3476. [Google Scholar]
- Mills G, Hayes F, Wilkinson S, Davies WJ. Chronic exposure to increasing background ozone impairs stomatal functioning in grassland species. Global Change Biology. 2009;15:1522–1533. [Google Scholar]
- Mills G, Pleijel H, Büker P, et al. Revision undertaken in Summer 2010 to include new flux-based critical levels and response functions for ozone, in: Mapping Manual 2004. International Cooperative Programme on Effects of Air Pollution on Natural Vegetation and Crops. Mapping critical levels for vegetation. 2010 http://icpvegetation.ceh.ac.uk/manuals/mapping_manual.html . [Google Scholar]
- Nunn AJ, Reiter IM, Häberle K-H, et al. ‘Free-air’ ozone canopy fumigation in an old-growth mixed forest: concept and observations in beech. Phyton. 2002;42:105–119. [Google Scholar]
- Oksanen E. Responses of selected birch (Betula pendula Roth) clones to ozone change over time. Plant, Cell and Environment. 2003;26:875–886. doi: 10.1046/j.1365-3040.2003.01020.x. [DOI] [PubMed] [Google Scholar]
- Oksanen E, Kontunen-Soppela S, Riikonen J, Peltonen P, Uddling J, Vapaavuori E. Northern environment predisposes birches to ozone damage. Plant Biology. 2007;9:191–196. doi: 10.1055/s-2006-924176. [DOI] [PubMed] [Google Scholar]
- Ollinger SV, Aber JD, Reich PB. Simulating ozone effects on forest productivity: interactions among leaf-, canopy-, and stand-level processes. Ecological Applications. 1997;7:1237–1251. [Google Scholar]
- Omasa K, Abo F, Natori T, Totsuka T. Studies of air pollutant sorption by plants. (II) Sorption under fumigation with NO2, O3 or NO2 + O3. Journal of Agricultural Meteorology. 1979;35(77–83) (in Japanese with English summary) [Google Scholar]
- Oren R, Sperry JS, Katul GG, et al. Survey and synthesis of intra- and interspecific variation in stomatal sensitivity to vapour pressure deficit. Plant, Cell and Environment. 1999;22:1515–1526. [Google Scholar]
- Paoletti E. Ozone slows stomatal response to light and leaf wounding in a Mediterranean evergreen broadleaf, Arbutus unedo. Environmental Pollution. 2005;134:439–445. doi: 10.1016/j.envpol.2004.09.011. [DOI] [PubMed] [Google Scholar]
- Reich PB. Quantifying plant response to ozone: a unifying theory. Tree Physiology. 1987;3:63–91. doi: 10.1093/treephys/3.1.63. [DOI] [PubMed] [Google Scholar]
- Reiling K, Davison AW. Effects of ozone on stomatal conductance and photosynthesis in populations of Plantago major L. New Phytologist. 1995;129:587–594. [Google Scholar]
- Robinson MF, Heath J, Mansfield TA. Disturbance in stomatal behavior caused by air pollutants. Journal of Experimental Botany. 1998;49:461–469. [Google Scholar]
- Sitch S, Cox PM, Collins WJ, Huntingford C. Indirect radiative forcing of climate change through ozone effects on the land-carbon sink. Nature. 2007;448:791–795. doi: 10.1038/nature06059. [DOI] [PubMed] [Google Scholar]
- Skäby L, Troeng E, Boström CA. Ozone uptake and effects on transpiration, net photosynthesis, and dark respiration in Scots pine. Forest Science. 1987;33:801–808. [Google Scholar]
- Tausz M, Grulke NE, Wieser G. Defense and avoidance of ozone under global change. Environmental Pollution. 2007;147:525–531. doi: 10.1016/j.envpol.2006.08.042. [DOI] [PubMed] [Google Scholar]
- Taylor GE., Jr. Plant and leaf resistance to gaseous air pollution stress. New Phytologist. 1978;80:523–534. [Google Scholar]
- Terashima I. Photosynthesis at leaf and individual level. In: Sato K, editor. Photosynthesis. Tokyo, 125–149: Asakura; 2002. (in Japanese) [Google Scholar]
- Torsethaugen G, Pell EJ, Assmann SM. Ozone inhibits guard cell K+ channels implicated in stomatal opening. Proceedings of the National Academy of Sciences, USA. 1999;96:12577–12582. doi: 10.1073/pnas.96.23.13577. [DOI] [PMC free article] [PubMed] [Google Scholar]
- Uddling J, Teclaw RM, Pregitzer KS, Ellsworth DS. Leaf and canopy conductance in aspen and aspen–birch forests under free-air enrichment of carbon dioxide and ozone. Tree Physiology. 2009;29:1367–1380. doi: 10.1093/treephys/tpp070. [DOI] [PubMed] [Google Scholar]
- Umemoto-Mori M, Izuta T, Koike T. Application of simple infiltration method for evaluating stomatal patchiness in beech leaves treated with O3 and high CO2. Forest Resources Environment. 1998;36:19–25. [Google Scholar]
- Vahisalu T, Puzorjova I, Brosche M, et al. Ozone-triggered rapid stomatal response involves the production of reactive oxygen species, and is controlled by SLAC1 and OST1. The Plant Journal. 2010;62:442–453. doi: 10.1111/j.1365-313X.2010.04159.x. [DOI] [PubMed] [Google Scholar]
- Vingarzan R. A review of surface ozone background levels and trends. Atmospheric Environment. 2004;38:3431–3442. [Google Scholar]
- Volz A, Kley D. Evaluation of the Montsouris series of ozone measurements made in the nineteenth century. Nature. 1988;332:240–242. [Google Scholar]
- Watanabe M, Watanabe Y, Kitaoka S, Utsugi H, Kita K, Koike T. Growth and photosynthetic traits of hybrid larch F1 (Larix gmelinii var. japonica × L. kaempferi) under elevated CO2 concentration with low nutrient availability. Tree Physiology. 2011;31:965–975. doi: 10.1093/treephys/tpr059. [DOI] [PubMed] [Google Scholar]
- Watanabe M, Hoshika Y, Inada N, Wang X, Mao Q, Koike T. Photosynthetic traits of Siebold's beech and oak saplings grown under free air ozone exposure. Environmental Pollution. 2013a;174:50–56. doi: 10.1016/j.envpol.2012.11.006. [DOI] [PubMed] [Google Scholar]
- Watanabe M, Hoshika Y, Inada N, Koike T. Canopy carbon budget of Siebold's beech (Fagus crenata) sapling under free air ozone exposure. Environmental Pollution. 2013b doi: 10.1016/j.envpol.2013.04.018. in press. doi:10.1016/j.envpol.2013.04.018. [DOI] [PubMed] [Google Scholar]
- Weber JA, Clark CS, Hogsett WE. Analysis of the relationships among O3 uptake, conductance, and photosynthesis in needles of Pinus ponderosa. Tree Physiology. 1993;13:157–172. doi: 10.1093/treephys/13.2.157. [DOI] [PubMed] [Google Scholar]
- Werner H, Fabian P. Free-air fumigation of mature trees: a novel system for controlled ozone enrichment in grown-up beech and spruce canopies. Environmental Science and Pollution Research. 2002;9:117–121. doi: 10.1007/BF02987458. [DOI] [PubMed] [Google Scholar]
- Wieser G, Havranek WM. Environmental control of ozone uptake in Larix decidua Mill.: a comparison between different altitudes. Tree Physiology. 1995;15:253–258. doi: 10.1093/treephys/15.4.253. [DOI] [PubMed] [Google Scholar]
- Wieser G, Tegischer K, Tausz M, Häberle K-H, Grams TEE, Matyssek R. Age effects on Norway spruce (Picea abies) susceptibility to ozone uptake: novel approach relating stress avoidance to defense. Tree Physiology. 2002;22:583–590. doi: 10.1093/treephys/22.8.583. [DOI] [PubMed] [Google Scholar]
- Wilkinson S, Davies W. Drought, ozone, ABA and ethylene: new insights from cell to plant community. Plant, Cell and Environment. 2010;33:510–525. doi: 10.1111/j.1365-3040.2009.02052.x. [DOI] [PubMed] [Google Scholar]
- Wittig VE, Ainsworth EA, Long SP. To what extent do current and projected increases in surface ozone affect photosynthesis and stomatal conductance of trees? A meta-analytic review of the last 3 decades of experiments. Plant, Cell and Environment. 2007;30:1150–1162. doi: 10.1111/j.1365-3040.2007.01717.x. [DOI] [PubMed] [Google Scholar]
- Yamaguchi M, Watanabe M, Iwasaki M, et al. Growth and photosynthetic responses of Fagus crenata seedlings to O3 under different nitrogen loads. Trees. 2007;21:707–718. [Google Scholar]
- Yonekura T, Honda Y, Oksanen E, et al. The influences of ozone and soil water stress, singly and in combination, on leaf gas exchange rates, leaf ultrastructural characteristics and annual ring width of Fagus crenata seedlings. Journal of the Japan Society of Atmospheric Environment. 2001;36:333–351. [Google Scholar]