Abstract
Positron emission tomography (PET) detectors based on continuous scintillation crystals can achieve very good performance and have a number of practical advantages compared to detectors based on a pixelated array of crystals. Our goal is to develop a thick continuous detector with high energy and spatial resolution, along with high γ-photon capture efficiency. We examine the performance of two crystal blocks: a 46 × 46 × 14 mm3 and a 48 × 48 × 25 mm3 block of LYSO (Lutetium Yttrium Orthosilicate). Using Maximum Likelihood (ML) positioning based upon the light response function (LRF) in the 14 mm thick crystal, we measure a spatial resolution of 3 mm in the central region of the crystal with degradation near the edges due to reflections off the crystal sides. We also show that we can match the spatial resolution achieved using a 14 mm thick crystal by using a 25 mm thick crystal with slots cut into the gamma entrance surface to narrow the LRF. We also find that we can improve the spatial resolution performance near the detector edges by reducing the reflectivity of the crystal sides, albeit with some loss in energy resolution.
I. Introduction
Large, continuous NaI(Tl) detectors have been used in single photon imaging for more that 40 years, providing good spatial resolution (3 mm) with thin detectors (9–12 mm) and large PMTs [1], [2]. This detector concept was then extended to a 3-dimensional scanner with two opposing rotating large area detectors used for coincidence imaging of photons from positron annihilation [3]. Subsequently, large, continuous NaI(TI) (Sodium Iodide) detectors optimized for PET with up to 25 mm thickness were developed which took advantage of the high scintillator light output to achieve 5 – 6 mm spatial resolution [4]–[7]. These detectors were systematically improved through the 1980–1990’s using a variety of techniques, including local positioning with Anger logic, delay-line pulse clipping, and surface treatments to optimize detector performance, especially at higher count-rates [4], [8], [9]. The spatial resolution of these thick, continuous detectors was, however, limited by the change in light distribution as a function of interaction depth of the 511 keV within the detector.
Continuous NaI(Tl) detector design for PET evolved into a detector using discrete crystals (NaI(Tl)) [10], GSO (Gadolinium Oxyorthosilicate) [11] and LYSO [12]) coupled to a continuous lightguide and large PMTs (pixelated Anger-logic detectors). This detector design narrows the light spread within the detector and makes it independent of the 511 keV photon interaction depth within the crystal, leading to an improved spatial resolution of 4 – 5 mm with 4 mm wide and 20–30 mm thick crystals. The use of GSO or LYSO instead of NaI(Tl) also led to increased sensitivity due to higher stopping power, and improved count-rate capability due to shorter decay time. In the case of LYSO it led to the development of time-of-flight (TOF) PET scanner based on a similar Anger-logic detector design [13]. The spatial resolution performance of the pixelated Anger-logic detectors is similar to the block and quadrant-sharing block detector designs developed using pixelated BGO (Bismuth Germinate), LSO or LYSO crystals coupled to smaller PMTs [14]–[16], though in general there is a trade-off as the pixelated Anger-logic detectors tend to use larger (and fewer) PMTs to maximize the crystal encoding ratio at the expense of count-rate capability.
With pixelated detectors, good performance and high spatial resolution has also been demonstrated using 2 mm wide crystals in a brain scanner [16] and 1 mm wide crystals in a small animal scanner [17]. The question that arises is whether better spatial resolution for PET can be achieved with continuous detectors than previously achieved with thick NaI(Tl), and with improved sensitivity and count-rate performance. As shown previously by Rogers, et. al. [18], the light spread in a thick continuous detector varies as a function of depth-of-interaction (DOI), as well as the transverse interaction position, leading to a degradation in the transverse spatial resolution. However, the change in light spread could be used to measure the DOI and improve the spatial resolution. Another consequence of this DOI measurement capability would be to reduce parallax error in the reconstructed spatial resolution from a PET scanner utilizing such a thick continuous detector.
The development of LSO and LYSO provides crystals which have a combination of high light output (~75% of NaI(Tl)), high stopping power, fast decay time, and an ability to be grown into small continuous blocks of crystals. Advances in photo-detector technology such as the development of multi-anode PMTs and arrays of silicon photo-multipliers give us the ability to achieve higher sampling of the scintillation light spread in the detector. Finally, the use of more sophisticated statistical theory based positioning algorithms, such as Maximum Likelihood (ML) positioning [19]–[20], neural networks [21], or the k-nearest neighbor (k-NN) algorithm [22], can provide advantages of improved spatial resolution and linearity, especially near the crystal edges. A combination of these developments provides the potential for development of a thick continuous detector with high spatial resolution and DOI measurement capability. Such a detector could also potentially be less costly than a high resolution pixelated detector due to a reduction in raw material waste which arises when cutting small pixels.
Consequently, recent work has focused on making high-resolution PET detectors using < 15 mm thick, continuous LYSO crystals coupled to position sensitive photo-detectors [23]–[27] with an application geared towards brain and small animal imaging. Several DOI decoding methods for continuous scintillator detectors have also been described in the literature. Many of these rely on the correlation between the DOI and the width of the light distribution on the photosensor [23], [27]–[28] and/or make use of a model of the light transport in the crystal that is either simulated/calculated or fitted to measured data [29]–[31].
Our research focus is on the development of thicker (25 mm) continuous detectors with an application towards human brain and whole-body imaging. In this paper we demonstrate the performance of a 25 mm thick continuous LYSO detectors coupled to a multi-anode PMT, while using a 14 mm thick LYSO crystal as a benchmark. Our focus is not on extracting DOI information, but on the use of surface treatments (cutting slots in the detector entrance surface and using a low-reflectivity black paint) to shape the light spread within the detector to improve spatial resolution. Our goal is to achieve spatial resolution of < 4 mm using a thick, continuous crystal that gives us sensitivity that matches or exceeds commercial whole-body PET scanners.
II. Materials & Methods
A. Materials
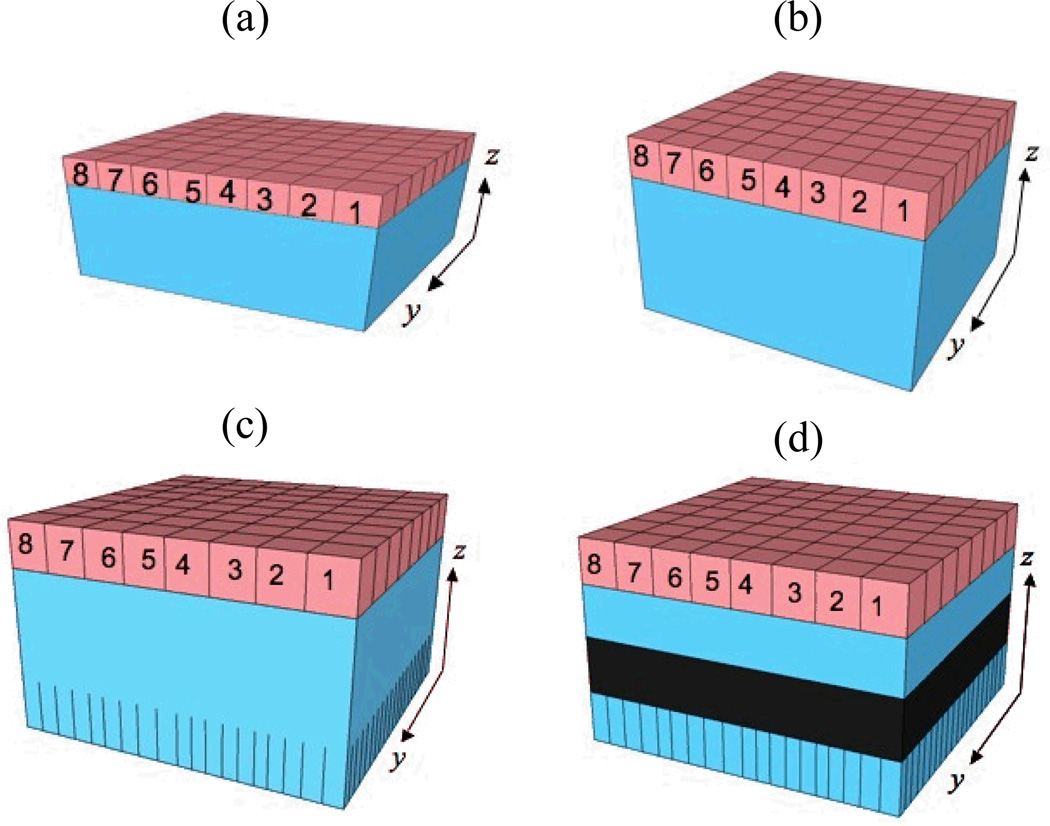
For the first set of measurements we characterize the spatial and energy resolution performance of a 46 × 46 × 14 mm3 block of LYSO. The crystal sides are polished and the gamma entrance surface is diffuse. The 5 sides are Teflon wrapped (figure 1a).
Figure 1.
(a) Teflon wrapped 46×46×14mm3 LYSO crystal on an 8×8 channel multi-anode PMT, (b) Teflon wrapped 48×48×25mm3 LYSO crystal, (c) Teflon wrapped 48×48×25mm3 LYSO crystal with 8mm deep slots cut into the entrance surface with a pitch of 2mm in x–y. No reflector is used in the slots (d) Teflon wrapped 48×48×25mm3 LYSO crystal with 8mm deep slots cut into the entrance surface with a pitch of 2.48mm in x–y. The sides of the crystal are painted with a low reflectivity paint in the region of z = 8–16mm. The rest of the crystal is Teflon wrapped.
For the second set of measurements we use a 48 × 48 × 25 mm3 LYSO crystal, as it almost doubles the coincident photopeak efficiency compared to a 14 mm thick LYSO detector. The crystal sides are polished, and the gamma entrance surface is diffuse and painted white (figure 1b). The 4 sides of the crystal are Teflon wrapped.
For the 48 × 48 × 25 mm3 LYSO crystal we also investigated cutting slots in the crystal entrance surface in order to channel scintillation photons directly into the PMT. The motivation for cutting the slots comes from prior work done by our group with continuous NaI(Tl) detectors [32], which showed that slots cut into the entrance surface of a thick, continuous detector narrows the light spread without leading to a pixelated detector design. 8 mm is the deepest we can cut without having to increase the cutting blade thickness beyond 0.5 mm, which would cause a reduction in the crystal sensitivity. Therefore, as a feasibility study, we cut 8 mm deep slots into the gamma entrance surface of the 48 × 48 × 25 mm3 LYSO crystal. Cutting deeper than 8 mm would not be desirable either as we know that cutting deep slots in a continuous detector leads to a discrete behavior of the detector in its position determination in the region between adjacent slots [32]. The pitch of the slots is 2.48 mm with a cut width of 0.48 mm. The 4 sides of the crystal were wrapped in Teflon (figure 1c). The white paint was not removed from the crystal entrance surface prior to the cutting of the slots.
Lastly, in order to cut down on reflections of the scintillation photons from the crystal sides we paint the slotted crystal with low reflectivity paint in an 8 mm band around the crystal sides below the slots (z = 8 – 16 mm). The region from z = 16 – 25 mm, and the entrance surface are Teflon wrapped (figure 1d). The region z = 16 – 25 mm is not painted black since the scintillation light from photons interacting that deep within the crystal is not expected to spread very far and, therefore, have a narrow light spread. Therefore, it is convenient for us to choose a band thickness such that the crystal sides can be divided into three equal sized zones with different surface treatments.
B. Measurement Setup
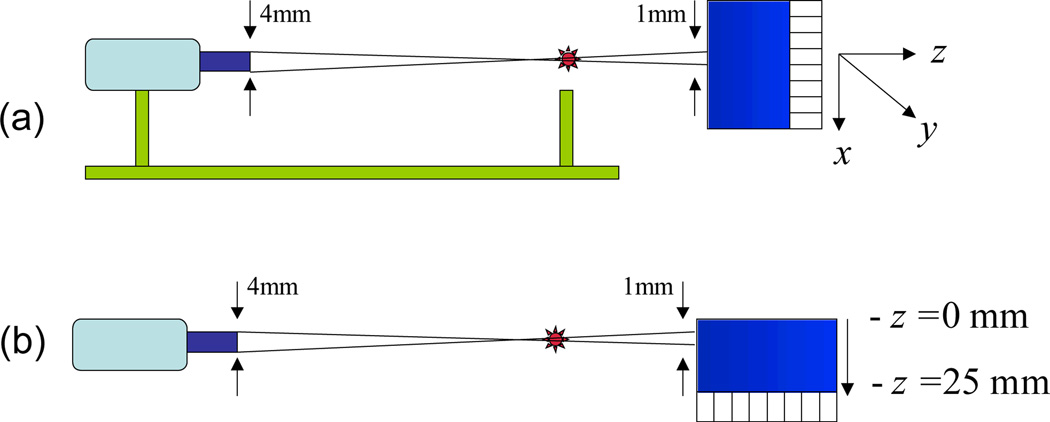
All measurements were made in coincidence with a 4 × 4 × 30 mm3 LYSO crystal mounted on a Photonis XP20D0 PMT, using a 22Na source that was mounted on the same stage as the reference PMT to allow them to move together. The source was geometrically collimated to provide an incident beam width of 1 mm on the continuous crystal surface (see figure 2a). In all our measurements we do not correct for the finite width of the gamma beam incident on the detector. The photosensor used was a Hamamatsu H8500 multi-anode PMT, which has an 8 × 8 array of photosensors with a combined effective area of 49 × 49 mm2.
Figure 2.
(a) Experimental setup for performing Head-on Incidence Measurements. It shows the 25mm thick continuous crystal on the H8500 PMT, the 22Na source, and the reference crystal. (b) Experimental setup for performing Fixed Depth Measurements to control the DOI of interacting events.
Two types of scans were performed: (1) Head-on incidence scans (see figure 2a), and (2) Fixed depth scans (see figure 2b). In head-on incidence scans the gammas are incident normal to the crystal surface and ML weights are calculated with no prior knowledge of the depth of interaction (DOI) of the interacting events. The × coordinate of the scan ranges from edge to edge depending on the crystal size, and both y, z = 0 mm (figure 2a). In fixed depth scans the gammas are incident on the crystal side at a fixed depth to control the DOI, and scanned edge to edge. Separate depth dependent ML weights were calculated for event positioning at each fixed depth.
Data acquisition was performed using a combination of NIM and CAMAC commercial electronics. Six LeCroy 12 channel ADCs were used to measure the energy of each of the individual 64 anodes. The data acquisition system is controlled by a LabVIEW system that allows us to display the ADC data in real time, as well as record the data for more advanced post-processing. All calibration and positioning data were acquired only for photopeak events.
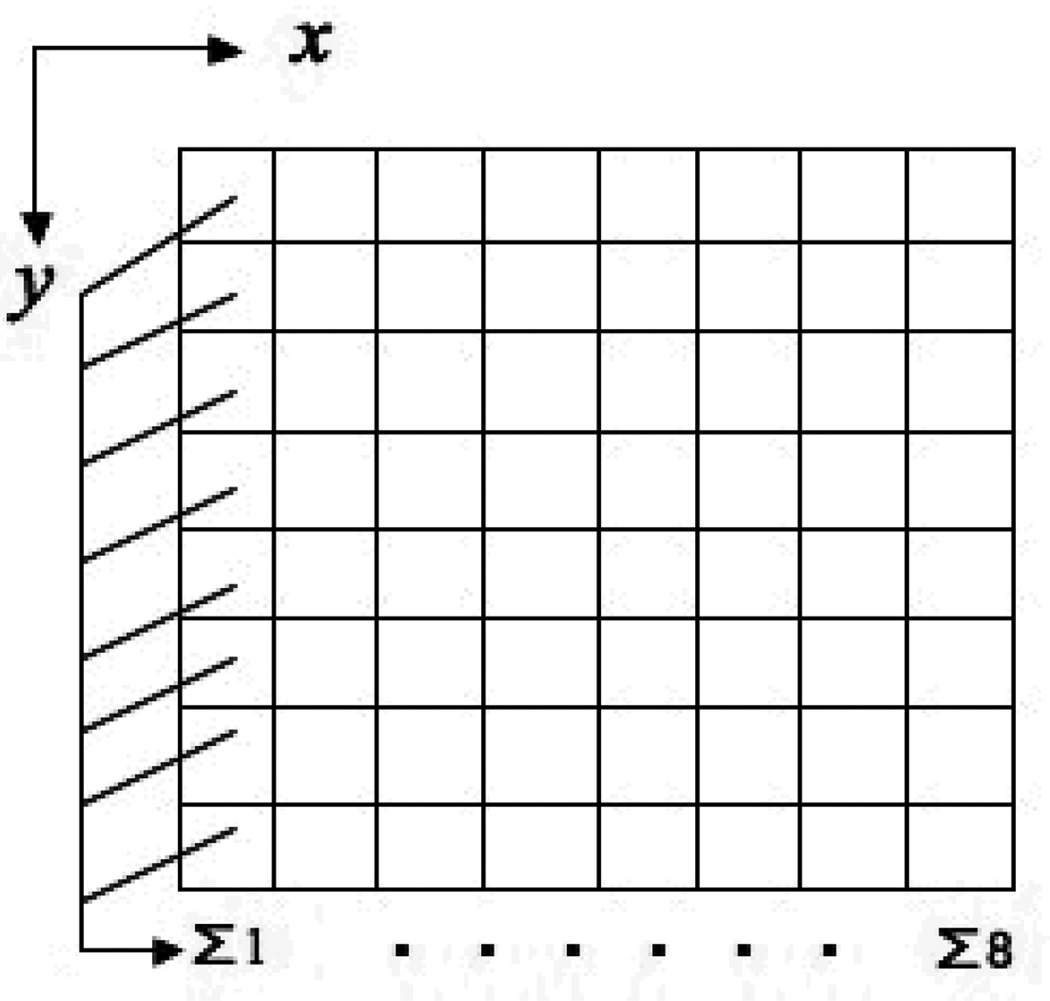
In software, data from the 2-D matrix of 64 anodes is reduced into two orthogonal 1-D arrays of eight summed anodes along × and y directions. In figure 3 we show schematically row-summing of eight anodes to produce a 1-D array of eight summed anodes along the × direction. A similar, but orthogonal, column-summing procedure is used to produce eight summed anodes along the y direction. After summing, the light response histogram is fit to a Gaussian to obtain the peak. We can also change the effective size of the anodes from 6.125 mm to 12.25 mm by further summing the 8 adjacent columns into 4.
Figure 3.
Row-summing of the 64 anodes in the y-direction to create a 1D array of eight summed anodes (columns) along the × direction with a 6.125mm pitch. Adjacent columns can be further summed to change the effective anode size from 6.125mm to 12.25mm.
In the case of the 14 mm thick crystal, we calculated the same spatial resolution using row and column summed anodes with 1-D positioning algorithms or a fully 2-D positioning algorithm. Hence, for all work presented here, we use the row and column summing procedure with orthogonal 1-D positioning algorithms.
C. Maximum Likelihood Positioning Algorithm
For positioning we use the Maximum Likelihood (ML) positioning [20] algorithm to determine the 511 keV photon incident position in the detector. Although the algorithm is unchanged from the reference, a brief outline is provided and is as follows.
Under the assumption that the interaction coordinates can be derived independently and the noise process is Poisson, a series of weights are pre-calculated independently using acquired calibration data at several finely spaced x, positions within the detector. The weights are calculated using the following equation:
| (1) |
where x is the incident position in the detector, N is the total number of photosensors, and n̄i(x) is the mean number of photoelectrons generated in the ith photosensor, defined as the detector Light Response Function (LRF), as a function of incident position x.. Once we have calculated these weights, the position of the incident beam in the detector is determined to be the position x which best satisfies the equation:
| (2) |
The shape of the detector LRF is determined by the intrinsic light spread in the photodetector array and is a function of the photodetector size and arrangement as well as the scintillator surface properties. In our work, 1-D LRFs (after row-column summing) were generated by moving the source along the x-direction, and measuring the energy peak for each row and column sum of anodes as a function of source position. The measured LRF was then fit to a spline function before using equation (1) to calculate the weights. While the weight calculations, and subsequent positioning, in this detector will be continuous, here we calculated weights at position increments of 0.25 mm.
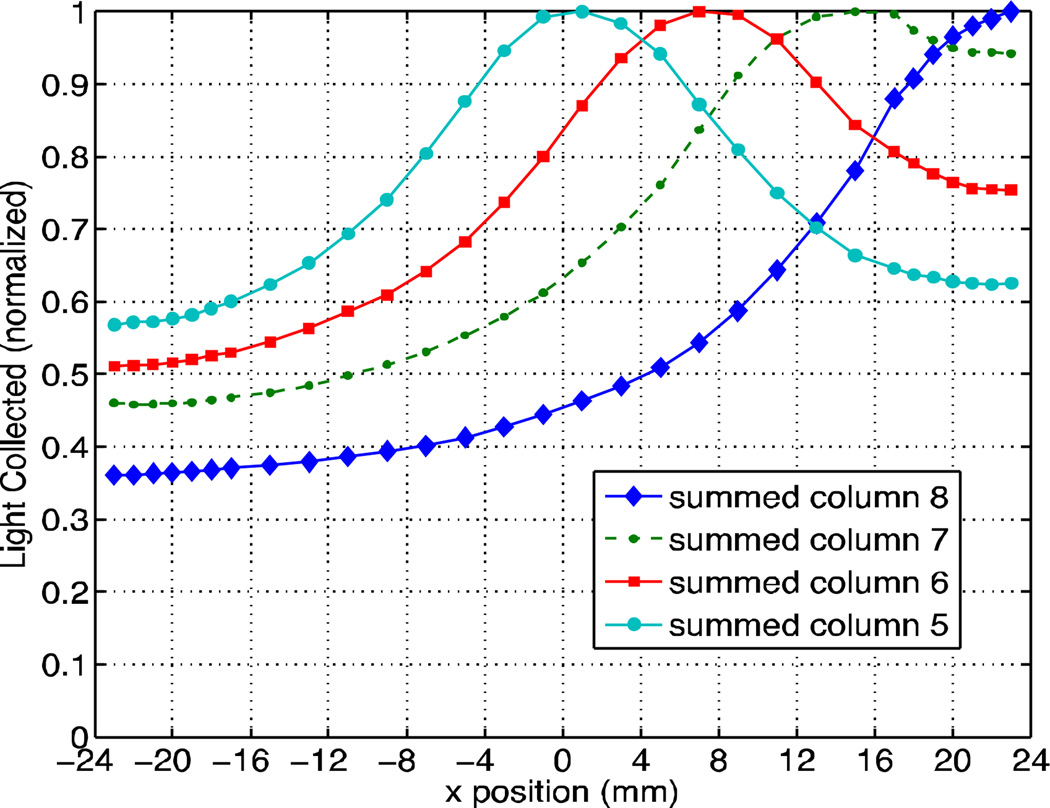
As per equation (1) the calculation of the weights involves taking the derivative of the LRF. Thinner crystals have a sharper LRF due to less spreading of the scintillation light. Near the edges of the detector the LRF curves may not change as sharply, or at all, due to edge reflection (for example, see figure 4). As the success of the algorithm depends on the derivative of the LRF, the error in position estimation increases near the edges where the LRF gradient is small. We account for any bias in the positioning by doing a local calibration of the position centroids to get the spatial resolution. Thinner crystals, therefore, are expected to have better spatial resolution than thicker crystals, as the derivative of their LRF is a strongly changing function of the x–y position.
Figure 4.
LRF of 46×46×14mm3 LYSO crystal. The 64 channels of the MA-PMT were summed to create eight 1-D columns, four of which are shown representing half the detector.
III. Results
A. Measurements with 46 × 46 × 14 mm3 LYSO Crystal
Figure 4 shows the measured LRF for the 46 × 46 × 14 mm3 crystal obtained in 2 mm increments along a straight line going from the crystal center to the edge in a head-on incidence measurement. We only show the four curves most relevant to the ML position calculation in the range of x = 0–23 mm (crystal center to edge). The four curves correspond to row-summed columns 5 – 8 as shown in figure 3 (the response is mirrored in columns 1 – 4). This LRF represents interactions occurring over all DOIs within the crystal.
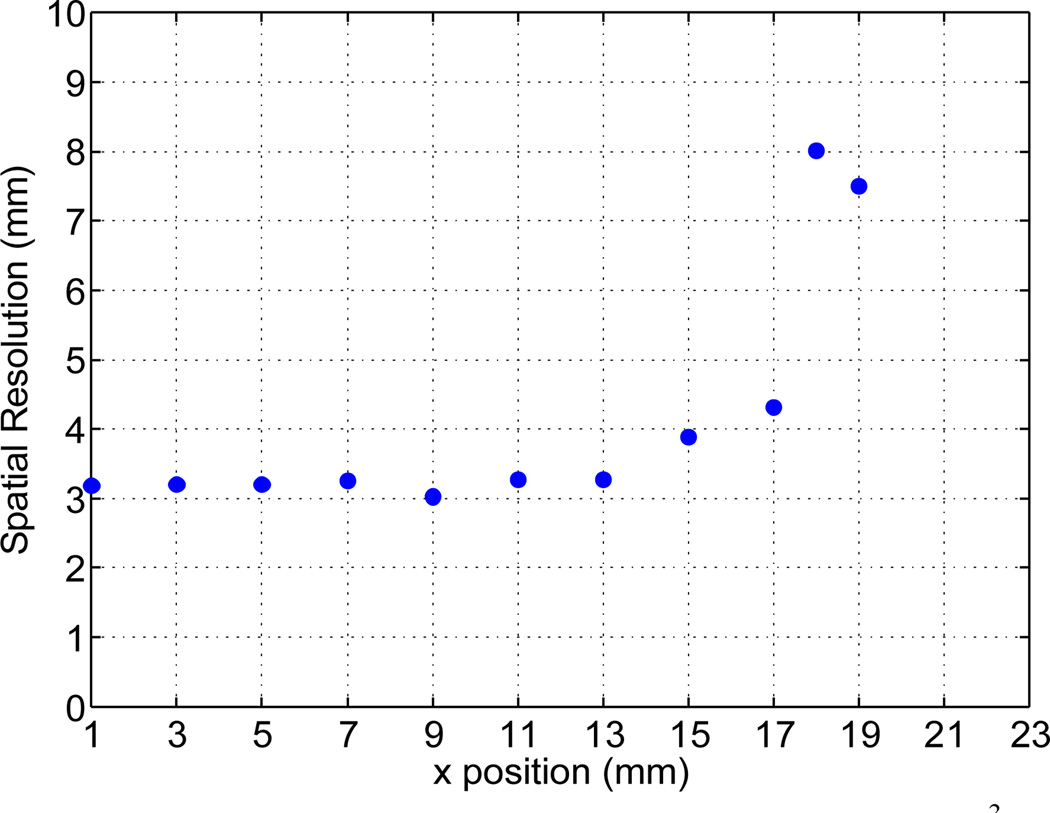
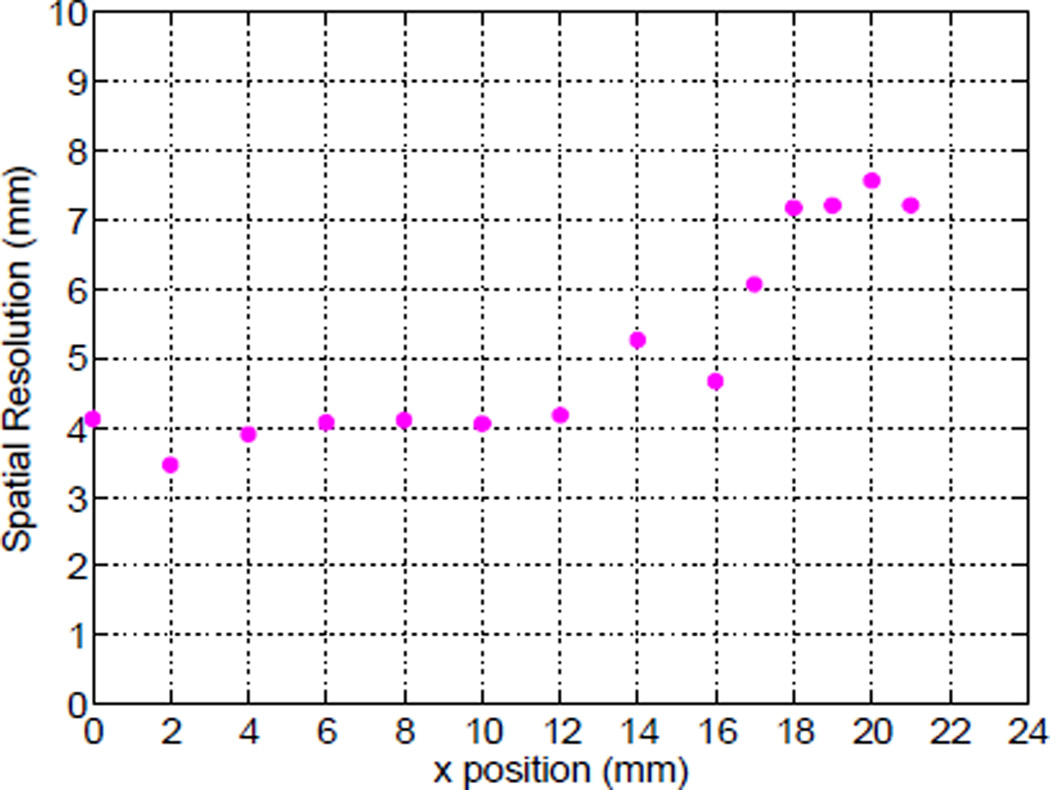
The calculated spatial resolution is shown in figure 5. The energy resolution of the crystal is an average of 10.5% across the entire crystal surface (min. 9.7%, max. 11.2%). Uniform spatial resolution is measurable up to 13 mm out from the crystal center and degrades significantly beyond 17 mm. Note that the spatial resolution is shown in increments of either 1 or 2 mm for all figures, but the detector provides continuous positioning and in our work we calculate position increments of 0.25 mm based on our ML weights.
Figure 5.
Head-on spatial resolution of 46×46×14mm3 LYSO crystal on the multi-anode PMT. The crystal was scanned at incremental × positions across the center of the crystal face from the center (x=0mm) to the edge (x=23mm).
The resolution near the edge of the crystal is degraded due to reflections of the scintillation photons off the crystal sides. Figure 4 shows that there is not enough position sensitivity due to little change in the LRF in the edge region of 19 – 23 mm as the derivatives of the LRFs of each of the anode sums are almost zero. This lack of position information leads to non-linearity in the calculated position near the crystal edge and a degradation of spatial resolution.
B. Measurements with 48 × 48 × 25 mm3 LYSO Crystal
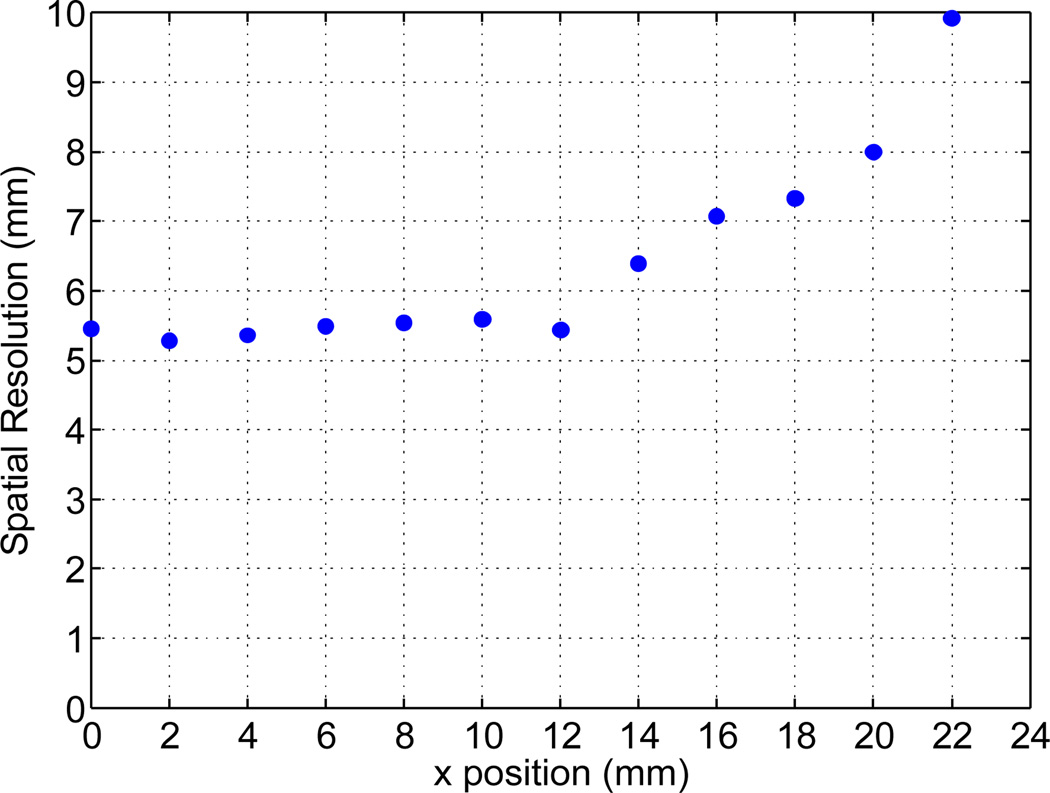
Figure 6 shows the calculated spatial resolution in the 48 × 48 × 25 mm3 crystal for head-on beam incidence. By using a 25 mm thick crystal instead of a 14 mm thick crystal we can almost double the photopeak (above 400 keV) coincidence sensitivity. However, the spatial resolution in the central area of the thicker crystal is 5.5 mm and degrades quickly beyond 16 mm. The energy resolution of this crystal is on average 13.5% for 511 keV gammas (min. 12.1%, max. 13.9%). We found that the light output of the 14 mm crystal is 1.5 times greater than the 25 mm thick crystal, which explains the poorer energy resolution of the 25 mm thick crystal.
Figure 6.
Head-on spatial resolution of 48×48×25mm3 LYSO crystal calculated using ML positioning. The crystal was scanned at incremental × positions across the center of the crystal face from the center (x=0mm) to the edge (x=24mm).
There are three possible effects that limit the spatial resolution in a 25 mm thick crystal relative to a 14 mm thick crystal: (1) the increased effect of DOI on LRF: due to events interacting at different depths within the crystal (DOI) the LRF changes as a function of depth (z), (2) impact of LRF spread: a thicker crystal has a wider LRF than a thinner crystal and, therefore, worse resolution given similar noise characteristics, (3) impact of reflections off crystal sides: the resolution near the crystal edges is poor due to reflections.
C. Impact of DOI on LRF in a Continuous LYSO Crystal
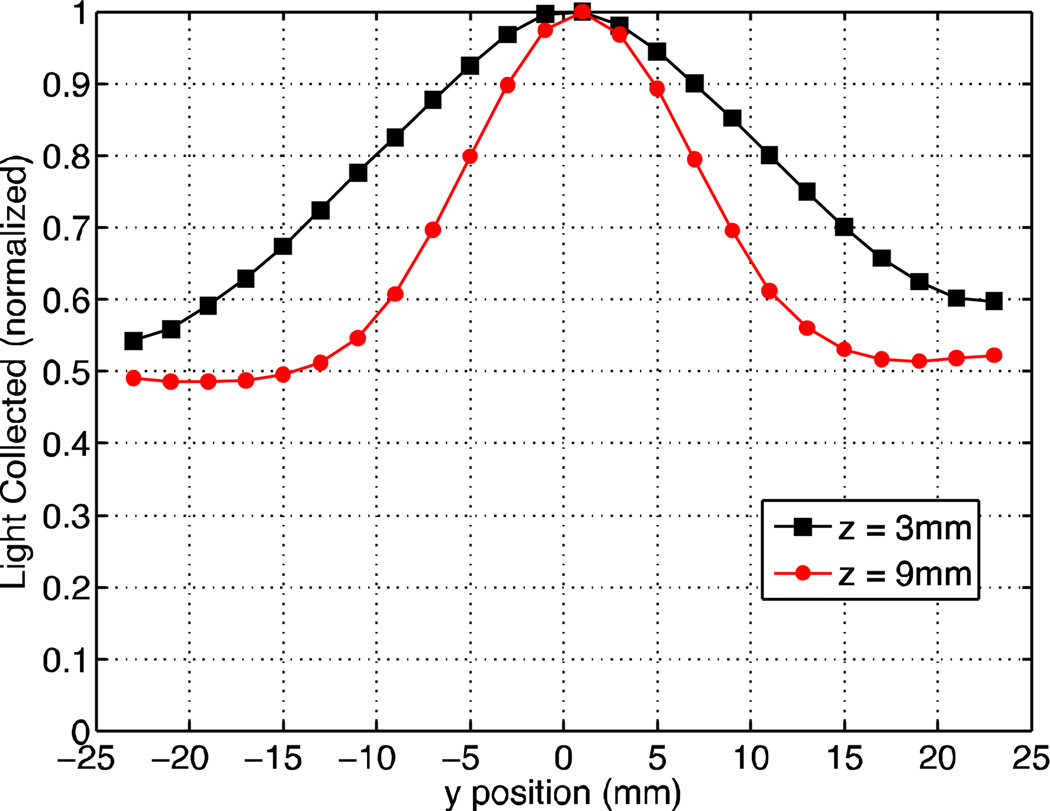
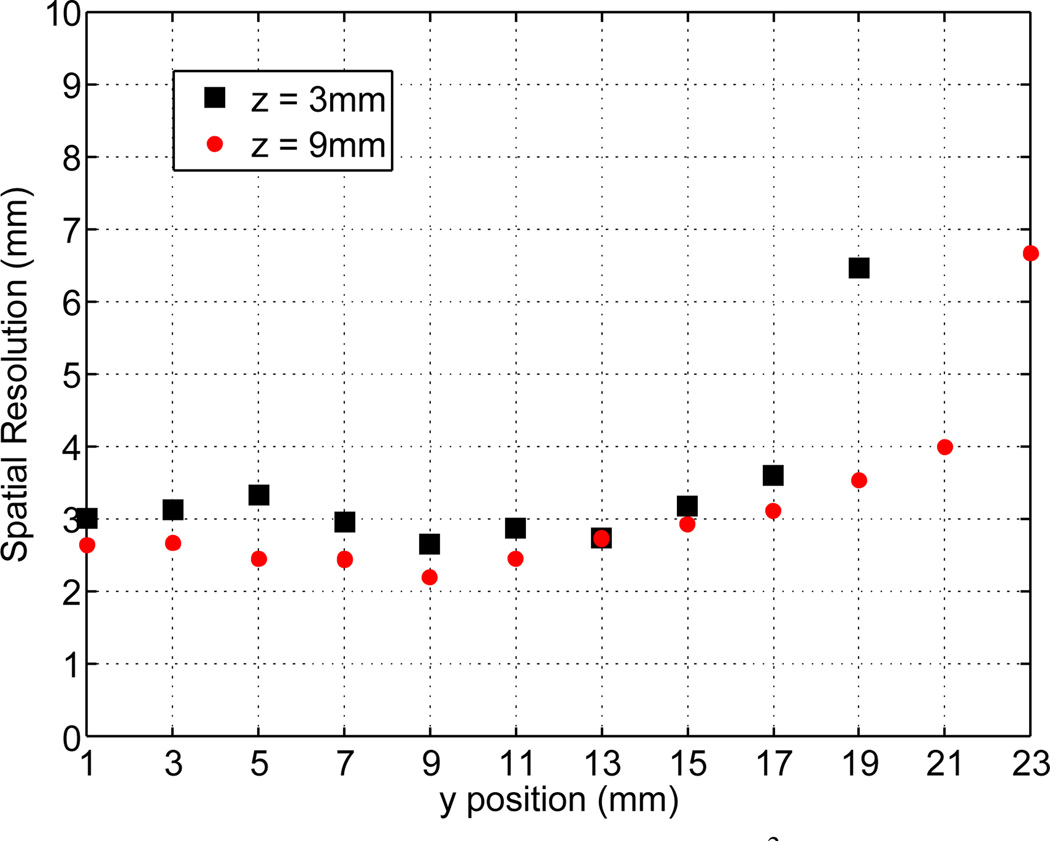
Figure 7 shows the LRF for a single summed column near the center of the PMT (row-summed column 5) measured for two different depths in the 14 mm thick crystal using the fixed depth measurement setup. We observe that in the thin crystal, events interacting closer to (z = 9 mm) and further away (z = 3 mm) from the PMT have some difference in the LRF shape, which leads to some variability in the calculated position as a function of DOI. The spatial resolution at the two fixed depths is very similar in the central region of the crystal (figure 8). Comparing to the results shown in figure 5 for head-on measurements, we find that the spatial resolution in this central region without any prior depth information does not degrade much due to changes in the calculated position as a function of DOI. However, for interactions near the PMT (z = 9 mm), the narrow LRF (see figure 7) leads to improved spatial resolution near the crystal edges.
Figure 7.
14mm thick crystal: LRF of the row-summed channel near the PMT center at two depths: z = 3 and 9 mm. The gammas were incident on the crystal side to control the DOI.
Figure 8.
Spatial resolution of 46×46×14mm3 LYSO crystal at two depths: z = 3 and 9 mm. The gammas were incident on the crystal side to control the DOI.
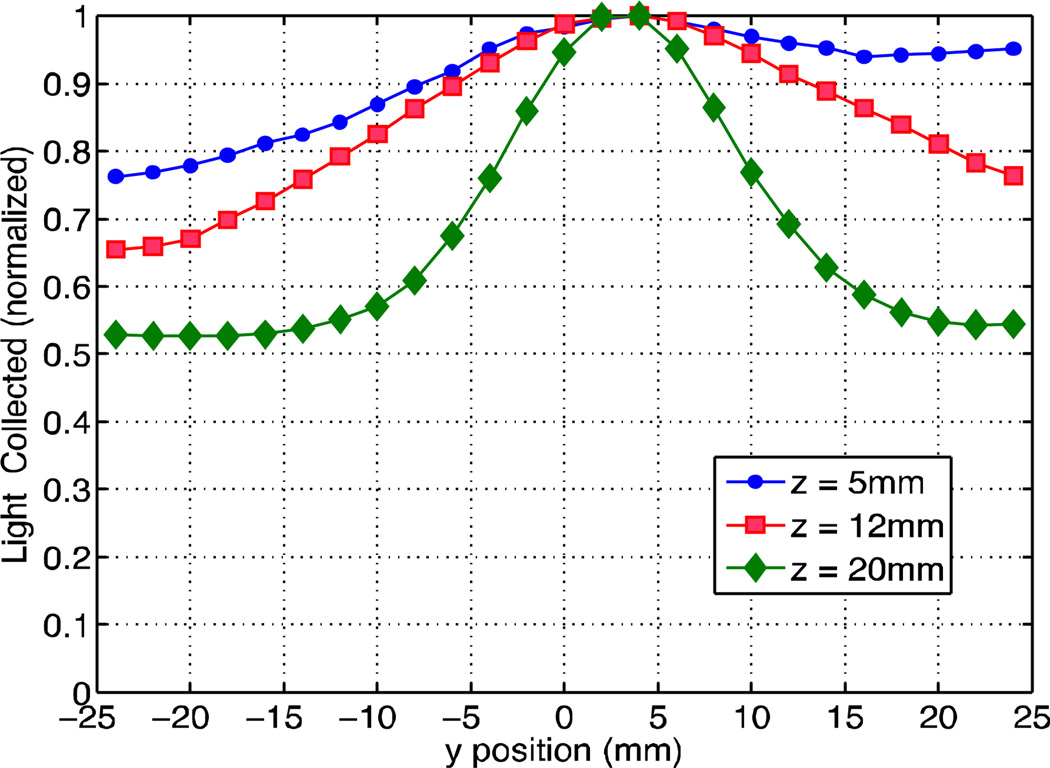
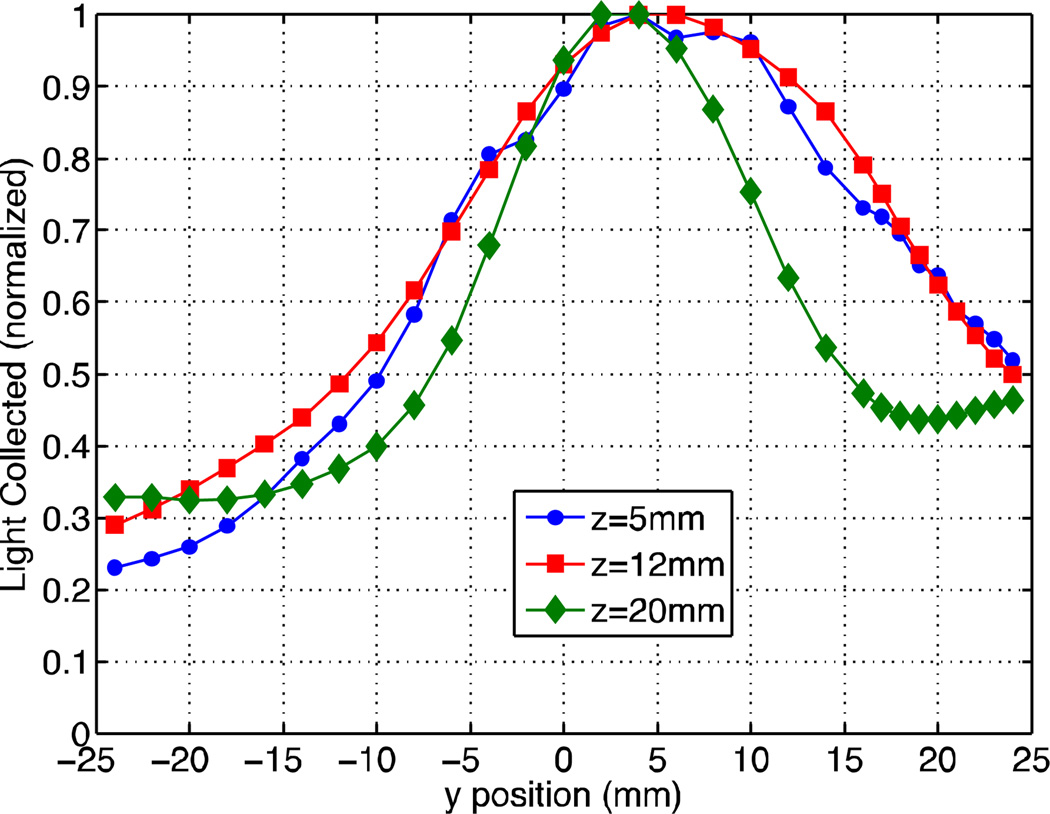
Figure 9 shows the LRF for a single summed column near the center of the PMT (row-summed column 5) measured for three different depths in the 25 mm thick crystal using the fixed depth measurement setup. We now observe that events that interact at small z have a much wider LRF in contrast to events that interact near the PMT that have a sharply changing LRF. Potentially we can measure the DOI by using this difference in LRF shape as a metric, allowing us to use depth-specific weights to calculate the position and spatial resolution instead of using one set of weights, which are calculated from the LRF over all DOI of the crystal.
Figure 9.
25mm thick crystal: LRF of the row-summed channel near the PMT center (centered at x = 3.1mm) at three depths: z = 5, 12, 20mm. The unslotted crystal was scanned at incremental y positions across the center of the crystal face from edge-to-edge (y= −24mm to y = 24mm). The gammas were incident on the crystal side to control the DOI.
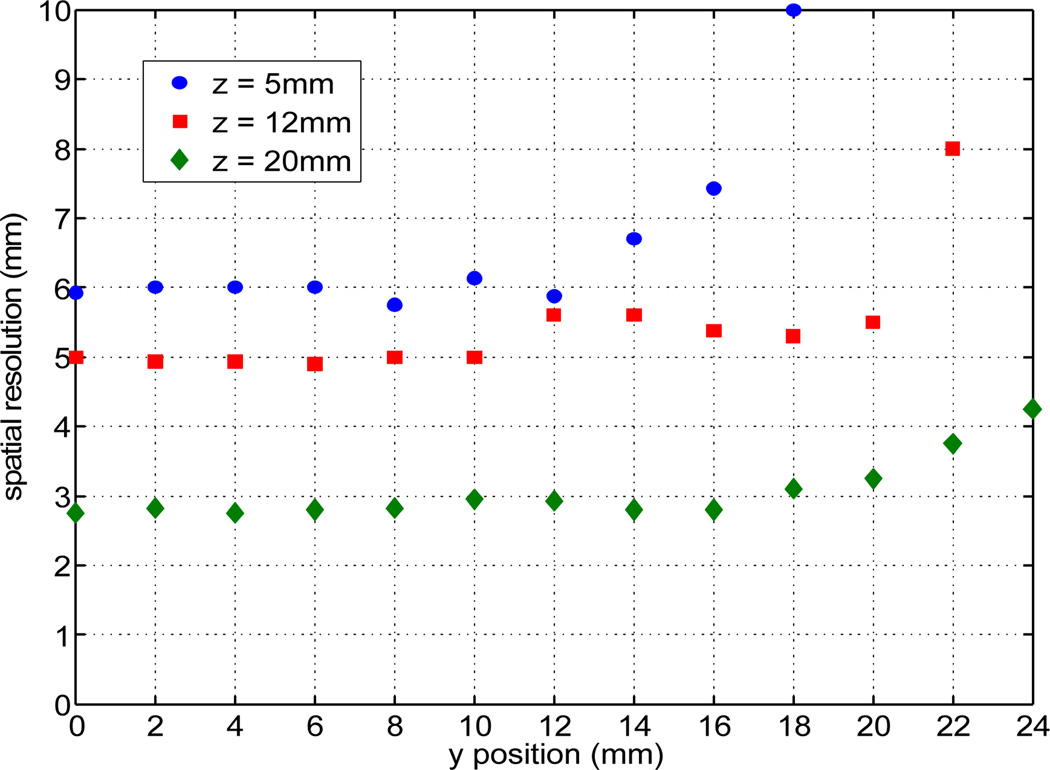
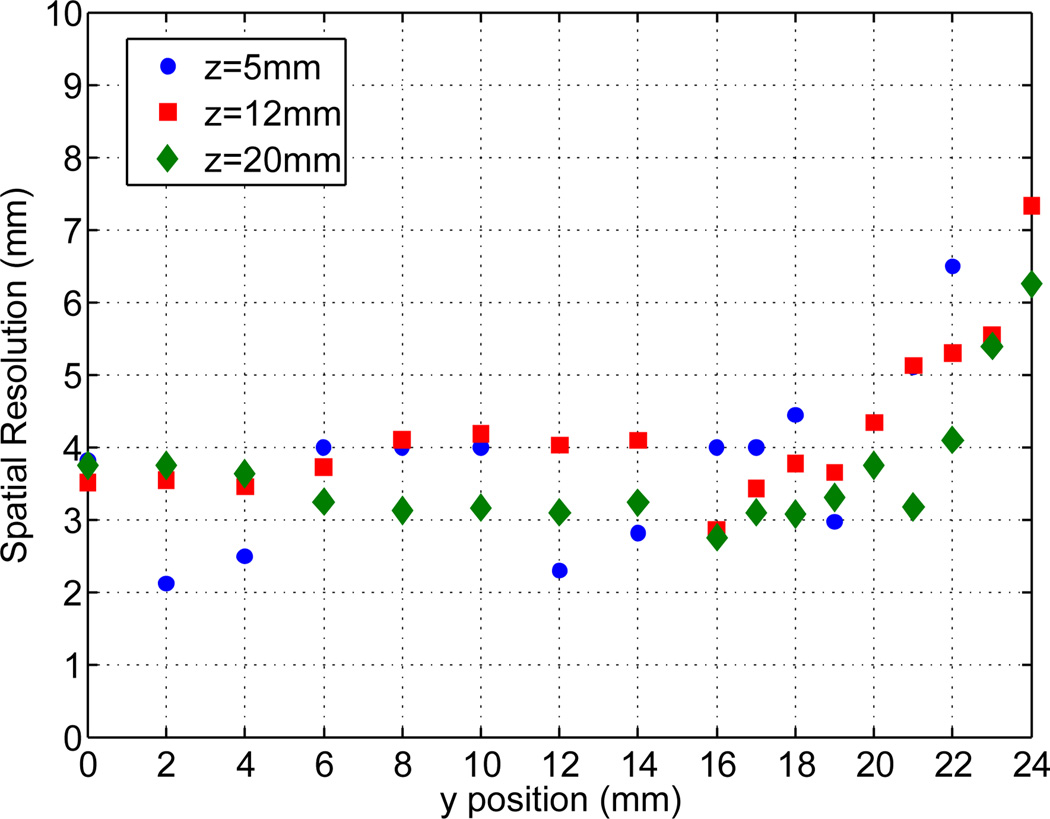
Figure 10 shows that for events interacting at a fixed DOI, and using depth specific ML weights for positioning, there is an improvement in spatial resolution relative to interactions at all DOI (figure 6), but the improvement is only for those interactions that occur at large z where the LRF narrows. Therefore, even if we measure the DOI, that alone will not be sufficient to improve the overall spatial resolution performance of the crystal. In order to improve the resolution the scintillation light in the entrance half of the crystal has to be channeled towards the PMT to sharpen the LRF in addition to removing the DOI dependency of the ML weights.
Figure 10.
Spatial resolution of 48×48×25mm3 LYSO crystal calculated using ML positioning for three fixed depth scans: z = 5, 12, 20mm. The gammas were incident on the crystal side to control the DOI.
D. Impact of LRF Width on Spatial Resolution and Using Slots to Sharpen the LRF in a 48×48×25 mm3 LYSO Crystal
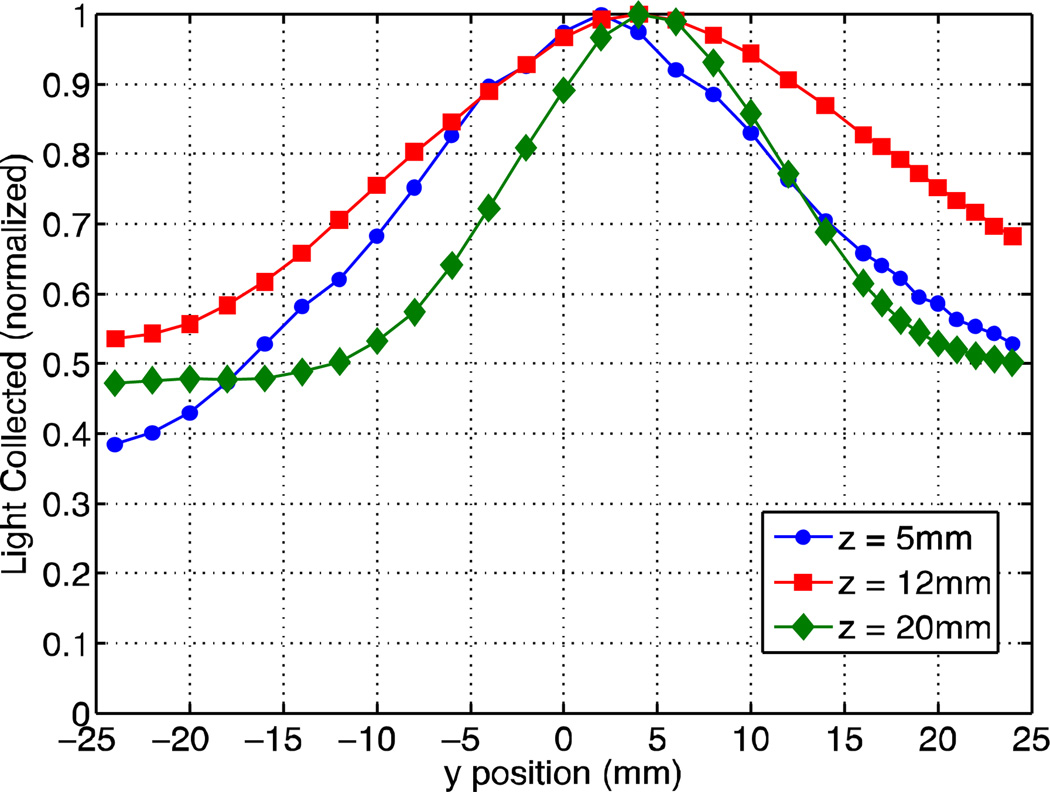
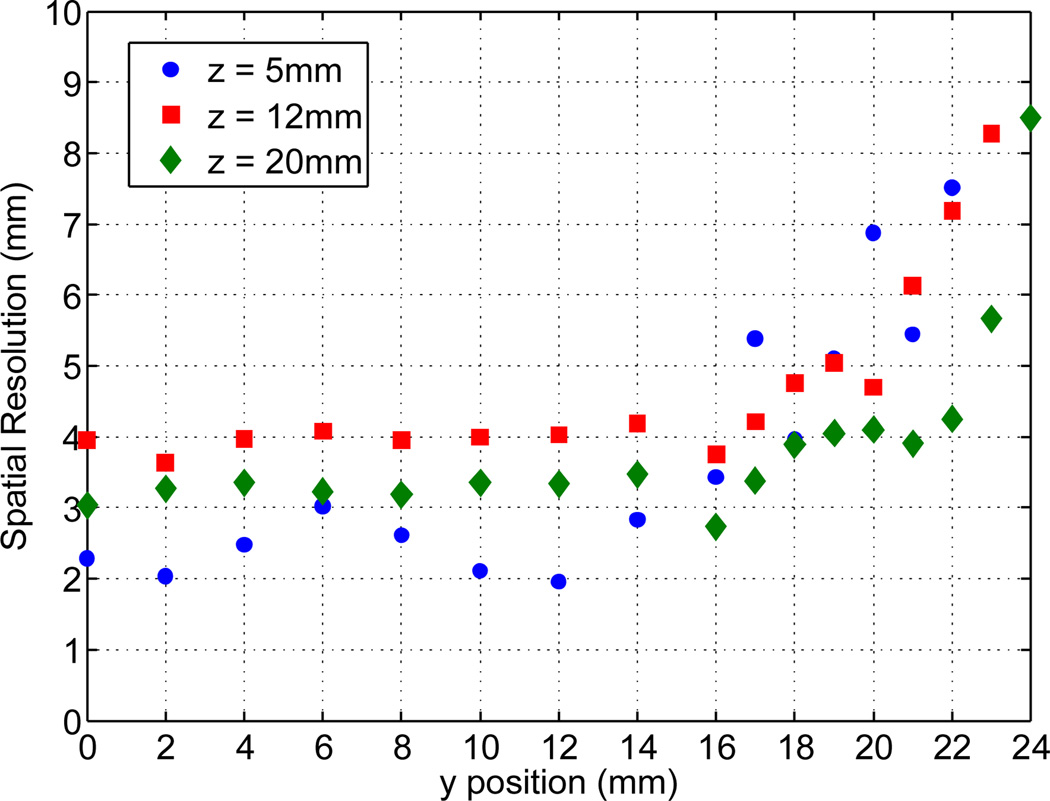
Figure 11 shows the LRF for a single summed column near the center of the PMT (row-summed column 5) measured for three different depths in the 25 mm thick crystal with 8mm deep slots using the fixed depth measurement setup. Comparing figure 11 to figure 9 it is seen that the depth-dependent variation in the LRF has been reduced, although, the LRF is still widest in the central region of the crystal volume (z = 12 mm) because the slots have the greatest effect on the LRF for small z (nearest the slots). Note that the LRF at z = 5 mm has some irregularity in its shape due to imperfections in the slots, particularly those near the edges. This is then manifested in the spatial resolution at that depth (figure 12). This has little effect for the head-on incidence measurements, which represent an average of all DOI within the crystal.
Figure 11.
Slotted 25mm thick crystal: LRF of row-summed channel near the PMT center (centered at x = 3.1mm) at 3 depths: z = 5, 12, 20mm. The gammas were incident on the crystal side to control the DOI.
Figure 12.
Spatial resolution of 48×48×25mm3 LYSO crystal with 8mm deep slots cut with a pitch of 2mm in x–y. For 3 fixed depth scans, z = 5, 12, 20mm, the gammas were incident on the crystal side to control the DOI.
Figure 12 shows the spatial resolution at the three depths and we see that the resolution at z = 12 mm is the poorest. Using a single set of weights with no DOI information, the spatial resolution of a head-on measurement is 4 mm (figure 13) in the crystal center and although it degrades near the edges, it is an improvement over the unslotted crystal resolution (figure 6). The energy resolution is 13.5% on average for 511 keV gammas (min. 12.6%, max. 14%).
Figure 13.
Head-on spatial resolution of 48×48×25mm3 LYSO crystal with 8mm deep slots cut with a pitch of 2mm in x–y, calculated using ML positioning. The crystal was scanned at incremental × positions across the center of the crystal face from the center (x=0mm) to the edge (x=24mm).
E. Mitigation of Edge Effects in a Slotted 48×48×25mm3 LYSO Crystal
To reduce the number of reflections off the Teflon wrapped crystal sides we used low reflectivity paint in an 8 mm band around the crystal sides below the slots (z = 8 −16 mm). The region from z = 16 – 25 mm is Teflon wrapped. As seen from the LRF of the fixed depth measurements made at z = 20 mm in figure 11, the scintillation light coming from events interacting near the PMT does not spread widely. The widest light spread is in the crystal center. Therefore, the 8 mm dark band was put around the center of the crystal sides, and it created three equal sized zones with different surface treatments. Painting the lower sides of the crystal (near the PMT) would result in a loss of scintillation photons, adversely affecting the energy and timing resolution, without having any positive effect on the LRF.
We see from figure 14 that we were successful in sharpening the LRF at all depths in the crystal. Although the average energy resolution is degraded from 13.5% in the case of the Teflon wrapped crystal to 16% with the dark strip (min 14.5%, max. 17%), the sharply changing LRF at the crystal edges provides better positioning information.
Figure 14.
Slotted 25mm thick crystal, dark strip: LRF of row-summed channel near the PMT center (centered at y = 3.1mm) at 3 depths: z = 5, 12, 20mm. The crystal has 8mm deep slots cut and the sides of the crystal have a low reflectivity paint in the region of z = 8–16mm. The gammas were incident on the crystal side to control the DOI.
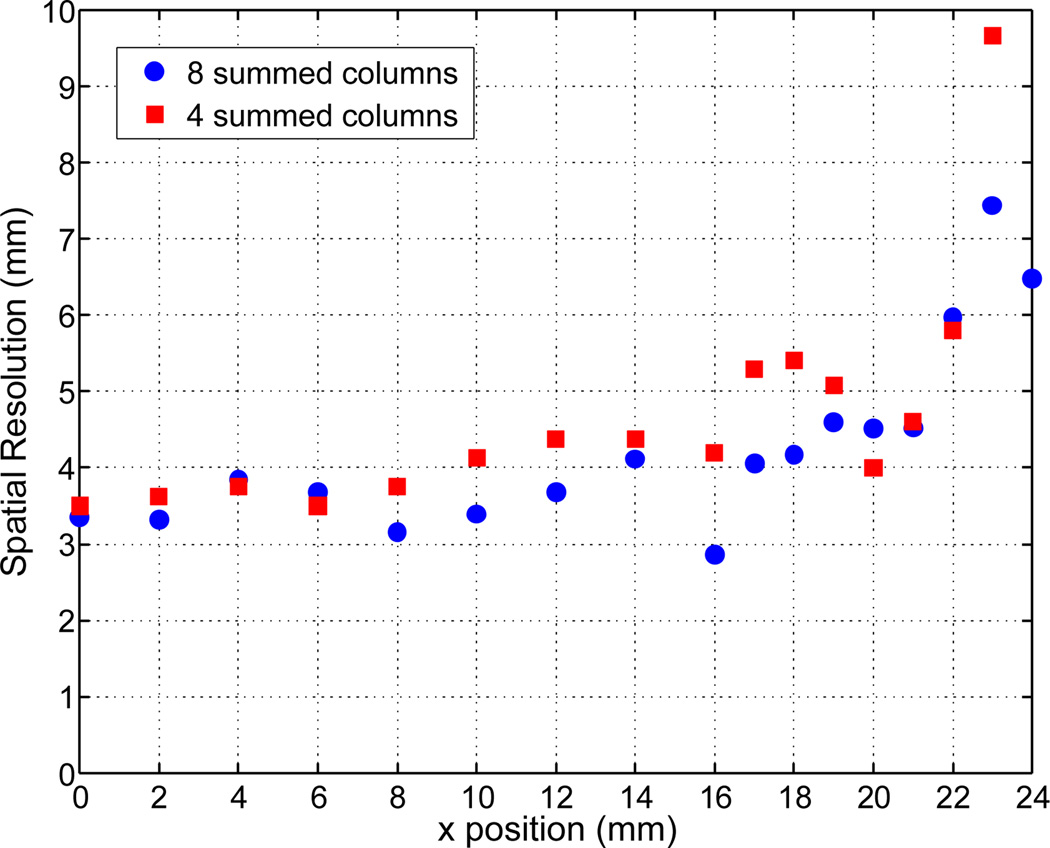
Another consequence of the dark strip is that it reduces the depth-dependent change in LRF and, consequently, at each of the fixed-depth measurements the spatial resolution is similar and shows a marked improvement near the crystal edges, as seen by comparing figure 15 to figure 12. Figure 16 shows the detector spatial resolution measured with this crystal surface finish using the 8 summed columns of anodes. In addition, we also show results with 4 summed columns (effective anode size 12.25 mm) instead of the 8 (effective anode size of 6.125 mm) that we have used in all other measurements. These results indicate that the anode size can be doubled (and hence number of electronic channels reduced) without any significant loss of detector performance.
Figure 15.
Slotted 25mm thick crystal, dark strip: Spatial resolution of 48×48×25mm3 LYSO crystal with 8mm deep slots and a band of low reflectivity paint on the sides in the region of z = 8–16mm. The crystal was scanned at fixed depths from the side to control the DOI of interacting events.
Figure 16.
Head-on spatial resolution of 48×48×25mm3 LYSO crystal with 8mm deep slots cut with a pitch of 2mm in x–y, and a dark band around the sides at z = 8–16 mm, calculated using ML positioning. The crystal was scanned at incremental × positions across the center of the crystal face from the center (x=0mm) to the edge (x=24mm).
IV. Discussion & Conclusions
Our measurements show that we can achieve a spatial resolution of under 4 mm in the central region (x ≤ 12 mm) of the 48 × 48 × 25 mm3 LYSO crystal (see table 1) by sharpening the LRF using slots cut into the entrance surface of the crystal. The resolution can be further improved near the crystal edges by the selective use of low reflectivity paint on the crystal sides (figure 16). By using a combination of slots and a dark strip we achieve a resolution of 3.48 mm near the crystal center of the 25 mm thick crystal. By further summing 8 anode columns into 4, we measure a resolution of 3.8 mm near the crystal center (x = 0 – 12 mm) degrading to 4.3 mm closer to the edges (x = 0 – 20 mm). Table 1 summarizes the systematic improvement in the head-on measurement results for the different crystal configurations, showing the average resolution obtained over a central region of the crystal (x = 0 – 12 mm), and over a larger area of the crystal (x = 0 – 20 mm) where edge effects degrade the performance. The spatial resolution of the 25 mm thick crystal with the dark strip is on average worse than the 14 mm thick crystal by less than half a millimeter in the crystal center, but performs better near the detector edges.
Table 1.
Average spatial resolution (FWHM) in a head-on measurement of the various crystals and their modifications over a small middle section of the crystal (x=0–12mm) where the performance is the best, and over a larger section (x=0–20mm) where edge effects reduce the performance. All results are shown from 8 summed columns of anodes used for positioning.
| 25mm continuous (mm) |
25mm w. Slots (mm) |
25mm w. Slots and dark strip (mm) |
14mm (mm) |
|
|---|---|---|---|---|
| x = 0–12mm | 5.4 | 4.0 | 3.5 | 3.1 |
| x = 0–20mm | 6.1 | 5.1 | 3.7 | 4.6 |
Compared to other samples of LYSO we measure the light output of the 25 mm thick crystal to be ~30% lower than average, leading to a 13.5% energy resolution at 511 keV for the 25 mm thick crystal compared to a typical value of 10.5%. We could also expect to see an improvement in the spatial resolution of the 25 mm thick LYSO crystal if we used a crystal with improved light output. Therefore, our results are very encouraging since they represent a upper limit, or conservative result of what can be achieved with thick continuous detectors, making it an excellent candidate for clinical human scanners (whole-body or organ specific).
The work presented in this paper represents an evaluation of the spatial resolution achieved with thick continuous detectors and the utilization of techniques through which their performance can be improved. The slots cut in the front surface of the crystal had a width of 0.48 mm, which will reduce the detector sensitivity. Since the cuts are only 8 mm deep the reduction in the overall volume of the entire crystal is about 11.5%. We would like to stress that this is our first attempt to cut such a thick crystal and the mechanical cutting setup can be optimized with the use of a thinner blade, and with a slot pitch that does not leave spare material at the edges of the crystal. Also, our group has looked into laser engraving techniques [33], [34] as a practical way to mimic the optical behavior of these slots. Optical walls can be laser-engraved in LYSO with a width of just 0.015 mm, which maintains above 99% of the original crystal volume [34], and in the future we will evaluate the use of this technique to mimic optical properties of a mechanically cut slot as used in this work.
The addition of the dark strip to our slotted detector reduces the need for a DOI measurement, as the change in the LRF with depth is minimized. While this improves the overall detector performance without the need for DOI, it negates one advantage of continuous detectors, which is the ability to measure the DOI based on changes in the LRF as a function of interaction depth.
Finally, as shown in figure 16, by summing 8 anode columns into 4, we do not measure any significant degradation in the detector spatial resolution. Future work will involve evaluation of the change in detector performance as a function of anode size with the goal being to achieve best detector performance with a minimum number of large photo-detectors.
Acknowledgment
This work was supported by R21-EB008142, DOE grant DE-FG02-08ER64680. The authors also thank St. Gobain Crystals, Dr. Dokhale (RMD Inc.) for the loan of their crystal, and Giorgio Technology Services for cutting slots.
References
- 1.Anger H. “Sensitivity, Resolution, and Linearity of the Scintillation Camera,”. IEEE Trans. Nucl. Sci. 1966;vol. 13:380–392. [Google Scholar]
- 2.Madsen MT. “Recent Advances in SPECT Imaging,”. J. Nucl. Med. 2007;vol. 48:661–673. doi: 10.2967/jnumed.106.032680. [DOI] [PubMed] [Google Scholar]
- 3.Atkins F, Muehllehner G, Harper PV. “Positron emission computed tomography using large area detectors,”. Information Processing in Medical Imaging (ORNL/BCTIC-2) 1978:196–213. [Google Scholar]
- 4.Karp JS, Muehllehner G. “Performance of a position-sensitive scintillation detector”. Phys. Med. Biol. 1985;vol. 30(7):643–655. doi: 10.1088/0031-9155/30/7/003. [DOI] [PubMed] [Google Scholar]
- 5.Karp JS, Muehllehner G, Mankoff DA, Ordonez CE, Ollinger JM, Daube-Witherspoon ME, Haigh AT, Beerbohm DJ. “Continuous-Slice PENN-PET: A Positron Tomograph with Volume Imaging Capability,”. J. Nucl. Med. 1990;vol. 31:617–627. [PubMed] [Google Scholar]
- 6.Freifelder R, Karp JS, Geagan M, Muehllehner G. “Design and performance of the HEAD PENN- PET scanner,”. IEEE Trans. Nucl. Sci. 1994;vol 41:1436–1440. [Google Scholar]
- 7.Adam LE, Karp JS, Daube-Witherspoon ME, Smith RJ. “Performance of a Whole-Body PET Scanner Using Curve-Plate NaI(Tl) Detectors,”. J. Nucl. Med. 2001;vol 48:1821–1830. [PubMed] [Google Scholar]
- 8.Karp JS, Muehllehner G, Beerbohm D, Mankoff D. “Event localization in a continuous scintillation detector using digital processing,”. IEEE Trans Nucl Sci. 1986;vol. 33:550–555. [Google Scholar]
- 9.Mankoff D, Muehllehner G, Karp JS. “The effect of detector performance on high count rate PET imaging with a tomograph based on position-sensitive detectors,”. IEEE Trans. Nucl. Sci. 1988;vol. 35:592–597. [Google Scholar]
- 10.Surti S, Karp JS, Muehllehner G. “Evaluation of pixelated NaI(Tl) detectors for PET,”. IEEE Trans. Nucl. Sci. 2003;vol. 50:24–31. [Google Scholar]
- 11.Surti S, Karp JS, Freifelder R, Liu F. “Optimizing the performance of a PET detector using discrete GSO crystals on a continuous lightguide,”. IEEE Trans. Nucl. Sci. 2000;vol. 47:1030–1036. [Google Scholar]
- 12.Surti S, Karp JS, Perkins AE, Cardi CA, Daube-Witherspoon ME, Kuhn A, Muehllehner G. “Imaging performance of a-PET: a small animal PET camera,”. IEEE Trans. Med. Img. 2005;vol. 24:844–852. doi: 10.1109/tmi.2005.844078. [DOI] [PubMed] [Google Scholar]
- 13.Surti S, Kuhn A, Werner ME, Perkins AE, Kolthammer J, Karp JS. “Performance of Philips Gemini TF PET/CT scanner with special consideration for its time-of-flight imaging capabilities,”. J. Nucl. Med. 2007;vol. 48:471–480. [PubMed] [Google Scholar]
- 14.Casey M, Nutt R. “A multicrystal two dimensional BGO detector system for positron emission tomography,”. IEEE Trans. Nucl. Sci. 1986;vol. 33:460–463. [Google Scholar]
- 15.Wong WH, Uribe J, Hicks K, et al. “An analog decoding BGO block detector using circular photomultipliers,”. IEEE Trans. Nucl. Sci. 1995;vol. 42:1095–1101. [Google Scholar]
- 16.Wienhard K, Schmand M, Casey ME, et al. “The ECAT HRRT: performance and first clinical application of the new high resolution research tomograph,”. IEEE Trans. Nucl. Sci. 2002;vol. 49:104–110. [Google Scholar]
- 17.Tai Y, Chatziioannou A, Yang Y, Silverman R, Meadors K, Siegel S, Newport D, Stickel J, Cherry S. “MicroPET II: Design, development and initial performance of an improved microPET scanner for small-animal imaging,”. Phys. Med. Biol. 2003;vol. 48:1519–1537. doi: 10.1088/0031-9155/48/11/303. [DOI] [PubMed] [Google Scholar]
- 18.Rogers JG, Saylor DP, Harrop R, Yao XG, Leitao CVM, Pate BD. “Design of an efficient position sensitive gamma ray detector for nuclear medicine,”. Phys. Med. Biol. 1986;vol. 31:1061–1090. doi: 10.1088/0031-9155/31/10/001. [DOI] [PubMed] [Google Scholar]
- 19.Gray RM, Macoviski A. “Maximum A Posteriori Estimation of Position in Scintillation Cameras,”. IEEE Trans. Nucl. Sci. 1976;vol. 30:652–660. [Google Scholar]
- 20.Clinthorne NH, Rogers WL, Lingxiong S, Koral KF. “A hybrid maximum likelihood position computer for scintillation cameras”. IEEE Trans. Nucl. Sci. 1987;vol. NS-34(1):97–101. [Google Scholar]
- 21.Bruyndonckx P, Leonard S, Tavernier S, Lemaitre C, Devroede O, Wu Y, Krieguer M. “Neural network based position estimators for PET detectors using monolithic LSO blocks,”. IEEE Trans. Nucl. Sci. 2004;vol. 51:2520–2525. [Google Scholar]
- 22.Maas MC, Laan DJvan der, Schaart DR, Huizenga J, Brouwer JC, Bruyndonckx P, Leonard S, Lemaitre C, Eijk CWEvan. “Experimental characterization of monolithic-crystal small animal PET detectors read out by APD arrays,”. IEEE Trans. Nucl. Sci. 2006;vol. 53:1071–1077. [Google Scholar]
- 23.Tavernier S, Bruyndonckx P, Leonard S, Devroede O. “A high-resolution PET detector based on continuous scintillators,”. Nucl. Instr. Meth. (A) 2005 Jan 21;vol. 537:321–325. [Google Scholar]
- 24.Benlloch JM, Carrilero V, González AJ, Catret J, Lerche Ch.W, et al. “Scanner calibration of a small animal PET camera based on continuous LSO crystals and flat panel PSPMTs,”. Nucl. Instr. Met (A) 2007;vol. 571:26–29. [Google Scholar]
- 25.Joung J, Miyaoka RS, Lewellen TK. “cMiCE: a high resolution animal PET using continuous LSO with a statistics based positioning scheme,”. Nucl. Instrum. Methods A. 2002;vol. 489:584–598. [Google Scholar]
- 26.Schaart DR, van Dam HT, Seifert S, Vinke R, Dendooven P, Lohner H, Beekman FJ. “A novel, SiPM-array-based monolithic scintillator detector for PET,”. Phys. Med. Biol. 2009;vol. 54:3501–3512. doi: 10.1088/0031-9155/54/11/015. [DOI] [PubMed] [Google Scholar]
- 27.Ling T, Lewellen TK, Miyaoka RS. “Depth of interaction decoding of a continuous crystal detector module,”. Phys. Med. Biol. 2007;vol. 52:2213–2228. doi: 10.1088/0031-9155/52/8/012. [DOI] [PubMed] [Google Scholar]
- 28.LeBlanc JW, Thompson RA. “A novel PET detector block with three dimensional hit position encoding,”. IEEE Trans. Nucl. Sci. 2004;vol. 51:746–751. [Google Scholar]
- 29.Lerche CW, et al. “Depth of gamma-ray interaction within continuous crystals from the width of its scintillation light-distribution,”. IEEE Trans. Nucl. Sci. 2005;vol. 52:560–572. [Google Scholar]
- 30.Li Z, Wedrowski M, Bruyndonckx P, Vandersteen G. “Nonlinear least-squares modeling of 3D interaction position in a monolithic scintillator block,”. Phys. Med. Biol. 2010;vol. 55:6515–6532. doi: 10.1088/0031-9155/55/21/012. [DOI] [PubMed] [Google Scholar]
- 31.Moore SK, Hunter WCJ, Furenlid LR, Barrett HH. “Maximum-likelihood estimation of 3D event position in monolithic scintillation crystals: experimental results,”. IEEE Nucl. Sci. Symp. Conf. Record. 2007 doi: 10.1109/NSSMIC.2007.4436923. [DOI] [PMC free article] [PubMed] [Google Scholar]
- 32.Surti S, Karp JS, Freifelder R. “Slotted surface treatment of position-sensitive NaI(Tl) detectors to improve detector performance”. IEEE Trans. Nucl. Sci. 2001;vol. 48:2418–2423. [Google Scholar]
- 33.Moriya T, Fukumitsu K, Sakai T, Ohsuka S, Okamoto T, Takahashi H, Watanabe M, Yamashita T. “Development of PET detectors using monolithic scintillation crystals processed with sub-surface laser engraving technique,”. IEEE Trans. Nucl. Sci. 2010;vol. 57:2455–2459. [Google Scholar]
- 34.Sabet H, Kudrolli H, Singh B, Nagarkar VV. presented at the IEEE Nuclear Science Symposium and Medical Imaging Conference. Anaheim, CA; 2012. “High-resolution, high-sensitivity PET detectors using laser engraved LYSO and SiPMs,”. [Google Scholar]


