Abstract
Background
We hypothesize that there is a higher incidence of vasectomy within the military at a younger age based on this equal access health care system.
Materials and Methods
A review of the CHAMPS military database was conducted for men receiving vasectomies from 2000 to 2009. Age at vasectomy, number of children, race, religion, and marital status were recorded and incidence was computed.
Results
Total of 82,945 vasectomies was performed. The overall incidence to have a vasectomy was approximately 7.10 per 1000 men. The highest rate of occurrence was 14.4 per 1000 men in men 30–34 years old. Whites had a higher rate than blacks at 10.03 per 1000 men compared to 6.27 per 1000 men. Protestants had the highest rate at 8.44 per 1000 men, and Jewish people had the lowest at 1.86 per 1000 men. Married men had a rate of 12.3 per 1000 men, whereas single men were 1.03 per 1000 men.
Conclusions
The incidence to have a vasectomy in the military was 7.10 per 1000 men, with an age adjusted rate at 8.66 per 1000 men. This information may assist primary care providers in discussing vasectomies as a permanent form of contraception.
Key Words: Vasectomy, US Military, Sterilization
Introduction
Vasectomy remains one of the least utilized forms of sterilization despite it being simple, safe, and cost effective. Within urology, it is a common surgical procedure; however, there is no nationwide surveillance system to collect data on the number of vasectomies performed [1]. A paucity of information exists regarding the patient demographics not only in the United States, but the world as a whole [1]. The reported use of vasectomy in the world varies significantly by region and country. Some developed countries such as New Zealand have prevalence at 19.3% while some underdeveloped countries such as Rwanda have prevalence at 0.1% [2]. Worldwide, an estimated 33 million of married women aged 15 to 49 (less than 3%) rely on their partner's vasectomy for contraception [2]. When analyzing vasectomies in developed countries overall, fewer than 5% of couples rely on vasectomy. In Canada the rate of occurrence is approximately 7 per 1,000 men per year whereas in the United States it is approximately 10 per 1,000 men per year [1, 2].
In the military, service members and their dependents have free access to a universal health care system which includes elective vasectomies. No study has analyzed this unique sub-group as the vasectomies are without cost to the patients. We analyzed the reported incidence of vasectomy in men by age, race, religion, and marital status in an equal access health care database.
Materials and Methods
Our local institutional review board approved a retrospective search of the Career History Archival Medical and Personnel System (CHAMPS) database for all active duty male service members during 2000–2009 with an ICD-9 code for vasectomy (v26.52). Patient age at vasectomy, number of children, race, religion, and marital status were compiled. CHAMPS, is a comprehensive database created and updated from a wide variety of military data sources that provides an archival medical history for active-duty military personnel organized in a chronological narrative format. Key career and military events are coded and recorded by event date and updated in monthly files. In this way, a military service member can be tracked from accession to service separation. Detailed personnel data are currently obtained from the Defense Manpower Data Center (DMDC) in Monterey, CA, USA.
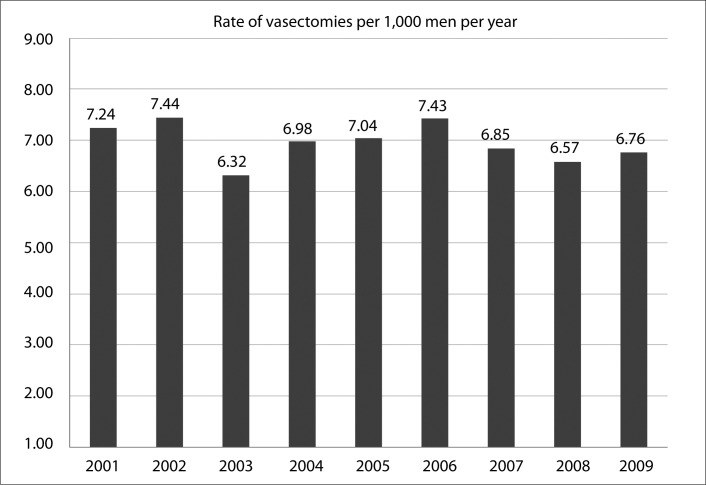
Total annual military male populations for 2001 to 2009 were collected from the Defense Medical Epidemiology Database (DMED). The DMED does not contain information on 2000. The annual rates are charted in figure 1, excluding 2000.
Fig. 1.
Rate of vasectomy per year per 1,000 men. Note that military male population data for 2000 was unavailable.
The aggregate data for a 10-year period was divided by 10 to give an approximate annual number for comparison with the 2002 Department of Defense (DoD) manpower census report. Statistical analysis was done with VassarStats® and Microsoft Excel®. Differences were analyzed using the Pearson chi-square with p < 0.05 considered significant.
Given that the military population is younger than the civilian population, the results were age adjusted to the older civilian population in 5-year age bracket intervals.
Result
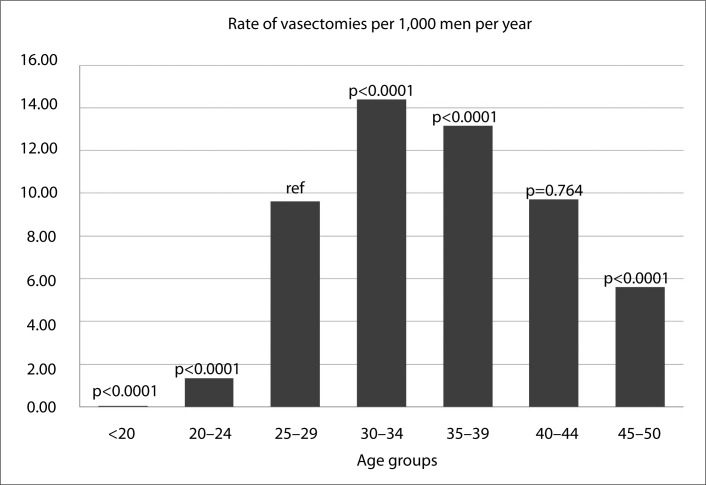
Within the review period, there were a total of 2,841,919 records searched within CHAMPS with a total of 82,945 vasectomies performed within all services over a 10-year span (table 1 for results of specific demographics). The annual rate from 2001 to 2009 ranged from 6.32 to 7.44. The highest incidence was in 2002 with an incidence of 7.44 per 1,000 men (fig. 1). The division of patients into age groups revealed 27 (0.032%) patients < 20 years old; 5200 (6.26%) patients (range 20–24 years old); 21,932 (26.44%) patients (range 25–29 years old); 24,676 (29.74%) patients (range 30–34 years old); 21,137(25.48%) patients (range 35–39 years old); 8,307 (11.22%) patients (range 40–44 years old); 1,555 (1.87%) patients (range 45–50 years old); with the average age being 32.6 years old. Of the vasectomies performed, a higher percentage within the military (61%) was performed than reported in the general population (46%) in men < 35 years old [3]. The highest vasectomy rate was among the 30–34 age group with an incidence of 14.4 per 1,000 men (Pearson chi-square p < 0.0001, fig. 2).
Table 1.
Results of specific demographics
| Demographic area | Total military in 2002 | Total vasectomies (over 10 years) | Rate of occurrence (per 1000 per year) | Odds ratio | 95% CI | p |
|---|---|---|---|---|---|---|
| Age, n = 1,167,320 | ||||||
| <20 | 104,253 | 27 | 0.0259 | 0.00244 | 0.0007–0.008 | <0.0001 |
| 20–24 | 389,212 | 5,200 | 1.34 | 0.127 | 0.116–0.140 | <0.0001 |
| 25–29 | 228,237 | 21,932 | 9.61 | 1 (ref) | – | |
| 30–34 | 171,569 | 24,676 | 14.4 | 1.58 | 1.49–1.67 | <0.0001 |
| 35–39 | 160,821 | 21,137 | 13.1 | 1.42 | 1.34–1.51 | <0.0001 |
| 40–44 | 85,443 | 8,307 | 9.72 | 1.01 | 0.999–1.001 | 0.764 |
| 45–50 | 27,785 | 1,555 | 5.6 | 0.56 | 0.475–0.659 | <0.0001 |
| Race | ||||||
| White | 664,404 | 66,650 | 10.03 | 1 (ref) | – | |
| Black | 200,472 | 12,570 | 6.27 | 0.6 | 0.565–0.637 | <0.0001 |
| Hispanic | 101,030 | not recorded | ||||
| Others | 63,913 | 3,725 | ||||
| Religion, n = 5,952 | ||||||
| Catholic | 1,197 | 17,798 | 7.42 | 1.52 | ||
| Protestant | 2,503 | 42,290 | 8.44 | 1.75 | ||
| Other Christian | 219 | 1,609 | 3.67 | 0.722 | ||
| Muslim | 27 | 147 | 2.72 | 0.53 | ||
| Jewish | 65 | 242 | 1.86 | 0.359 | ||
| No preference | 1,518 | 15,227 | 5.01 | 1 (ref) | ||
| Unknown/other | 423 | 4,935 | 5.83 | 1.17 | ||
| Marital status | ||||||
| Married | 627,301 | 77,120 | 12.3 | 13.4 | 12.3–14.6 | <0.0001 |
| Single | 564,642 | 5,825 | 1.03 | 1 (ref) | ||
Overall rate of occurrence: 7.10; Age adjusted rate of occurrence: 8.66.
Fig. 2.
Incidence according to age groups within the military. The overall rate among the military is 7.10 per 1,000 men. When age adjusted to the civilian population the overall rate increases to 8.66.
Regarding race, there was some discrepancy in the databases searched as the CHAMPS data does not differentiate among Hispanics while the 2002 DoD Manpower Report does not differentiate among Asians. Therefore, the only statistical comparisons made were whites with blacks with whites having a higher rate at 10.03 per 1000 versus blacks at 6.27 per 1,000 with an odds ratio of 0.600 (95% CI 0.565–0.637, p < 0.0001).
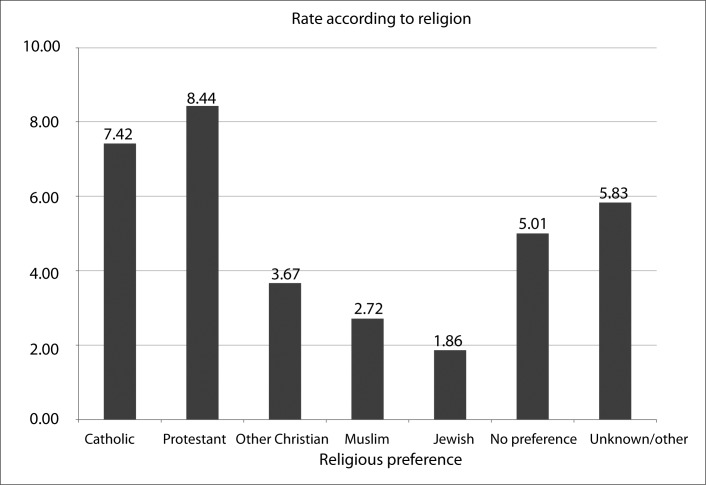
Regarding religious association, 7 broad categories were created to simplify the data despite over 100 various religious groups being reported. The categories were Catholic, Protestant, other Christian, Muslim, Jewish, no preference, and unknown/other. The authors hand picked which religious category to place each specific religion. The highest rate was among those describing themselves as Protestants at 8.44 per 1,000 men and the lowest rate was among those describing themselves as Jewish at 1.86 per 1,000 men (fig. 3).
Fig. 3.
Incidence according to religion within the military. The highest incidence was among those that reported themselves as Protestant at 8.44 per 1,000 men (Other Christian includes Eastern Orthodox churches)
Next the participants were sorted according to marital status. Ninety-three percent of men receiving a vasectomy within the military were married. This is in comparison to contemporary literature reporting a marriage rate of 91% within the general population [3].
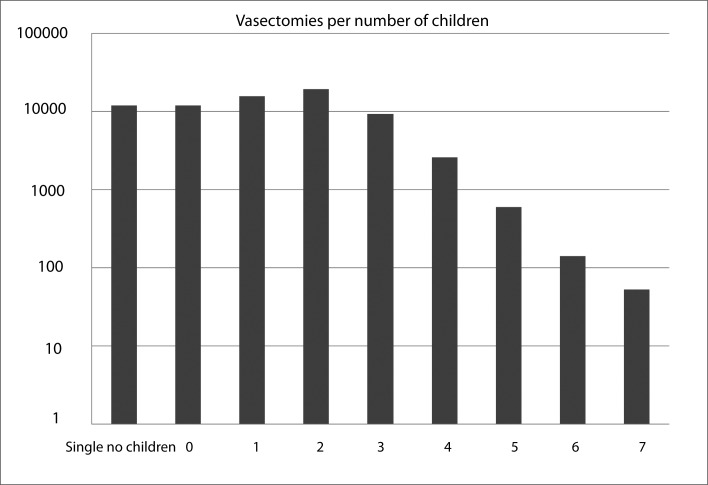
The average number of children of those obtaining a vasectomy was 1.35 ± 1.24 with a mode of 2 (table 1). This is lower than the general population of 2.5 (fig. 4) [3].
Fig. 4.
The average number of children was 1.35 ± 1.24. The most common number of children was 2.
Discussion
Early data shows that the rates of vasectomies increased steadily during the 1960s and 1970s [2]. Eventually the rate of vasectomy in the United States leveled off during the 1980s. In 1991 and 1995, it was reported that approximately 500,000 vasectomies were performed in the United States [2]. Over the years from a snapshot at time points 1991, 1995, and 2002, the incidence has remained relatively unchanged at approximately 10 per 1,000 men aged 25 to 49 years old [2]. In 2002, vasectomy was reported as the fourth most commonly used method (after oral contraception, tubal sterilization, and condoms) among people in the United States [4]. Overall 7 to 10% of married couples select vasectomy for contraception making it the most common urological procedure in North America [5, 6]. Urologists are the main providers of vasectomy in the United States, performing 79% of vasectomies, with 13% performed by family physicians and 8% performed by general surgeons [2]. Despite the number of patients who have a vasectomy procedure performed, there exists little information regarding the demographics of patients receiving the procedure.
Our study analyzed a significant sample size of the demographics of men receiving a vasectomy. The US Military is a unique medical environment in regards to its free access to health care for active military service members and is comparable to the annual data obtained from other countries such as Canada that offer equal access to health care to its population. Canada offers free access to health care and a global model through their national health insurance program. According to the most recent report, during 2005 to 2006, approximately 60,908 vasectomies were done in Canada, translating to a rate of 11 per 1,000 men aged 25 to 49 years old [2]. Because the Canadian model has global access to health care, it is a useful platform to draw parallels to the military health care model. Both systems provide global health care under a universal system in which a vasectomy is performed free of charge upon referral from a general practitioner. Although the rate in Canada is higher than the United States military (11 vs. 7.10 per 1,000 men), there is a very important difference regarding contraception among couples. Over twice as many men have a vasectomy compared to women who have a tubal ligation in Canada. The opposite is true in the United States [2, 7]. Even after age adjustment of the military population to match the civilian population (8.66), this rate continues to be lower than the Canadian rate. Interestingly, tubal ligations are also offered free of charge in the US Military as well.
Most recently, Eisenberg et al. [8] reported on the racial differences in vasectomy utilization in the United States. They reported that after accounting for a variety of variables that Black and Hispanic men were less likely to rely on vasectomy for contraception. Our study echoes the findings by Eisenberg of blacks (rate of 6.27 per 1,000 men) compared to whites (rate of 10.03 per 1,000 men) with an odds ratio of 0.600 (95% CI 0.565–0.637 p < 0.0001). In theory, the free medical care in the military neutralizes the argument that blacks have reduced access to vasectomies due to economic feasibility. The explanation for the racial disparity in vasectomy is uncertain, and Eisenberg postulated that that there may be different racial perceptions of fertility whereby masculinity is closely related to a man's ability to father children [8]. This may an element to consider during counseling regarding no loss of libido and erectile function after vasectomy.
In looking at marital status, over half of today's military personnel are married (about 51%), and 73% of married personnel have children [9, 10]. Of the men on active duty, approximately 71% officers and 50% enlisted personnel are married, translating to an overall rate of 53% males married in the military [9, 10]. This is compared to that reported in the general population at 61.6% [3]. In our study, 93% men were married and equaled those percentages reported among the general population at 91% [3].
Despite the importance of establishing and extracting relevant demographical data, there were limitations to this study. The data obtained was aggregate in nature, thus multivariate analysis was impossible to perform. Also, the vasectomies performed reflect a 10-year period, but we were only able to compare it with the 2002 DoD Manpower Report. This requires us to assume the military population remained relatively stable over that time period. Also, the databases did not delineate according to the same race categories making race difficult category to compare. The CHAMPS database did not differentiate among Hispanics and the DoD Manpower report did not differentiate among Asians.
Additionally, sorting and analyzing according to religious preference by hand in a non-systematic but manually, may result in different results if different subgroups were made.
Lastly, this study only looks at the United States Military. In using one entity of the general population, natural biases exist in relation to researching only one career group. Despite these limitations and assumptions, this analysis gives some insight into the demographics of patients who have a vasectomy performed within the United States with access to free health care. Contemporary literature reports prevalence rates between 5 and 10% for the United States population with an overall incidence at 10 per 1,000 men per year [1]. Our review shows that it appears in the United States that free health care in the military does not seem to lead to more vasectomies than in the general population. This suggests that cost is not a factor since free health care does not lead to more vasectomies as demonstrated by our incidence of 7.10 (age adjusted 8.66) per 1,000 men. Speculatively, the military medical services could do a better job of advertising the use of vasectomy by displaying appropriate handouts at the primary care clinics, including vasectomy use in pre and post deployment health surveys, and educating primary care providers to its availability.
Conclusion
Our study demonstrated that over a 10-year span, the incidence of patients receiving a vasectomy within a universal health care model such as the United States military is less than reported within the United States (7.10 vs. 10 per 1,000 men) [1]. Whites were more likely than blacks to undergo a vasectomy. Married men also were more likely to have a vasectomy. This understanding of the demographics and knowledge of the incidence can assist providers in targeting discussions with men in regards to contraception during regular preventive health visits.
Acknowledgment
We would like to thank Dr. Van Orden and members of this team, Thierry Nedellec and Robin Highfill-McRoy, at Career History Archival Medical and Personnel System, located at the Naval Health Research Center for data preparation. The views expressed in this article are those of the authors and do not reflect the official policy or position of the Department of the Navy, Department of Defense, or the United States Government.
References
- 1.Barone MA, Hutchinson PL, Johnson CH, Hsia J, Wheeler J. Vasectomy in the United States, 2002. J Urol. 2006;176:232–236. doi: 10.1016/S0022-5347(06)00507-6. [DOI] [PubMed] [Google Scholar]
- 2.Pile JM, Barone MA. Demographics of va-sectomy – USA and international. Urol Clin North Am. 2009;36:295–305. doi: 10.1016/j.ucl.2009.05.006. [DOI] [PubMed] [Google Scholar]
- 3.Barone MA, Johnson CH, Luick MA, Teutonico DL, Magnani RJ. Characteristics of men receiving vasectomies in the United States, 1998–1999. Perspect Sex Reprod Health. 2004;36:27–33. doi: 10.1363/psrh.36.27.04. [DOI] [PubMed] [Google Scholar]
- 4.Gugliotta A. “Dr. Sharp with his little knife”: therapeutic and punitive origins of eugenic vasectomy-Indiana, 1892–1921. J Hist Med Allied Sci. 1998;53:371–406. doi: 10.1093/jhmas/53.4.371. [DOI] [PubMed] [Google Scholar]
- 5.Kim HH, Schlegel PN: Vasectomy. AUA Update Series. 2008, Vol 27, Lesson 22.
- 6.Monoski MA, Li PS, Baum N, Goldsten M. No-scalpel, no-needle vasectomy. Urology. 2006;68:9–14. doi: 10.1016/j.urology.2006.03.008. [DOI] [PubMed] [Google Scholar]
- 7.Canadian Institute for Health Information (CIHI) Physicians in Canada: fee-for-service utilization, 2005–2006. Ottawa, CIHI, 2008.
- 8.Eisenberg ML, Henderson JT, Amory JK, Smith JF, Walsh TJ. Racial differences in va-sectomy utilization in the United States: data from the national survey of family growth. Urology. 2009;74:1020–1024. doi: 10.1016/j.urology.2009.06.042. [DOI] [PMC free article] [PubMed] [Google Scholar]
- 9.Segal DR, Segal MW. American military population. Population Bulletin. 2004;59:1–41. [Google Scholar]
- 10.Department of Defense : Population representation in the military services. Fiscal year 2002.


