Abstract
While the performance of most current commercially available PET scanners is sufficient for many standard clinical applications, some specific tasks likely require specialized imaging systems. The goal of this project is to explore the capabilities and limitations of a small, high-resolution prototype system for obtaining PET images. The scanner consists of a tandem of detectors. One is a small detector consisting of a 20 × 20 array of 0.7 × 0.7 × 3 mm3 (pitch 0.8 mm) LYSO elements. The scintillator array is coupled to an array of silicon photomultipliers. The second detector is a 96 × 72 array of 2 × 2 × 15 mm3 (pitch = 2.1 mm) LYSO elements coupled to PSPMTs. Separation between the two devices is 180 mm. The detectors are operated in coincidence with each other. Image reconstruction is performed using a limited angle, Maximum Likelihood Expectation Maximization (MLEM) algorithm. Evaluation of the device included measurements of spatial resolution and detection sensitivity as a function of distance. The transaxial radial and tangential spatial resolution of the system ranged from 0.6 mm to 0.9 mm FWHM; axial resolution ranged from 2.7 mm to 4.6 mm FWHM. Detection sensitivity ranged from 0.05 to 0.28%. Spatial resolution and field-of-view vary as a function of distance from the small detector. The tandem detector insert permitted differentiation of the smallest (1 mm diameter) rods in a mini-hot rod phantom. The results indicate that a tandem PET imaging scheme can be potentially employed in applications where high-resolution images over a small region are required.
Index Terms: High resolution, nuclear medicine imaging, PET instrumentation
I. Introduction
Driven by clinical and research needs, PET scanners are pressed to identify ever smaller areas of radiotracer accumulation (perhaps as small as one millimeter or less in diameter). To meet these demands, very-high resolution PET scanners are under development. For example, PET scanners with reported spatial resolution approaching 1 mm FWHM have been developed for small animal use [1]–[3] and 4 mm for human use [4]. These advances have been achieved, for the most part, by the reduction of detector element size. For animal imaging applications, the continued reduction in detector element size to achieve higher resolution is not particularly onerous or expensive given the size of the systems. For human scanners, however, continued reduction in detector element size will have significant impact on cost and complexity, since these systems are considerably larger than small animal scanners.
To address the important issue of increased spatial resolution for the next generation of special-purpose PET scanners, a new technique utilizing separate detectors has been proposed [5]–[8]. In this method, a small, high-resolution detector is combined with a larger, lower-resolution detector. By forming coincidences between the high-resolution detector and the lower-resolution system, high-resolution images (approaching the resolution of the high-resolution detector) can be created over a small region. The transverse spatial resolution of a tandem PET is a function of position and is given by (1) [6] shown at the bottom of the next page, where Rimg is the system resolution, Rsrc is the effective source dimension that includes positron range effects, d1 is the distance from the high-resolution detector to the object, d2 is the distance from the lower-resolution detector to the object, w1 is the width of the high-resolution detector elements, w2 is the width of the lower-resolution detector elements and BE is the block effect factor. This equation shows that transaxial resolution for a tandem PET scanner depends upon the distance from the source from the small detector. The closer the object is to the high-resolution detector (small d1), the closer the resolution of the system gets to the size of a detector element (w1). Thus, a tandem detector system is best applied to situations where the small, high-resolution detector can be placed very close to the object to be imaged. For example, the high resolution detector could be used in conjunction with a clinical PET scanner to enhance it’s resolution for localized imaging applications or as a standalone system comprised of both the high and lower-resolution detector. In either case the aim is to produce a high-resolution system for localized imaging. The goal of this investigation was to construct a compact tandem PET imager and assess the potential imaging capabilities and limitations of this method.
II. Methods
A. High-Resolution Detector
The compact, 16 × 16 mm2, high-resolution component of our system consists of a 20 × 20 array of 0.7 × 0.7 × 3 mm3 LYSO detector elements (pitch 0.8 mm) (Proteus, Inc., Chagrin Falls, OH). Each detector element is optically isolated from its neighbors with enhanced specular reflective (ESR) film. The scintillator array was coupled to a 4 × 4 array of 3 × 3 mm2 MPPC silicon photomultipliers (Hamamatsu Photonics, Inc., Hamamatsu City, Japan) through a 2.9 mm thick piece of ultraviolet-transmissive acrylic. This light guide thickness was found to be best for spreading light amongst multiple SiPM elements, facilitating calculation of the photon interaction point in the scintillator array. The goal was to make the detector as compact as possible for potential incorporation in an endorectal probe. The array of MPPCs was controlled via a custom sixteen-channel electronics module (AiT Instruments, Newport News, VA). These electronics provide power to the MPPCs, route each of the sixteen channels of the MPPC array to an ADC module, as well as sum the output channels to create an ADC trigger signal. The high-resolution detector is shown in Fig. 1. The individual analog signals from the control electronics are digitized with a custom FPGA-based ADC (AiT Instruments) processed and stored. Identification of the interaction point and energy deposited in the scintillator array is accomplished via center-of-mass calculation of the digitized signals and pre-measured crystal and energy lookup tables. This method facilitates accurate and rapid determination of photon interaction points in the detector.
Fig. 1.
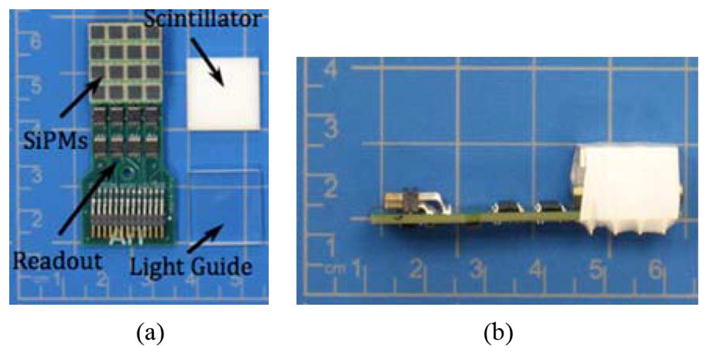
Pictures of the high-resolution detector (a) Constituent parts of the detector and (b) The assembled detector (the light-tight enclosure normally covering the device has been removed).
B. Lower-Resolution Detector
The lower-resolution detector consists of a 96 × 72 array of 2 × 2 × 15 mm3 LYSO detector elements (20 × 15 cm3). The scintillator array is coupled to a 4 × 3 array of Hamamatsu H8500 PSPMTs [9]. The PSPMTs are readout by custom resistive readout electronics [10]. The analog signals from the readout are digitized by a specially designed FPGA-based ADC unit (AiT Instruments), then processed and stored on the data acquisition control computer. Identification of the interaction point and energy deposited in the scintillator array is accomplished via center-of-mass calculation of the digitized signals and pre-measured position and energy tables.
| (1) |
C. Tandem PET System
The lower resolution detector was mounted on a support frame, while the small high-resolution detector was not fixed to a hard point and could be moved to any location. For best imaging performance, however, it was placed on a horizontal table located in a support frame with its center aligned with the center of the lower-resolution detector. A schematic drawing and picture of the system are shown in Fig. 2. The two detectors were 180 mm apart.
Fig. 2.
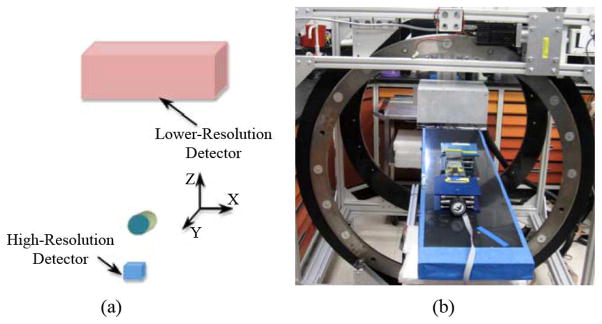
The tandem PET system (a) Schematic drawing and (b) Picture of the apparatus used for measurements.
It is important to note that the rectangular field-of-view (FOV) of the system is a function of distance from the object to the high-resolution detector. The cross section of the FOV for this scanner is a quadrilateral with opposite sides of equal length and adjacent angles equal to 90°. The extent of the FOV cross section can be calculated by:
| (2) |
where, FOVSide(d1) is the length of the FOV along the axis of choice (x- or y-axes), D1 is the spatial extent of the high-resolution detector along the x- or y-dimension, D2 is the spatial extent of lower-resolution detector, d1 is the distance from the high-resolution detector and L is a constant (the sum of d1 and d2). FOV is a linear function of d1 (it increases with increasing d1). The FOV in the x-direction is slightly larger than in the y-direction in our system due to the fact that the lower-resolution detector is slightly longer in the x-dimension (20 cm) than the y-dimension (15 cm).
The analog sum signals from the high and lower-resolution detectors are fed into constant fraction discriminators. Pulses from the discriminators are routed to a coincidence module whose output is used to initiate analog-to-digital conversions in the FPGA-based ADCs connected to the high and lower-resolution detectors. Data are stored on a computer in list mode format. Images were created using a limited-angle, Maximum Likelihood Expectation Maximization (MLEM) reconstruction algorithm and displayed using software written using the Interactive Data Language (IDL). The image voxel size is 0.5 mm3.
D. Imaging Performance Evaluation
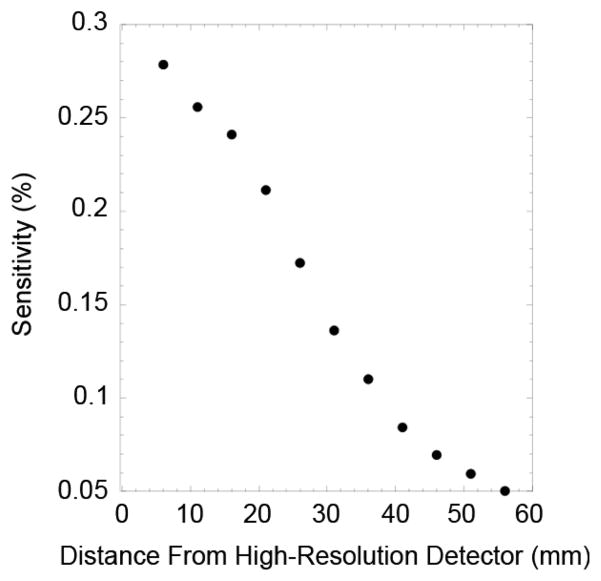
To explore the imaging envelope of the tandem imager, basic parameters (spatial resolution and detection sensitivity) were measured as a function of object position. A 0.1 mm diameter drop of 18F located on an acrylic disk was aligned with the center of the detectors and positioned at several distances from the surface of the small probe (4 mm to 56 mm). For each source position, the position of the source was identified and profiles drawn in the plane horizontal to the detector face (x-y-plane) and perpendicular to the detector face (x-z-plane). The FWHMs of each profile were calculated by fitting the pro-file to a Gaussian function. FWHM was plotted as a function of distance from the high-resolution detector. Detection efficiency of the system as a function of distance was measured by placing a small disk (0.22 mm diameter) containing 4.5μCi of 22Na (Eckert & Ziegler GmbH, Berlin Germany) at the same positions as those used to measure system resolution. The number of detected events at each position was compared to the calculated number of 511 keV of photons emitted by the source.
Some of the potential benefits of the high spatial resolution possessed by this scanner were demonstrated by imaging a specially constructed hot-rod phantom. This phantom consists of four sectors with 1, 1.5, 2 and 2.5 mm-diameter cylinders. In each sector, the centers of the cylinders are separated by twice their diameter. Each cylinder is 1 cm long. The cylinders were filled with a solution containing 18F (total of 10μCi). The phantom was imaged for five minutes in the tandem scanner (cylinders aligned with the z-axis and its center located 9 mm from the small detector). In addition, two pairs of gelatin spheres (3 mm and 5 mm diameter) were embedded in a 60 × 60 × 30 mm3 block of gelatin. The gelatin contained 0.16μCi/ml of 18F-Fluordeoxyglucose (FDG), representative of FDG uptake in adipose tissue [11]. The FDG concentration in one pair of spheres was 40 times the concentration in the gelatin block. The other pair contained 20 times the concentration in the gelatin block. The bottom of the phantom was placed 9 mm from the small detector and imaged for ten minutes.
III. Results
Fig. 3 shows an image of the point source used to measure spatial resolution. The image in Fig. 3(a) is a transaxial view (x-y-plane), while Fig. 3(b) is an axial view (x-z-plane). Fig. 4 shows intensity profiles drawn through the images of the point source shown in Fig. 3. The plots in Fig. 5 show the results of the measurement of spatial resolution as a function of distance from the high-resolution detector (d1). Detection sensitivity of the system as a function of distance from the high-resolution detector is shown in Fig. 6. Some of the imaging capabilities of the system are demonstrated in the images of the hot rod phantom shown in Fig. 7. Finally, Fig. 8 shows images of the phantom emulating positron-emitting, radiotracer-avid lesions in adipose-like tissue. The intensity profiles shown in Fig. 9 illustrate the contrast between the spheres and background. Specifically, the measured signal-to-background ratios are: 2.4:1 (3 mm diameter, 20:1 FDG target-to-background ratio), 5:1 (5 mm diameter 20:1 FDG target-to-background ratio), 3.2:1 (3 mm diameter, 40:1 FDG target-to-background ratio) and 8:1 (5 mm diameter, 40:1 FDG target-to-background ratio). All of the spheres are visually discernable from background.
Fig. 3.
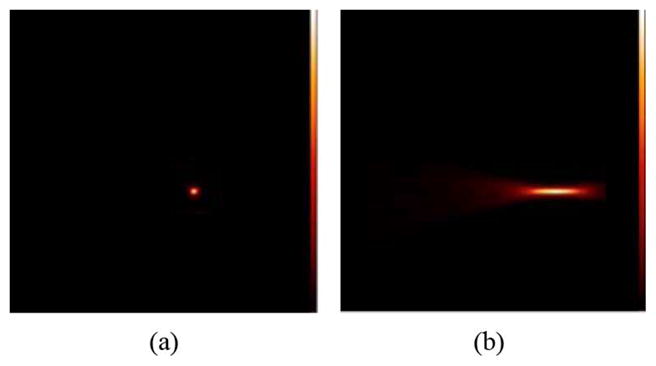
Images of the point source phantom (distance from the small detector = 9 mm) (a) Activity distribution of the point source in the x-y-plane and (b) In the x-z plane. Images obtained using MLEM reconstruction.
Fig. 4.
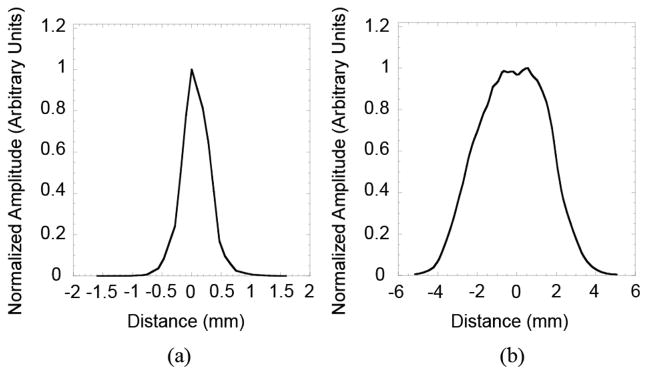
Profiles drawn on image of point source shown in Fig. 3 (a) Profile in the x-y-plane and (b) Profile in the x-z plane.
Fig. 5.
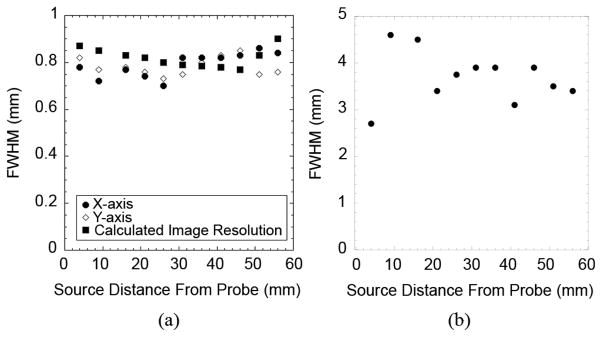
Spatialresolution measurements(a) Resolution in thex and y directions, in addition to resolution calculated with (1) and (b) Resolution in the z direction.
Fig. 6.
Results from the detection sensitivity measurements.
Fig. 7.
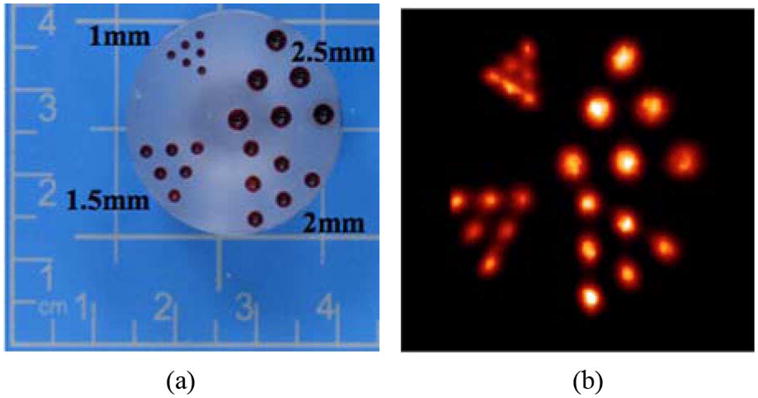
Images of the hot rod phantom the x-y-plane (a) Picture of the phantom, each group of rods is labeled with their diameters and (b) Image of the hot rod phantom (slice taken at 9 mm from the small detector, 10 image planes summed). Images obtained using MLEM reconstruction.
Fig. 8.
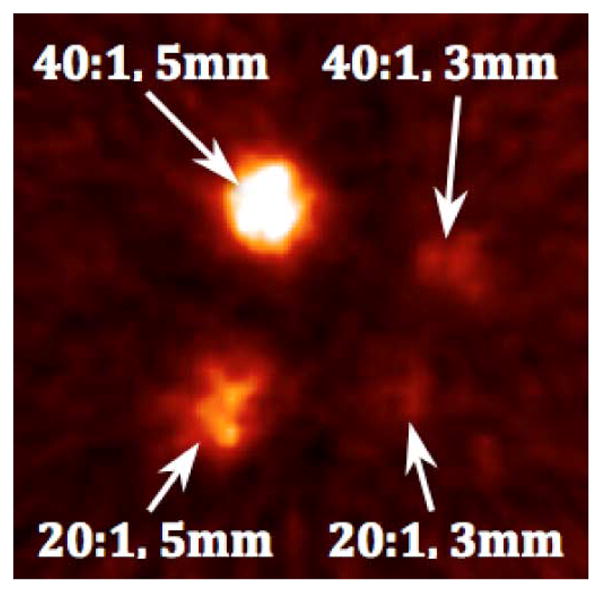
Image of the phantom acquired with the tandem PET scanner. The size and target-to-background radiotracer concentrations for each sphere are shown. Five images planes were summed to produce the image. Images obtained using MLEM reconstruction.
Fig. 9.
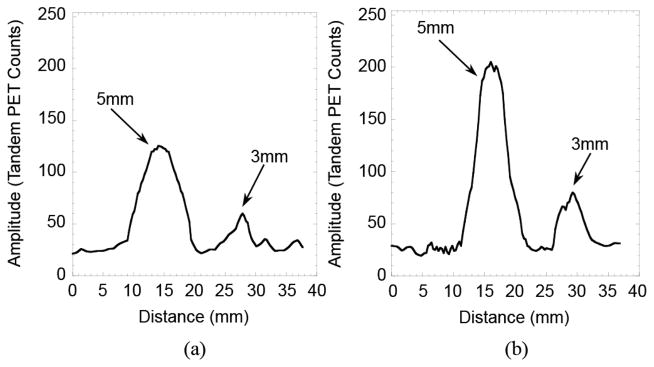
Intensity profiles drawn through the image shown in Fig. 8 (a) Profile drawn through the bottom row of spheres (20:1 target to background ratio) and (b) Profile drawn through the top row of spheres (40:1 ratio).
IV. Discussion
The imaging community strives continually to improve the spatial resolution of PET scanners. One potential approach is the use of a tandem detector system consisting of one detector with small detector elements (high-resolution) and another larger area detector with larger detector elements (lower-resolution). This solution can potentially be used to create a system with high spatial resolution in the plane parallel to the detector without significantly increasing expense, since the total amount of scintillator and electronics is relatively small compared to most high-resolution ring scanners. The small size of the high-resolution detector is an important attribute, facilitating potentially unique applications of the system. The major limiting factor is that the object must be placed very close to the high-resolution detector.
To assess the potential effectiveness of using the tandem detector scheme for high resolution PET imaging, we constructed and tested a prototype system. Initial evaluation of the imaging parameters showed some promising aspects of the scheme, while also illustrating some potential limitations. Specifically, the image shown in Fig. 3(a), along with the intensity profile of Fig. 4(a), illustrates the capabilities of the system to image a point source in the transaxial (x-y) plane. The image in Fig. 3(b), along with the profile shown in Fig. 4(b), shows the level of blurring in the axial dimension (z-axis), which limits the capabilities of the system to accurately localize a focal area of radiotracer uptake along this axis. The plot in Fig. 5(a) shows that the transaxial (x-y-plane) spatial resolution has relatively little dependence on distance from the high-resolution detector over the range of distances tested (~5 cm). Spatial resolution in this plane ranges from 0.7 mm to 0.9 mm FWHM. These results agree relatively well with the predicted values calculated using (1). Variations in the individual values of spatial resolution (Fig. 5) are produced by statistical noise in the data and difficulties in identifying the precise position of the point sources in the z-axis direction. This effect is due to blurring in the z-axis caused by incomplete angular sampling of the object.
The results shown in Fig. 6 demonstrate that, for a small disk source, the detection sensitivity ofthe tandem system isspatially dependant. As a source is moved away from the high-resolution detector (increasing d1), the solid angle subtended by this detector is reduced, while the solid angle subtended by the larger, lower-resolution detector increases, but at a much lower rate. As d1 increases the contribution to the system detection sensitivity transition gradually from being dominated by the small detector to the larger detector. From the results shown in Fig. 6, this transition occurs at d1 ≈ 25 mm where there is an inflection point in the curve. For a more distributed source, detection sensitivity would likely be somewhat more uniform as a function distance than for a point source. The magnitude of the detection sensitivity for this system is relatively small due to the thin scintillator (3 mm) utilized in the high-resolution detector. In this version of the detector, sensitivity was sacrificed for creation of a compact detector. Detection efficiency can be improved by making the high-resolution detector thicker or larger, but then a correction for depth of interaction effects would have to be implemented.
While quantitative test results provide good metrics with which to assess the potential capabilities of the system, the images of Figs. 7–9 illustrate the quality of images created by the scanner. Specifically, the image of the hot rod phantom in Fig. 7 illustrates the ability of the system to differentiate cylinders as small as 1 mm in diameter separated by 2 mm center-to-center. A perhaps more tangible illustration of the imaging potential of the system is shown in the simple simulation of positron-emitting, radiotracer-avid lesions in adipose tissue. The results shown in Figs. 8 and 9 illustrate that relatively small objects with high target-to-background radiotracer uptake ratios can be visualized. The differences of the measured contrast ratios from the actual ratios is due mostly to the spreading of the counts from the spheres and overlaying areas of radiotracer-containing gelatin among numerous image planes. This spreading of counts is caused by the required use of limited angle tomography methods. This effect diminishes some of the gains in count recovery produced by reducing the partial volume effect with very good resolution and makes quantification of radiotracer concentrations in observed objects impossible.
Evaluation of the prototype tandem PET scanner produced promising results and revealed some potentially important limitations of this concept. Specifically, the scanner produces good two-dimensional images, with significant blurring in the third dimension. Therefore, accurate three-dimensional localization of an area of tracer accumulation and of quantification of radiotracer concentration within the area are challenging. Furthermore, resolution of the tandem scanner is position dependent. To achieve maximum resolution and detection sensitivity, the object must be close to the high-resolution detector. Unfortunately, the FOV is smallest at these positions. Note that angular sampling of the FOV is somewhat limited, necessitating the use of limited angle reconstruction methods, which produces smearing of counts in the z-dimension. Consequently, detection of small objects can be hindered, as demonstrated by the imaging of the small spheres in a block of gelatin. Large target-to-background radiotracer ratios (at least 20:1) were necessary to detect the smallest spheres. Hence, these types of systems have a limited number of well-defined potential applications. Specifically, applications that allow the high-resolution detector to get very close to the object of interest and, ideally, that have minimal radiotracer-avid tissue overlaying the target imaging area. Recent work by Keesing, et al. in modeling the performance of hemispherical, high-resolution inserts used with commercially-available cylindrical PET scanners [12] may aid in evaluating the future applications of tandem PET systems.
In spite of the limitations identified in this investigation, a tandem PET system potentially has some important applications. For example, the compact nature of the scanner’s high-resolution element lends itself well to incorporation into an endorectal probe appropriate for imaging of the prostate. Clearly, some advances in radiotracer development are necessary to make this application an effective diagnostic procedure. Another potential application is the construction of a compact small animal imaging system, where the animal could be placed close to the high-resolution detector. Finally, tandem systems can be used like optical magnifying glasses are used. Specifically, they could be employed as specialized devices to magnify the spatial distribution of radiotracer uptake in a localized region that can be placed close to the high-resolution component of the scanner.
V. Conclusion
In conclusion, we have constructed a high resolution PET system. Testing revealed some limitations in its capabilities (relatively low detection sensitivity and small FOV), but also demonstrated its potential utility in specialized applications. Work is underway to address some of these deficiencies, and perhaps expand the choice of potential applications by increasing the detection sensitivity and FOV of system.
Acknowledgments
This work was supported in part by the United Stated National Institutes of Health under Grants R01 EB007349 and R01 CA094196.
Footnotes
Color versions of one or more of the figures in this paper are available online at http://ieeexplore.ieee.org.
Contributor Information
Alexander V. Stolin, Email: astolin@hsc.wvu.edu.
Stan Majewski, Email: stan.majewski@gmail.com.
Gangadhar Jaliparthi, Email: gjaliparthi@hsc.wvu.edu.
Raymond R. Raylman, Email: rraylman@wvu.edu.
References
- 1.Prasad R, Ratib OO, Zaidi H. NEMA NU-04-based performance characteristics of the LabPET-8 small animal PET scanner. Phys Med Biol. 2011;56:6649–6664. doi: 10.1088/0031-9155/56/20/009. [DOI] [PubMed] [Google Scholar]
- 2.Visser EP, Disselhorst JA, van Lier MGJTB, Laverman P, de Jong GM, Oyen EWJ, Boerman OC. Characterization and optimization of image quality as a function of reconstruction algorithms and parameter settings in a siemens inveon small-animal PET scanner using the NEMA NU 4–2008 standards. Nucl Instrum Meth Phys Res Sect A. 2011;629:357–367. [Google Scholar]
- 3.Cañadas M, Embid M, Lage E, Desco M, Vaquero JJ, Pe’rez JM. NEMA NU 4–2008 performance measurements of two commercial small-animal PET scanners: ClearPET and rPET-1. IEEE Trans Nucl Sci. 2011 Feb;58(1):58–65. [Google Scholar]
- 4.Jakoby MW, Bercier Y, Conti M, Casey ME, Bendriem B, Townsend DW. Physical and clinical performance of the mCT time-of-flight PET/CT scanner. Phys Med Biol. 2011;56:2375–2389. doi: 10.1088/0031-9155/56/8/004. [DOI] [PubMed] [Google Scholar]
- 5.Janecek M, Wu H, Tai YC. High resolution insert for clinical whole body PET scanners: Design and optimization. Proc IEEE Nucl Sci Symp Conf Rec. 2004;6:3849–3852. [Google Scholar]
- 6.Tai YC, Heyu W, Pal D, O’Sullivan JA. Virtual-pinhole PET. J Nucl Med. 2008;49:471–479. doi: 10.2967/jnumed.107.043034. [DOI] [PMC free article] [PubMed] [Google Scholar]
- 7.Mathews AJ, Komarov S, Kume M, Heyu W, O’Sullivan JA, Tai Y-C. Investigation of breast cancer detectability using PET insert with whole-body and zoom-in imaging capability. Proc. 8th IEEE Int. Symp. Biomed. Imag: From Nano to Macro; 2011. pp. 1784–1787. [Google Scholar]
- 8.Qi J, Yang Y, Zhou J, Wu Y, Cherry SR. Experimental assessment of resolution improvement of a zoom-in PET. Phys Med Biol. 2011;56:N165–N174. doi: 10.1088/0031-9155/56/17/N01. [DOI] [PubMed] [Google Scholar]
- 9.Raylman RR, Majewski S, Smith MF, Proffitt J, Hammond W, Srinivasan A, McKission J, Popov V, Weisenberger AG, Judy CO, Kross B, Ramasubramanian S, Banta LE, Kinahan PE, Champley K. The positron emission mammography/tomography breast imaging and biopsy system (PEM/PET): Design, construction and phantom-based measurements. Phys Med Biol. 2008;53:637–653. doi: 10.1088/0031-9155/53/3/009. [DOI] [PubMed] [Google Scholar]
- 10.Popov V, Majewski S, Weisenberger AG. Readout electronics for multianode photomultiplier tubes with pad matrix anode layout. Proc IEEE Nucl Sci Sympos Conf Rec. 2004;3:2156–2159. [Google Scholar]
- 11.Ramos CD, Erdi YE, Goene M, Reidel E, Yeung HW, MacApinlac HA, Chisin R, Larsen SM. FDG-PET standardized uptake in normal anatomical structures using iterative reconstruction segmented attenuation correction and filtered back-projection. Eur J Nucl Med. 2001;39:1002–1006. doi: 10.1007/s002590000421. [DOI] [PubMed] [Google Scholar]
- 12.Keesing DB, Mathews A, Komarov S, Wu H, Song TY, O’Sullivan JA, Tai Y. Image reconstruction and system modeling techniques for virtual-pinhole PET insert systems. Phys Med Biol. 57:2517–2538. doi: 10.1088/0031-9155/57/9/2517. [DOI] [PMC free article] [PubMed] [Google Scholar]


