

Abstract
Angelman syndrome (AS) is a severe disorder of postnatal brain development caused by neuron-specific loss of the HECT (homologous to E6AP carboxy terminus) domain E3 ubiquitin ligase Ube3a/E6AP. The cellular role of Ube3a remains enigmatic despite recent descriptions of synaptic and behavioral deficits in AS mouse models. Although neuron-specific imprinting is thought to limit the disease to the brain, Ube3a is expressed ubiquitously, suggesting a broader role in cellular function. In the current study, we demonstrate a profound structural disruption and cisternal swelling of the Golgi apparatus (GA) in the cortex of AS (UBE3Am−/p+) mice. In Ube3a knockdown cell lines and UBE3Am−/p+ cortical neurons, the GA is severely under-acidified, leading to osmotic swelling. Both in vitro and in vivo, the loss of Ube3a and corresponding elevated pH of the GA is associated with a marked reduction in protein sialylation, a process highly dependent on intralumenal Golgi pH. Altered ion homeostasis of the GA may provide a common cellular pathophysiology underlying the diverse plasticity and neurodevelopmental deficits associated with AS.
Introduction
Angelman syndrome (AS) is a rare neurodevelopmental disorder caused by loss of the maternal copy of UBE3A, an imprinted gene encoding the E3 ubiquitin ligase Ube3a/E6AP (Chamberlain and Lalande, 2010). Along with severe developmental delay and ataxia, distinctive features of AS include frequent laughter and smiling, near absence of speech, and abnormal electroencephalogram patterns (Williams, 2010). UBE3A has been linked to autism (Nurmi et al., 2001; Bucan et al., 2009; Glessner et al., 2009), and maternal 15q11–13 microduplication, encompassing UBE3A, is among the most common genetic abnormalities observed in autism spectrum disorders (Abrahams and Geschwind, 2008). Because of tissue-specific imprinting, Ube3a is expressed exclusively from the maternal allele in neurons, whereas other tissues express Ube3a biallelically (Albrecht et al., 1997; Rougeulle et al., 1997; Dindot et al., 2008; Gustin et al., 2010; Huang et al., 2012). AS model mice (UBE3Am−/p+) have deficits in experience-dependent synaptic plasticity (Jiang et al., 1998; Yashiro et al., 2009; Sato and Stryker, 2010) and synapse development (Dindot et al., 2008; Greer et al., 2010; Wallace et al., 2012), suggesting that Ube3a contributes to neural circuit development and plasticity through mechanisms that remain unclear.
Ube3a has been reported to bind and ubiquitinate diverse substrates (Mabb et al., 2011; Martínez-Noël et al., 2012). These include numerous proteins associated with secretory organelles, especially the Golgi apparatus (GA), such as golgin-160 (Jung et al., 2005), tuberin/TSC2 (Zheng et al., 2008), PIST (Jeong et al., 2007), ubiquilin (Kleijnen et al., 2000), and Src family kinases (Oda et al., 1999). The mammalian GA consists of closely arranged stacks of flat cisternae that sort and process nascent membrane proteins, secreted proteins, and lipids (van Vliet et al., 2003). Despite its stereotyped appearance, GA morphology is dynamic and influenced by many factors (van Vliet et al., 2003). In particular, loss of GA acidification disrupts GA morphology (Tartakoff et al., 1978; Thorens and Vassalli, 1986), impairs processing and glycosylation of proteins and lipids (Thorens and Vassalli, 1986; Palokangas et al., 1994; Rivinoja et al., 2009), and alters cargo sorting (Chanat and Huttner, 1991; Huang and Chang, 2011). Notably, Golgi dysfunction is associated with disorders of brain development and function, including language impairment (Newbury et al., 2009) and epilepsy (Simpson et al., 2004). Whether a functional relationship exists between Ube3a and the GA or other secretory organelles is unknown.
Here we report that cortical neurons of UBE3Am−/p+ mice display dramatically distended Golgi cisternae in vivo. Using Ube3a knockdown (KD) cell lines and UBE3Am−/p+ mouse neurons, we demonstrate marked under-acidification of the GA in Ube3a-deficient cells. Correspondingly, protein sialylation, a highly pH-dependent process normally occurring in acidic trans-Golgi cisternae (Thorens and Vassalli, 1986; Axelsson et al., 2001; Rivinoja et al., 2009), is significantly reduced in Ube3a KD cells and Ube3a-deficent mouse cortex. These results define a novel function for Ube3a in maintaining Golgi ion homeostasis and indicate that loss of Ube3a disrupts pH-sensitive functions of the GA. Under-acidification of the GA may contribute to the diverse plasticity and neurodevelopmental deficits reported in UBE3Am−/p+ mice and AS patients.
Materials and Methods
Mice.
Ube3a-deficient mice (129-Ube3atm1Alb/Jon) on a 129Sv/Ev background (Jiang et al., 1998) were obtained from The Jackson Laboratory (Stock #004477) and housed in a clean facility according to Duke University guidelines and protocols. Ube3a-deficient mice on a C57BL/6 background were obtained from Dr. Arthur Beaudet (Baylor College of Medicine) and Pfizer via The Jackson Laboratory. Maternal heterozygotes were bred with paternal wild-type (WT) mice to obtain UBE3Am−/p+ and WT littermates. Genotyping was performed on ear punch or tail tissue. Genomic DNA was purified using the Genomic DNA Purification Kit (Bio-Rad) or the DNeasy Blood and Tissue Kit (QIAGEN), and PCR was performed using PCR-ready beads (GE Healthcare) with the primer sequences provided by The Jackson Laboratory: (5′-3′) common, gct caa ggt tgt atg cct tgg tgc t; WT only, agt tct caa ggt aag ctg agc ttg c; KO only, tgc atc gca ttg tct gag tag gtg tc. Alternatively, genotyping was performed by Transnetyx or The Jackson Laboratory. Differentiation between UBE3Am−/p+ and UBE3Am+/p− littermates, when necessary, was performed by immunoblotting from cortical tissue with anti-Ube3a (Bethyl Laboratories).
Electron microscopy.
Electron microscopy was performed using brain tissue from 3- to 6-weeks-old (4 WT, 4 UBE3Am−/p+, 3 UBE3A−/−) paired 129Sv/Ev mice of either sex. Kidney tissue was also prepared from two additional sets of 4-week-old mice of either sex. WT and UBE3Am−/p+ mouse pairs were always littermates and prepared in parallel. Deeply anesthetized mice were perfused intracardially with a mixed aldehyde fixative, and the brain removed and postfixed for 2 h at 4°C. Vibratome sections (70 μm) were collected in phosphate buffer. For one mouse pair, live slices were prepared for electrophysiology as described previously (Yashiro et al., 2009) and fixed with a mixed aldehyde fixative. Vibratome sections were osmicated in phosphate buffer, rinsed in maleate buffer, stained en bloc with uranyl acetate in maleate buffer, and rinsed again in maleate buffer. Sections were dehydrated in serially increasing concentrations of ethanol, transferred to propylene oxide, and infiltrated with EmBed 812 resin. Sections were flat embedded between layers of Aclar plastic and the resin polymerized at 60°C for 48 h. Thin sections (70–90 nm) were cut, mounted on copper grids, and contrasted with uranyl acetate and lead salts. Sections were viewed at 80 kV on a FEI Tecnai T20 electron microscope.
Cultured Ube3a KD and scrambled control clone 9 cells were grown on chambered Thermanox slides (Nunc) and fixed, osmicated, stained en bloc, and dehydrated as described previously (Burghardt and Droleskey, 2006). Infiltration was performed with Epon diluted in 100% ethanol on the chambered slide. After 100% Epon infiltration, the chamber was removed from the slide, leaving only the sealing gasket. Epon was added to the top of the gasket, and the samples were cured at 60°C for 48 h. Unless otherwise specified, all reagents were obtained from Electron Microscopy Sciences.
For GM130 immunolabeling, sections were pretreated in 1% sodium borohydride and 3% hydrogen peroxide, blocked in 10% normal donkey serum, and incubated with anti-GM130 (BD Transduction) overnight in 2% normal donkey serum. The sections were subsequently incubated with biotin-conjugated donkey anti-mouse IgG (Jackson ImmunoResearch Laboratories) for 2 h, followed by 1 h in ExtrAvidin-Peroxidase conjugate (Sigma), and finally 10 min in Ni-DAB in hydrogen peroxide. Ni-DAB was created by reacting 0.5 mg/ml 3,3′-diaminobenzidine with 0.004% NH4Cl and 0.04% NiNH4SO4. Labeled sections were then embedded, sectioned, and imaged as above.
Plasmid DNA constructs, cloning, and mutagenesis.
Ube3a-pYFP-N1, a gift from Dr. Arthur Beaudet (Baylor College of Medicine), was used for initial screening of shRNA sequences. shRNA sequence #12894 against Ube3a in a pLKO.1/puro vector was obtained from Sigma as part of the Mission shRNA target kit against mouse E6AP/Ube3a (sense sequence: ccc aat gat gta tga tct aaa), and targets the three known isoforms of UBE3A of mouse, rat, and human. Scrambled shRNA in a pLKO.1/puro vector was obtained from Addgene (plasmid #1864, principal investigator: D. Sabatini). Vesicular stomatitis virus G-protein (VSVGts-GFP) and VAMP2-SEP were gifts from Dr. Kai Simons (Max Planck Institute) and Dr. George Augustine (Korea Institute of Science and Technology), respectively. pGolgi-YFP was created by AgeI/BsrGI digestion of pGolgi-CFP and Ube3a-pYFP-N1. pGolgi-CFP was obtained from Addgene (plasmid #11930, principal investigator: J. Lippincott-Schwartz) as pGolgi-Cerulean. The pGolgi-CFP-YFP construct was created by cloning of PCR-amplified YFP into pGolgi-CFP at the BsrG1 restriction site with a five glycine spacer between CFP and YFP. An endoplasmic reticulum (ER) pH probe pER-CFP-YFP was created by inserting the BsrG1/BsrG1 YFP fragment from pGolgi-CFP-YFP into pER-CFP (Clontech). Mitochondrial pH probes pMito-CFP and pMito-YFP were created by ligating the BamHI/NotI digested pDsRed2-Mito (Clontech) and CFP or YFP.
Generation of Ube3a shRNA stable cell line.
shRNA sequences were first tested in 293T cells (Duke Tissue Culture Facility, ATCC) by coexpressing them with Ube3a-pYFP-N1 for 1–4 d and analyzing Ube3a KD via immunoblotting for Ube3a. To create stable KD lines, clone 9 cells (Duke Tissue Culture Facility, ATCC) were transfected with Mission shRNA #12894 (Sigma) against Ube3a or a scrambled shRNA sequence (Addgene plasmid #1864, principal investigator: D. Sabatini) in a pLKO.1/puro vector with Lipofectamine 2000 (Invitrogen). After 48 h, cells were treated with 1 mg/ml puromycin (Invitrogen). Surviving clonal colonies were isolated and analyzed for Ube3a expression levels via immunoblotting for Ube3a (Bethyl Laboratories). Ube3a expression levels in single clones expressing either shRNA against Ube3a or the scrambled shRNA were compared with untreated clone 9 cells. Two clones with consistent Ube3a KD (Ube3a KD, KD2) and one clone with consistent Ube3a expression (control) were selected for further experiments, although other KD clones with various expression levels were also isolated.
Preparation of cell lysates and immunoblotting.
Cells were removed from plates either by trypsinizing or by scraping and rinsed with PBS, pelleted, and used either fresh or frozen at −80°C for later use. Cells were lysed and sonicated in a Tris-Triton X-100 buffer containing 50 mm Tris, 150 mm NaCl, 2 mm EDTA, 2 mm EGTA, 1% Triton X-100, pH 7.4, and a mixture of protease and phosphatase inhibitors, including 0.2 mm PMSF, 1.5 U/ml aprotinin, 10 μg/ml antipain, 10 μg/ml leupeptin, 10 μg/ml chymostatin, 10 μg/ml pepstatin, 1:100 Phosphatase Inhibitor Cocktail #1 (Sigma), and 1:100 Phosphatase Inhibitor Cocktail #2 (Sigma). Insoluble debris was removed by a 15,000 × g spin at 4°C for 10 min. Protein assays were performed on all samples using the DC Protein Assay Kit (Bio-Rad) according to the manufacturer's instructions. Immunoblotting was performed using standard methods with either anti-Ube3a (Bethyl Laboratories), anti-β-actin (Sigma), anti-tubulin (Sigma), or anti-FLAG M2 (Sigma) primary antibodies, and anti-rabbit or anti-mouse HRP secondary antibodies (Cell Signal). Blots were developed using ECL or ECL Plus (GE Healthcare), imaged using the Black Box imaging system (Fujifilm) and quantified using Multigauge software (Fujifilm).
VSVGts-GFP trafficking assay.
Imaging of VSVGts-GFP was performed essentially as described previously (Presley et al., 1997; Horton and Ehlers, 2003). To visualize trafficking from the Golgi, Ube3a KD and scrambled control stable lines were transfected with cDNA encoding VSVGts-GFP using Lipofectamine 2000 (Invitrogen) and incubated at 39.5°C overnight. The cells were transferred to 32°C to permit forward trafficking of VSVGts-GFP in the presence of 20 μg/ml cyclohexamide. Experiments were also performed with a 3 h incubation at 20°C to accumulate VSVGts-GFP in the GA before the 32°C release. Cells were stained live at 4°C with an antibody directed toward the lumenal N-terminal domain of VSVG (Dr. Kai Simons, Max Planck Institute) without permeabilization. Cells were subsequently fixed and costained with DAPI and anti-mouse Alexa-647 (Invitrogen). Coverslips were imaged on an Ultraview spinning disk confocal microscope (PerkinElmer). VSVG-transfected cells were traced using MetaMorph and ImageJ analysis software, background subtracted, and average intensities of the anti-VSVG (647) and VSVGts-GFP signals were measured.
VAMP2-SEP trafficking.
The rate of dendritic exocytic events of VAMP2-SEP was used to measure cargo exit from the GA (Cui-Wang et al., 2012). UBE3Am−/p+ and WT cultured cortical neurons were transfected with VAMP2-SEP and imaged live ∼20–28 h later in E4 imaging solution (120 mm NaCl, 3 mm KCl, 10 mm HEPES, 2 mm CaCl2, 2 mm MgCl2, 2 mm NaHCO3, 10 mm glucose, pH 7.4) at 36°C on a spinning disk confocal microscope (Nikon). Single planes were imaged for 5–12 min (mean 8.8 min) at 0.2 Hz. As a control, 50 mm NH4Cl in E4 was added at the end of some imaging sessions to reveal VAMP2-SEP in intracellular, normally acidic compartments. For analysis, proximal dendritic sections (maximum three per neuron) were blindly selected. Individual exocytic events were counted manually and blind to genotype, identified by their transient appearance. Event rate was calculated as Nevents × min−1 × μm−1 × 100, with each data point representing one neuron.
Golgi, ER, mitochondrial, and cytoplasmic pH measurements.
To measure Golgi pH, cells were dually transfected with pGolgi-YFP and pGolgi-CFP (Llopis et al., 1998) using Lipofectamine 2000 (Invitrogen). Between 22 and 27 h later, cells were imaged live on an Ultraview spinning disk confocal microscope (PerkinElmer) in either E4 imaging solution or MES pH calibration buffer (115 mm KCl, 5 mm NaCl, 1.2 mm MgSO4, 25 mm MES, 10 μm monensin, 0.5 μm bafilomycin A1; 20 min incubation before imaging). For analysis, the pGolgi-CFP signal was traced using a color-combined image, and the average intensity for pGolgi-YFP and pGolgi-CFP was then calculated for each imaged cell after background subtraction. Golgi pH measurements in neurons were performed using the same method after expression of the pGolgi-CFP-YFP probe, which was first tested in 293T cells incubated under various pH conditions in MES pH calibration buffer to ensure a linear pH reading between pH 5 and pH 7.5. Relative ER pH and mitochondrial pH in UBE3Am−/p+ and WT cultured neurons were measured with analogous methods using the pER-CFP-YFP and pMito-YFP plus pMito-CFP probes described above.
The membrane-permeable pH-sensitive dual-emission dye carboxy SNARF1 acetoxymethyl ester acetate (Invitrogen) was used to measure cytoplasmic pH (Han and Burgess, 2010). This dye is excited at 488 nm, and the relative intensities of red (548–595 nm) and far red (620–650 nm) emission are pH-dependent (Han and Burgess, 2010). UBE3Am−/p+ and WT cortical neurons were incubated with 10 μm SNARF1 for 15–25 min at 37°C, washed in E4, and subsequently imaged live on a Leica laser scanning confocal microscope. To calibrate the dye, WT neurons were incubated in pH-calibrated buffers (pH 6.40, pH 7.06, pH 7.60, and pH 8.14; containing 115 mm KCl, 5 mm NaCl, 1.2 mm MgSO4, 25 mm HEPES, 10 μm nigericin, 10 μm SNARF1) for 15–25 min before imaging. For analysis, stacks were maximum-projected, and mean intensity was measured for the same somatic regions on both red and far red channels. The background fluorescence values were subtracted from these results and the ratio of Red:Far Red fluorescence per cell was determined.
Primary mouse neuronal cultures.
Primary neuronal cultures were derived from early postnatal or embryonic mouse pups of either sex from both 129SvEv and C57BL/6 litters. Cortices were individually dissected in dissection media: 0.3% BSA (Invitrogen), 12 mm MgSO4 (Sigma), 10 mm HEPES (Invitrogen), 0.6% glucose (Sigma), and 10 μg/ml gentamicin (Invitrogen) in HBSS (Invitrogen). Neurons were dissociated, suspended in dissection media, and triturated. Cells from each pup were plated at high density onto poly-d-lysine-coated coverslips in Neurobasal medium (Invitrogen) supplemented with 5% FBS (Hyclone), 2% B27 (Invitrogen), 2 mm Glutamax (Invitrogen), and 1 μg/ml gentamicin (Invitrogen). Before transfection, the media was changed to maintenance medium: 2% B27, 2 mm Glutamax, 10 mm FUDR (Sigma) in Neurobasal. Cells were maintained at 37°C and 5% CO2. Genotyping was performed after plating as above on tail tissue and by immunoblot using remaining cortical cells. All experiments using cultured cortical neurons were performed between 7 and 14 DIV.
Lectin staining.
Coverslips were fixed in 4% paraformaldehyde/4% sucrose in Dulbecco's PBS (dPBS) for 20 min at room temperature and washed with dPBS. Sambucus nigra (SNA)-fluorescein (Vector Laboratories) was diluted 1:200 in dPBS and heated to 37°C, sonicated, and spun to remove precipitates. Coverslips were incubated with 200 μl of lectin solution for 30 min at room temperature in the dark, washed, costained with DAPI (Invitrogen), and mounted onto slides. The specificity of SNA-fluorescein for labeling of sialylconjugates was demonstrated by treating the fixed cells with 1:100 neuraminidase in G1 buffer (New England Biolabs) overnight at 37°C before lectin staining. Alternatively, cells were scraped from plates and lysates were prepared as above for immunoblotting. Membranes were subsequently incubated with 1:3000 SNA-HRP (EY Laboratories) for ∼1 h at room temperature and developed with ECL (GE Healthcare). For analysis, ImageJ was used to measure the integrated band intensity of SNA-reactive sialylconjugates >50 kDa. Each Ube3a KD sample was compared with the corresponding control sample on the same blot.
Isolation of surface proteins containing synthetic sialic acid residues.
Tissue culture plates were coated with acetylated N-azidoacetylmannosamine (Sigma; 1 mg/8 ml of EtOH) or EtOH alone (negative control) and allowed to dry. Ube3a KD and scrambled control cells were plated onto the coated dishes and allowed to grow for 72 h. The media from one plate per condition was removed and replaced with 1:100 neuraminidase (New England Biolabs) in dPBS and incubated for 30 min at 37°C. Cells from all conditions were then washed in dPBS, scraped, and pelleted. Cells were resuspended in Glycoprofile FLAG–Phosphine conjugate (Sigma; 1 mg/2.96 ml of dPBS) and rotated overnight at 4°C. FLAG-phosphine reacted cells were lysed in Tris-Triton X-100 lysis buffer, sonicated, and debris removed by centrifugation. Equal protein amounts from each condition were boiled in the presence of DTT. FLAG-tagged proteins were then isolated by immunoprecipitation with 1 μl of mouse anti-FLAG antibody (Sigma M2) overnight at 4°C and isolated by subsequent addition of 30 μl of Ultralink Protein A/G Agarose Beads for 1 h at 4°C. Precipitated beads were washed with Tris-Triton X-100 buffer, boiled in 30 μl of 5× Laemmli buffer for 5 min, and proteins resolved by SDS-PAGE. The resulting membranes were blocked with 4% BSA, incubated with mouse anti-FLAG (Sigma M2) overnight at 4°C and then with HRP-conjugated anti-mouse secondary antibody (Cell Signal). Membranes were developed using either ECL or ECL Plus (GE Healthcare) and the Fujifilm Smart Black Box image detection system. Intensity of all bands above the IgG signal per condition were quantified using Multigauge software (Fujifilm).
Protein sialylation in UBE3A−/− cortex.
Cortices from 11- to 15-weeks old UBE3A−/− and WT C57BL/6 mice of either sex were rapidly isolated, flash frozen on dry ice, homogenized in a HEPES-sucrose buffer (4 mm HEPES, 0.32 m sucrose, and protease inhibitor mixture tablets, Roche) and prepared for SDS-PAGE as above. Equal amounts of protein per sample were loaded onto gels, transferred onto membranes, and blocked with Carbo-Free Blocking Buffer (Vector Laboratories). To probe with multiple lectins/antibodies, sample sets were run in parallel on multiple gels or stripped and reprobed. Blots were incubated with SNA-HRP (EY Laboratories; no subsequent secondary), anti-Ube3a (Sigma, anti-mouse secondary from Pierce), or anti-GAPDH (Sigma, anti-mouse secondary from Pierce), and developed using ECL Plus (GE Healthcare) and Gel-Doc (Bio-Rad) systems. As a control for lectin reactivity, WT cortical lysates were pretreated with 0.5 μl of neuraminidase per 100 μg of lysate (New England Biolabs) for 3 h 20 min at 37°C. For analysis, ImageJ was used to measure the integrated band intensity of SNA-reactive sialylconjugates >75 kDa. Each UBE3A−/− sample was compared with the adjacent WT sample.
Statistics.
All data shown represent mean ± SEM. For imaging experiments, measurements from a sufficient number of cells per coverslip were averaged to represent the mean for an individual experiment. Two-tailed Student's t tests were used to compare two experimental means. One-way ANOVAs were performed to determine whether significant differences existed among multiple means.
Results
Golgi cisternae are severely distended in UBE3Am−/p+ and UBE3A−/− mouse cortex
To examine the effect of loss of Ube3a on organelle structure, we performed electron microscopy on WT, UBE3Am−/p+, and UBE3A−/− mouse visual cortex, a brain region where UBE3A is imprinted and its absence leads to deficits in experience-dependent plasticity (Yashiro et al., 2009; Sato and Stryker, 2010). In contrast to the typical organization of compact, stacked cisternae in WT neurons (Fig. 1A,B, white arrows), the GA in UBE3Am−/p+ and UBE3A−/− neurons exhibited swollen, distended, and disorganized cisternae (Fig. 1C–F). Although cisternal swelling disrupted GA morphology, the Golgi stack arrangement was preserved in UBE3Am−/p+ and UBE3A−/− brain with swollen membranes frequently observed adjacent to normal narrow cisternae (Fig. 1C,D,F, black arrows). Immunolabeling with the cis-Golgi marker GM130 confirmed the identity of the GA (Fig. 1B,D,F). GM130 immunoreactivity localized to slightly distended membranes adjacent to the most severely swollen compartments (Fig. 1D,F), although cisternal swelling was not obviously restricted to any particular Golgi subcompartment.
Figure 1.

Disrupted morphology of the GA in UBE3Am−/p+ and UBE3A−/− mouse cortex. A–F, Electron micrographs of WT (A, B), UBE3Am−/p+ (C, D), and UBE3A−/− (E, F) neurons in primary visual cortex. The GA (white arrows) of WT neurons has tightly stacked cisternae with narrow intralumenal spaces arranged in stacked arrays. In contrast, the GA in UBE3Am−/p+ and UBE3A−/− mouse cortex contain enlarged and distended cisternae (asterisks), often adjacent to cisternae with normal morphology (black arrows). B, D, F, GM130 immunoreactivity (electron-dense DAB precipitates, white arrowheads) marking the cis-Golgi in WT (B), UBE3Am−/p+ (D), and UBE3A−/− (F) neurons of visual cortex. Scale bars, 1 μm.
In contrast to Golgi abnormalities seen in neurodegenerative disorders (Gonatas et al., 2006), the GA in UBE3Am−/p+ or UBE3A−/− mice was not highly fragmented or dispersed. Moreover, whereas the morphological integrity of the GA was disrupted in the UBE3Am−/p+ brain, the ER and nuclear membrane were structurally intact and indistinguishable from WT (Fig. 2A). We also examined Golgi structures in kidney, where Ube3a is biallelically expressed (Fig. 2B). Despite moderately reduced Ube3a levels in UBE3Am−/p+ kidney, GA morphology was indistinguishable from WT (Fig. 2C). However, much like UBE3Am−/p+ cortex, the GA in UBE3A−/− kidney contained swollen cisternae (Fig. 2C), suggesting that complete loss of Ube3a contributes to GA pathology in multiple tissues. Together, these data show that loss of Ube3a leads to a severe and selective disruption of Golgi morphology in vivo that is characterized by swelling and distension of Golgi cisternae.
Figure 2.
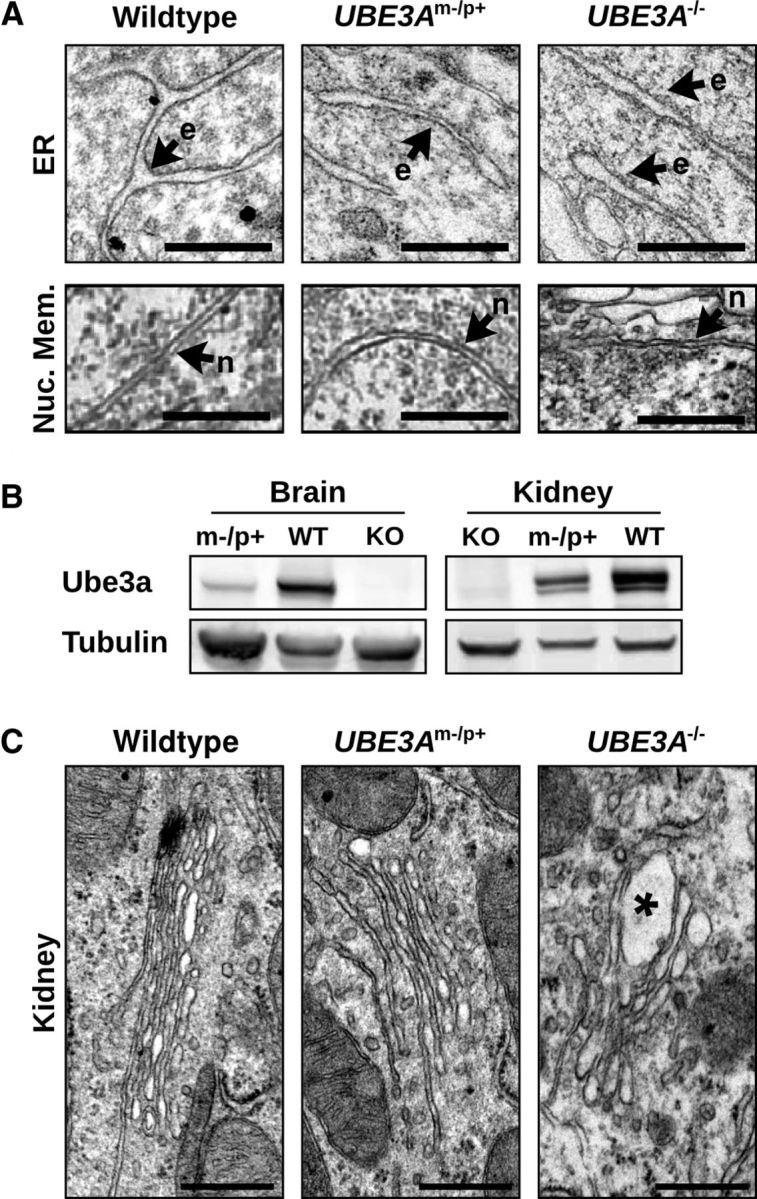
Gross alteration of organellar ultrastructure is limited to the GA and to tissues lacking Ube3a. A, Comparable morphologies of the peripheral ER (e) and nuclear envelope (n) in visual cortical neurons from WT, UBE3Am−/p+, and UBE3A−/− mice. Scale bars, 500 nm. B, Immunoblot analysis of Ube3a expression in brain and kidney of WT, UBE3Am−/p+, and UBE3A−/− mice. C, Electron micrographs of GA in WT, UBE3Am−/p+, and UBE3A−/− kidney. There is GA swelling in UBE3A−/− kidney (asterisk) and unaltered GA morphology in UBE3Am−/p+ kidney. Scale bars, 500 nm.
Ube3a KD cells have disrupted Golgi
The GA in mammalian cells is organized into characteristic stacks of narrow membrane-bound structures, and maintenance of this morphology is dependent on a number of cellular processes (van Vliet et al., 2003). In particular, Golgi cisternae become enlarged and distended during inhibition of cargo trafficking (Griffiths et al., 1989; Ladinsky et al., 2002; Cao et al., 2005) or elevation of the normally acidic intralumenal pH (Ledger et al., 1980; Thorens and Vassalli, 1986; Kellokumpu et al., 2002; Lázaro-Diéguez et al., 2006). Although methods to examine Golgi trafficking and pH in the intact brain in vivo are lacking, assays for both cargo trafficking (Presley et al., 1997; Lippincott-Schwartz et al., 2000; Horton and Ehlers, 2003; Sampo et al., 2003; Horton et al., 2005; Cui-Wang et al., 2012) and Golgi pH (Llopis et al., 1998; Paroutis et al., 2004) have been extensively developed for cultured cells. To test for defects in Golgi function in the absence of Ube3a, we created clonal cell lines with stable RNAi KD of Ube3a (Fig. 3A,B; Ube3a level normalized to nontransfected control cells: Ube3a KD 18.1 ± 4.5%, p < 0.001, n = 12; KD2 21.1 ± 9.6%, p = 0.001, n = 5; scrambled control 84.6 ± 13.3%, p = 0.30, n = 6). Given reports of altered Golgi structure and function in some cancer cell lines (Egea et al., 1993; Kellokumpu et al., 2002; Rivinoja et al., 2006), we chose clone 9 cells, a rat normal liver cell line that is not tumorigenic (Weinstein et al., 1975). As with UBE3Am−/p+ neurons in vivo, ultrastructural examination revealed disrupted GA morphology in Ube3a KD cells compared with scrambled RNAi control cells (Fig. 3C,D). Knockdown of Ube3a resulted in rounded, swollen Golgi cisternae that were often fenestrated (Fig. 3D). The GA morphology phenotype in Ube3a KD cells was less severe than UBE3Am−/p+ neurons in vivo (Fig. 1) potentially because of differences in cell type or residual Ube3a expression. As there were no obvious effects of Ube3a KD on cell proliferation, the Golgi phenotype is not likely the result of cell cycle disruption, a notion further supported by the disrupted GA morphology in postmitotic neurons (Fig. 1). Together, these findings demonstrate that altered Golgi morphology caused by loss of Ube3a is not specific to neurons and is not the result of prolonged lack of Ube3a over development. In addition, these results indicate that Ube3a KD cells can serve as a model system for Ube3a-dependent regulation of the GA.
Figure 3.

Ube3a KD disrupts Golgi morphology. A, Knockdown of endogenous Ube3a in clone 9 cells stably expressing Ube3a shRNA. NT, Nontransfected cells; KD, KD cells stably expressing shRNA against Ube3a; Ctrl, cells stably expressing a nontargeting scrambled shRNA. B, Quantification of Ube3a levels in scrambled control (Ctrl) and Ube3a KD cells, clones KD and KD2, relative to nontransfected (NT) clone 9 cells. **p ≤ 0.001. ns, Not significant (p = 0.30). C, D, Electron micrographs of GA in (C) control cells stably expressing scrambled shRNA and (D) stable Ube3a KD cells clones KD and KD2. The GA in control cells have narrow, elongated cisternae arranged in a characteristic stacked structure (white arrows). In contrast, Golgi cisternae in Ube3a KD cells are swollen (asterisks) and disorganized. Scale bars, 500 nm.
Generalized secretory trafficking is not compromised in Ube3a KD cells or UBE3Am−/p+ neurons
Nascent membrane proteins are synthesized at the ER, processed and sorted in the GA, and trafficked to their final destination via post-Golgi carriers (Lippincott-Schwartz et al., 2000; van Vliet et al., 2003; Hanus and Ehlers, 2008). Disruption of trafficking to, from, or within the GA can result in the distortion of Golgi morphology (Griffiths et al., 1989; Ladinsky et al., 2002; Cao et al., 2005). We thus tested whether altered secretory trafficking through the GA could explain the distended Golgi morphology in cells lacking Ube3a. For this, we exploited the ts045 temperature-sensitive mutant of the VSVGts-GFP, a model cargo protein that has been extensively used to visualize cargo transport through the secretory pathway (Presley et al., 1997; Lippincott-Schwartz et al., 2000). VSVGts-GFP is retained in the ER at 39.5°C and released upon a switch to 32°C, allowing synchronized release of a bolus of fluorescent cargo from the ER that can be visualized during transport to the GA and the plasma membrane (Presley et al., 1997; Horton and Ehlers, 2003). Using this strategy, we monitored VSVGts-GFP trafficking through the GA and accumulation at the plasma membrane after release from the ER (see Materials and Methods). Surprisingly, we observed no difference in the transport of VSVGts-GFP from the ER to the plasma membrane via the GA between control cells and Ube3a KD cells (Fig. 4A,B). Moreover, using surface immunolabeling to measure VSVGts-GFP accumulation at the plasma membrane after release from the ER, we found that the kinetics of membrane accumulation were unaffected by loss of Ube3a (surface/total VSVG: control, 0 min 0.39 ± 0.12, 30 min 1.93 ± 0.24, 60 min 2.99 ± 0.31; Ube3a KD, 0 min 0.27 ± 0.04, 30 min 2.30 ± 0.24, 60 min 3.14 ± 0.39; n = 7 or 8; p > 0.2 at all time points; Fig. 4A–C). To selectively monitor post-Golgi secretory trafficking, we introduced a second temperature block at 20°C to accumulate VSVGts-GFP in the GA before cargo release (Presley et al., 1997; Horton et al., 2005). Using this paradigm, we observed no difference in VSVGts-GFP surface accumulation after release from Golgi retention (surface/total VSVG, 30 min: control 2.47 ± 0.38, Ube3a KD 2.06 ± 0.34; n = 4 or 5; p = 0.46).
Figure 4.

Secretory trafficking of VSVGts-GFP and VAMP2-SEP is not disrupted by loss of Ube3a. A–C, VSVGts-GFP progression from the ER to the plasma membrane through the GA was monitored after temperature-induced ER release (see Materials and Methods). VSVGts-GFP distribution and immunoreactivity at the plasma membrane (Surface VSVG) in (A) control and (B) Ube3a KD cells at 0, 30, and 60 min after release from ER-exit blockade. Scale bars, 10 μm. C, Quantification of surface VSVGts-GFP, measured by surface antibody staining, relative to total VSVGts-GFP, measured by intrinsic GFP fluorescence. No significant differences were evident in VSVG surface accumulation between control cells and Ube3a KD cells. Scale bars, 10 μm. p > 0.2 at all time points. D–H, Cargo transport from the GA to the plasma membrane was measured in UBE3Am−/p+ and WT cortical neurons by monitoring VAMP2-SEP exocytic events in dendrites. D, Schematic of VAMP2-SEP trafficking. Upon leaving the GA, newly synthesized VAMP2-SEP is trafficked into dendrites (1), where it is exocytosed at the plasma membrane (2). VAMP2-SEP is then rapidly endocytosed (3) and retrafficked to the axon, where it accumulates at axonal terminals (4). VAMP2-SEP fluoresces at neutral pH levels and is quenched at the acidic pH levels of intracellular organelles. E, Time-lapse projections (6.5 min) of WT and UBE3Am−/p+ neuronal dendrites expressing VAMP2-SEP. Arrowheads indicate exocytic events that occurred during the time-lapse. Scale bar, 10 μm. F, Time-lapse montage of selected exocytic events (arrowheads) from dendrites in E, one image per 5 s, showing the appearance and disappearance of VAMP2-SEP on the dendritic surface over time. Scale bar, 5 μm. G, Quantification of exocytic event rate (Nevents × min−1 × μm−1 × 100) in WT and UBE3Am−/p+ neurons; p = 0.28. H, Demonstration of the pH-sensitive properties of VAMP2-SEP in WT and UBE3Am−/p+ dendrites. There is weak diffuse VAMP2-SEP fluorescence under basal conditions and the much brighter, punctate VAMP2-SEP fluorescence after NH4Cl neutralizes pH in intracellular compartments. Scale bar, 10 μm.
We next measured the trafficking rate of newly synthesized VAMP2, a protein that mediates presynaptic vesicle endocytosis (Schoch et al., 2001), in UBE3Am−/p+ and WT cortical neurons (Fig. 4D–H). VAMP2 is indirectly targeted to the axonal compartment via transcytosis (Sampo et al., 2003; Winckler, 2004; Lasiecka and Winckler, 2011). Upon leaving the Golgi, VAMP2 is first trafficked into dendrites, where it is exocytosed at the plasma membrane (Sampo et al., 2003). VAMP2 is then rapidly endocytosed and retrafficked to the axon, where it accumulates at axonal terminals (Sampo et al., 2003). Thus, despite its predominantly presynaptic localization, the trafficking route of newly synthesized VAMP2 allows direct imaging of the secretory exocytosis of a naturally occurring cargo at the somatodendritic membrane (Sampo et al., 2003; Cui-Wang et al., 2012) (Fig. 4D), and hence, an indirect assessment of cargo exit from the GA.
To monitor exocytic events, VAMP2 was tagged with superecliptic pHluorin, a pH-sensitive fluorophore that is quenched at the acidic pH of intracellular compartments but fluoresces at the neutral pH of the extracellular space (Miesenböck et al., 1998; Kennedy et al., 2010). Discrete exocytic events in live VAMP2-SEP transfected neurons were identified by their transient flash-like appearance (Fig. 4E,F). These abrupt increases in VAMP2-SEP fluorescence upon exocytosis were readily detectable in UBE3Am−/p+ and WT dendrites, indicating that the post-Golgi carriers are acidified relative to the extracellular media in both cases. The number of events (N) per minute were counted and normalized to the dendritic length to calculate the exocytic event rate. There was no significant difference in the exocytic event rate between UBE3Am−/p+ and WT neurons (N × min−1 × μm−1 × 100: WT 0.459 ± 0.13, n = 13 neurons; UBE3Am−/p+ 0.681 ± 0.15, n = 9; p = 0.28; Fig. 4G). In agreement with our results in Ube3a KD cells, these data show that there is not a generalized inhibition of cargo exit from the GA in the absence of Ube3a. Thus, GA distension in AS model mice and cells is not caused by a block of constitutive secretory cargo exit.
Under-acidification of the GA in the absence of Ube3a
Distended Golgi cisternae can also arise from disruptions in Golgi osmolarity and intralumenal pH (Ledger et al., 1980; Thorens and Vassalli, 1986; Kellokumpu et al., 2002; Lázaro-Diéguez et al., 2006). We thus sought to determine whether the normally acidic pH of the Golgi lumen (Paroutis et al., 2004; Casey et al., 2010) is altered in cells lacking Ube3a. To measure GA intralumenal pH in live cells, we exploited the pH sensitivity of YFP and the relative pH insensitivity of CFP. Specifically, we directed these fluorescent proteins to the lumen of medial/trans-Golgi cisternae by fusion with the Golgi targeting domain of β-1,4-galactosyltransferase. Because of the quenching of YFP by low pH, the ratio of YFP to CFP fluorescence in individual live cells provides a measure of intralumenal Golgi pH (Fig. 5A,B) (Llopis et al., 1998). To obtain an absolute measure of intralumenal Golgi pH, we calibrated the YFP:CFP fluorescence intensity ratios to measurements obtained under defined pH conditions (Fig. 5C). In Ube3a KD cells, the GA pH was significantly elevated compared with control cells (control, pH 5.9 ± 0.1; Ube3a KD 7.2 ± 0.1; n = 14; p < 0.001; Fig. 5D,E). In independent experiments, Golgi pH was elevated in another Ube3a KD clonal cell line tested as indicated by an increase in the YFP:CFP ratio (YFP/CFP: control 1.23 ± 0.10; Ube3a KD2 1.73 ± 0.14, p = 0.01; n = 11 or 12). The measured intralumenal pH in control cells (pH 5.9 ± 0.1) was consistent with values reported previously, which range between pH 5.9 and pH 6.6, depending on cell type and cis- versus trans-Golgi (Kim et al., 1996; Seksek et al., 1996; Llopis et al., 1998; Farinas and Verkman, 1999; Schapiro and Grinstein, 2000; Maeda et al., 2008). In contrast, the neutralized Golgi pH in Ube3a KD cells was substantially higher than any reported values in unperturbed cells.
Figure 5.
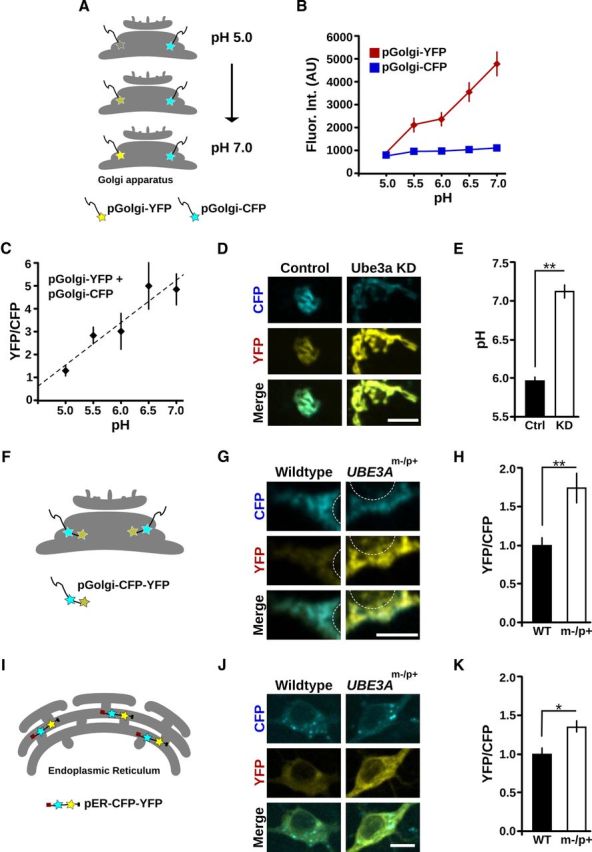
Golgi pH is elevated in Ube3a KD cells and in UBE3Am−/p+ neurons. A–E, Golgi pH is elevated in Ube3a KD cells. A, Schematic illustrating the method used to measure Golgi pH. YFP and CFP fluorophores are directed to the lumen of the GA using the Golgi targeting domain of β-1,4-galactosyltransferase. YFP fluorescence increases as pH increases, whereas CFP fluorescence is pH stable. B, C, Calibration of pGolgi-YFP:pGolgi-CFP ratios to absolute pH (see Materials and Methods). B, Quantification of pGolgi-YFP and pGolgi-CFP fluorescence (arbitrary units) at various defined pH values documenting their distinct pH sensitivities. C, Calibration curve (pGolgi-YFP:pGolgi-CFP fluorescence) used to calculate pH values. pH = 0.53 × YFP:CFP + 4.14, R2 = 0.9. D, pGolgi-YFP and pGolgi-CFP fluorescence in control and Ube3a KD cells. There is elevated pGolgi-YFP intensity in Ube3a KD cells compared with control cells. Scale bar, 10 μm. E, Quantification of Golgi pH in control (Ctrl) and Ube3a KD cells. **p < 0.001. F–H, Golgi pH is elevated in UBE3Am−/p+ neurons. F, Schematic of the probe used to measure Golgi pH in cultured cortical neurons. A Golgi pH probe with tandem CFP and YFP fluorophores (pGolgi-CFP-YFP) was expressed in cortical neurons cultured from WT and UBE3Am−/p+ mice. G, pGolgi-CFP-YFP fluorescence in WT and UBE3Am−/p+ neurons. White circles outline the nuclear region for orientation. There is elevated YFP intensity in the UBE3Am−/p+ neuron compared with the WT neuron. Scale bar, 10 μm. H, Average YFP:CFP fluorescence ratios of pGolgi-CFP-YFP in UBE3Am−/p+ neurons normalized to values in WT. **p = 0.001. I–K, ER pH is modestly elevated in UBE3Am−/p+ neurons. I, Schematic of the probe used to measure intralumenal ER pH. pER-CFP-YFP is a soluble protein targeted to the ER lumen by its N-terminal calreticulin signal sequence and C-terminal KDEL retrieval sequence. J, pER-CFP-YFP fluorescence in WT and UBE3Am−/p+ neurons. There is moderately elevated YFP intensity in the UBE3Am−/p+ neuron compared with the WT neuron. Scale bar, 10 μm. K, Average YFP:CFP fluorescence ratios of pER-CFP-YFP in UBE3Am−/p+ neurons after normalization to values in WT. *p < 0.01.
To further examine the role of Ube3a in Golgi acidification and to test whether altered Golgi pH contributes to neuronal dysfunction in AS, we measured Golgi pH in cortical neurons cultured from UBE3Am−/p+ mice. In cell lines, high levels of transfection permitted the use of population analysis to overcome variability in the expression rates of our YFP and CFP Golgi probes. In contrast, much lower efficiency transfection rates were expected in primary neuron cultures from postnatal mice. Therefore, we generated a dual-tagged pGolgi-CFP-YFP construct (Fig. 5F) to decrease transfection variability. We first tested this probe in 293T cells, which again revealed a linear relationship between pH and the YFP:CFP fluorescence ratio (YFP/CFP: pH 5.0, 0.20 ± 0.02; pH 6.0, 0.65 ± 0.05; pH 7.0, 1.1 ± 0.10, R2 = 0.999). These results demonstrate that any interactions between the fluorophores did not diminish the probe's ability to report Golgi pH. In agreement with our results from Ube3a KD cell lines, UBE3Am−/p+ neurons had significantly elevated intralumenal Golgi pH as indicated by an increase in YFP:CFP ratio (YFP/CFP, normalized to WT: WT 1.0 ± 0.10, UBE3Am−/p+ 1.74 ± 0.19; n = 4 or 5; p = 0.001, Fig. 5G,H). Together, these results strongly suggest that loss of Ube3a results in the elevation of Golgi pH, providing a probable mechanism for GA swelling.
ER pH is modestly increased in UBE3Am−/p+ neurons
To determine whether Ube3a-dependent alteration of subcellular pH is exclusive to the GA, we also measured the pH of the mitochondria, cytoplasm, and ER in UBE3Am−/p+ and WT cortical neurons. The regulation of mitochondrial ion homeostasis is distinct from that of the secretory pathway (Casey et al., 2010), and the mitochondrial inner matrix is alkaline, with pH ∼8 (Llopis et al., 1998). Indeed, we observed no significant difference in pMito-YFP:pMito-CFP ratios between UBE3Am−/p+ and WT neurons (YFP/CFP, normalized to WT: WT 1.00 ± 0.05, n = 4; UBE3Am−/p+ 1.02 ± 0.03, n = 6; p = 0.69), indicating that mitochondrial pH is unchanged in UBE3Am−/p+ neurons. We likewise saw no significant difference in cytoplasmic pH using the pH-sensitive dual-emission dye SNARF1 (Han and Burgess, 2010), and both WT and UBE3Am−/p+ neurons were within the expected range for cytoplasmic pH (WT pH 7.10 ± 0.11, n = 8; UBE3Am−/p+ pH 7.34 ± 0.10, n = 8; p = 0.096). Finally, we measured the pH of the ER, which, despite its lack of active acidification by H+-vATPases, requires ongoing ion exchange to balance the Ca2+/H+-pumping actions of SERCA (Ueno and Sekine, 1981; Levy et al., 1990; Yu and Inesi, 1993; Hirota et al., 2006; Edwards and Kahl, 2010; Kuum et al., 2012) through mechanisms that may be partially shared with Golgi ion homeostasis. Interestingly, ER pH was moderately elevated in UBE3Am−/p+ neurons over WT neurons as indicated by an increase in the YFP:CFP intensity ratio of pER-CFP-YFP (YFP/CFP, normalized to WT: WT 1.00 ± 0.08, n = 10; UBE3Am−/p+ 1.35 ± 0.08, n = 8; p < 0.01; Fig. 5I–K). Thus, the GA acidification defect in Ube3a-deficient cells is likely the result of a mechanism partially shared with other compartments of the early secretory pathway.
Reduction of Ube3a leads to deficits in surface sialylation
Elevation of Golgi pH leads to cisternal swelling (Ledger et al., 1980; Boss et al., 1984; Thorens and Vassalli, 1986; Kellokumpu et al., 2002; Lázaro-Diéguez et al., 2006) and altered protein glycosylation (Niemann et al., 1982; Alonso-Caplen and Compans, 1983; Ledger and Tanzer, 1984; Axelsson et al., 2001; Kellokumpu et al., 2002; Maeda et al., 2008; Rivinoja et al., 2009). Regarding the latter, the enzymatic activity, trans-Golgi localization, and heteromeric complex formation of sialyltransferases are highly pH-sensitive (Axelsson et al., 2001, Rivinoja et al., 2009; Hassinen et al., 2011). Indeed, the elevation of Golgi pH by just 0.2 pH units is sufficient to disrupt the addition of sialic acid to glycan structures in a linkage-specific manner (Rivinoja et al., 2009). Sialylation modulates interactions among proteins and lipids, thereby regulating cellular adhesion and cell signaling (Kleene and Schachner, 2004; Varki, 2007, 2008), including regulation of nervous system development and function (Castillo et al., 1997; Tyrrell et al., 2001; Kleene and Schachner, 2004; Isaev et al., 2007; Rutishauser, 2008; Yu et al., 2009; Repnikova et al., 2010). We thus reasoned that under-acidification of the GA in the absence of Ube3a might impair sialylation.
To determine whether Ube3a regulates sialylation, we took advantage of the SNA lectin, which binds selectively to terminal sialic acid residues added by an α-2,6 linkage with galactose or N-acetylgalactosamine on proteins and lipids (Fig. 6A) (Shibuya et al., 1987). Surface labeling using fluorescein-conjugated SNA revealed a marked reduction in surface sialylconjugates on Ube3a KD cells compared with control cells (Ube3a KD 41.3 ± 6.0% of control, n = 8; p < 0.01; Fig. 6B,C). Pretreatment with neuraminidase to remove terminal sialic acid residues from glycans abolished surface SNA labeling in control cells (Fig. 6B), indicating the selectivity of SNA binding. In addition, we probed total cellular lysates from Ube3a KD and control cells with HRP-conjugated SNA and observed a sharp reduction in sialylconjugates in Ube3a KD cells (45.2 ± 4.9% of control, n = 7; p < 0.001; Fig. 6D,E). Similar results were obtained with SNA-fluorescein and SNA-HRP in a separate Ube3a KD clone tested (SNA-fluorescein signal normalized to control: KD2 20.0 ± 2.7%, n = 4; p < 0.001; SNA-HRP normalized to control: KD2 39.6 ± 5.4%, n = 7; p < 0.001).
Figure 6.
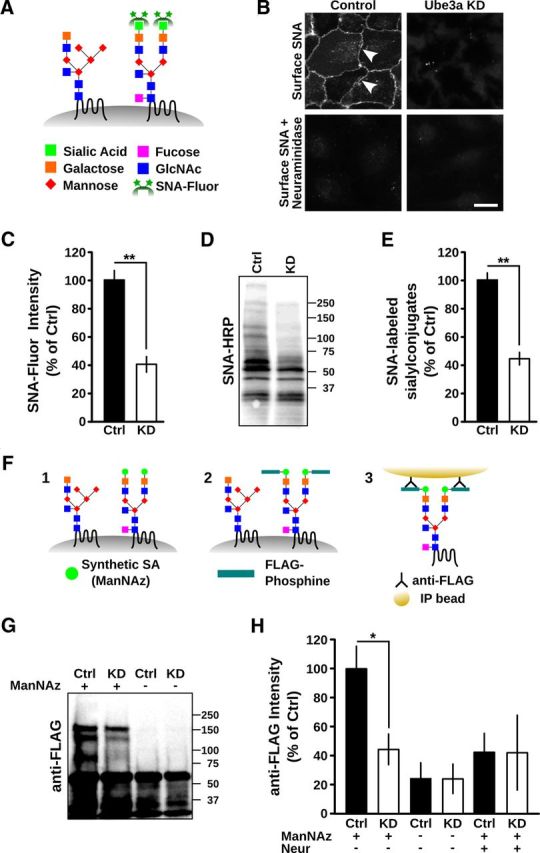
Loss of surface protein sialylation in cells lacking Ube3a. A–E, Loss of α-2,6-sialic acid conjugates in Ube3a KD cells. A, Schematic illustrating labeling of α-2,6 linked sialic acid conjugates with SNA-fluorescein. GlcNAc, N-acetylglucosamine; Fluor, fluorescein. B, Surface labeling of α-2,6-sialic acid conjugates in control cells (cell membranes indicated with white arrowheads) and Ube3a KD cells using SNA-fluorescein. Pretreatment with neuraminidase abolished SNA labeling. Scale bar, 10 μm. C, Quantification of surface bound SNA-fluorescein on scrambled shRNA control (Ctrl) and Ube3a KD cells. **p < 0.001. D, Total cellular lysates from control and Ube3a KD cells after SDS-PAGE and blotting with SNA-HRP. Molecular mass markers are shown. E, Corresponding average integrated SNA-HRP signal demonstrating reduced sialylation in Ube3a KD cells. **p < 0.001. F–H, Reduction in total protein sialylation in Ube3a KD cells revealed by metabolic labeling. F, Schematic illustrating metabolic labeling and isolation of sialylated proteins using covalent FLAG-phosphine chemistry (see Materials and Methods). ManNAz, a synthetic azide derivative precursor to sialic acid (SA), is incorporated into endogenous glycans (F1), allowing reaction and covalent tagging with FLAG-phosphine (F2), and immunoprecipitation with an anti-FLAG antibody (F3). G, FLAG immunoreactivity after SDS-PAGE and immunoblotting of immunoprecipitates from control (Ctrl) and Ube3a KD cells with (+) or without (−) exposure to ManNAz. Molecular mass markers are shown. There are reduced levels of high molecular mass sialylconjugates in Ube3a KD cells and an absence of corresponding molecular species without prior metabolic labeling. The dark band at ∼55 kDa is the IgG band from the immunoprecipitation. Species <50 kDa are nonspecific as they are present in the absence of ManNAz. H, Average FLAG immunoreactivity (>60 kDa) in immunoblots, such as shown in G, and from samples exposed to ManNAz and treated with neuraminidase before FLAG-phosphine, defining background levels. There is reduction of protein sialylation in Ube3a KD cells. p > 0.3 for Ube3a KD versus negative controls (ANOVA). *p < 0.05 for Ube3a KD versus control.
As SNA detects only α-2,6 linked sialylconjugates, we used an alternative method to isolate all surface proteins incorporating sialic acid residues. For this, we incubated cells with the synthetic sialic acid precusor N-azidoacetylmannosamine (ManNAz), which can be covalently tagged with a FLAG-phosphine conjugate (Saxon and Bertozzi, 2000; Vocadlo et al., 2003). FLAG-tagged species can then be isolated by immunoprecipitation with an anti-FLAG antibody under denaturing conditions (Fig. 6F; see Materials and Methods). Consistent with SNA lectin labeling, Ube3a KD cells had a significant reduction in immunopurified sialylconjugates (Ube3a KD 44.4 ± 10.6% of control, n = 3; p < 0.05; Fig. 6G,H). The metabolic labeling of sialyl conjugates was selective as the absence of ManNAz precursor or pretreatment of labeled cells with neuraminidase reduced the detection of FLAG-positive species to background levels (Fig. 6G,H). Together, these data indicate that cells lacking Ube3a have a marked reduction in surface sialylation, consistent with an under-acidified GA. Thus, altered Golgi ion homeostasis and defective glycosylation define a general defect in cells that lack the AS ubiquitin ligase Ube3a.
Protein sialylation is reduced in UBE3A−/− cortex
Glycosylation notoriously differs between in vitro cell culture and in vivo tissue (Berger, 2002; Lowe and Marth, 2003; Ohtsubo and Marth, 2006; Varki et al., 2009), and the same mutations in glycosyltransferases tolerated in vitro are lethal in vivo (Ioffe and Stanley, 1994; Metzler et al., 1994; Lowe and Marth, 2003). Moreover, the overlapping substrate specificity of glycosyltransferases (Kono et al., 1997) introduces opportunities for developmental compensation that can lead to unexpectedly altered, rather than absent, glycan structures (Kotani et al., 2001). In addition, different cell types express different complements of enzymes for glycosylation (Varki, 2006; Takashima, 2008), and glycosyltransferases differ in their sensitivity to pH (Chen et al., 2000; Axelsson et al., 2001; Rivinoja et al., 2009; Hassinen et al., 2011). Therefore, we wished to determine whether sialylation is reduced in Ube3a-deficient brain and thus relevant to AS pathogenesis. We measured the abundance of SNA-reactive sialylconjugates in cortical lysates prepared from UBE3A−/− and WT mice and found a significant decrease in total protein α-2,6-sialylation in UBE3A−/− cortex relative to WT cortex (UBE3A−/− 73.3 ± 5.5% of WT, n = 8; p < 0.002; Fig. 7). These results suggest there is a generalized deficit in sialylation in the Ube3a-deficent brain.
Figure 7.

Reduction of α-2,6-sialylation in Ube3a-deficient cortex. A, Total cortical lysates from WT and UBE3A−/− mice after SDS-PAGE and blotting with SNA-HRP, anti-Ube3a, and anti-GAPDH. Molecular mass markers are shown. B, Corresponding average integrated signal of SNA-HRP reactivity in UBE3A−/− cortical lysates normalized to WT demonstrating a reduction in total α-2,6 sialylation. **p < 0.002. C, WT cortical lysates were incubated with neuraminidase (+N) to demonstrate the specificity of SNA-HRP for detection of sialylated residues. Molecular mass markers are shown.
Discussion
Although understanding of synaptic and circuit defects in AS mouse models is now emerging, neither the cellular function of Ube3a nor the pathogenesis of AS is well understood. In this study, we uncovered an unanticipated phenotype of distended Golgi cisternae in UBE3Am−/p+ mouse cortex. The disrupted GA morphology is not the result of a generalized defect in secretory trafficking but rather associated with marked under-acidification of the Golgi lumen. Consistent with impaired Golgi acidification, Ube3a-deficient cells in vitro and in vivo exhibit significant reductions in protein sialylation, a post-translational modification highly dependent on Golgi pH. The discovery of a Golgi phenotype in UBE3Am−/p+ mice reveals a new Ube3a-regulated pathway that may contribute to AS pathogenesis.
In both Ube3a-deficient cortex and Ube3a KD cells, we observed severely distended Golgi cisternae without obvious disruption of other endomembrane structures. Distended Golgi have been observed in mice lacking the ATP-binding cassette transporter 1 (ABC1) or the secretory pathway Ca2+-ATPase 1 (SPCA1), models for Tangier and Hailey-Hailey diseases, respectively. Neither of these precisely phenocopies the UBE3Am−/p+ mice. Golgi abnormalities in ABC1−/− mice are limited to the trans-Golgi network and accompanied by severely disrupted mitochondria (Orsó et al., 2000). Similarly, the swollen Golgi cisternae in SPCA1−/− tissues are accompanied by rough ER dilation and embryonic lethality (Okunade et al., 2007). Instead, the histological and physiological phenotypes we describe here closely resemble in vitro phenotypes induced by disruption of Golgi ion homeostasis, such as treatment of cells with drugs that neutralize Golgi pH (Thorens and Vassalli, 1986) or dysregulation of Golgi ion channels/exchangers (Maeda et al., 2008).
Intriguingly, several neurodevelopmental disorders may result from recently discovered mutations in genes controlling organellar ion homeostasis. In particular, an AS-mimicking phenotype was recently reported in Christianson syndrome patients with loss-of-function mutations in Na+/H+ exchanger 6 (NHE6) (Gilfillan et al., 2008; Schroer et al., 2010), a regulator of organellar pH (Brett et al., 2002; Ohgaki et al., 2010). Similarly, NHE9 mutations were discovered in autistic patients (Morrow et al., 2008), and mutations in ATP6V0A2, encoding a H+-vATPase subunit, result in cutis laxa with a high incidence of developmental delay and microcephaly (Hucthagowder et al., 2009). Moreover, SPCA2, a Golgi-localized calcium pump (Xiang et al., 2005), has been linked to specific language impairment (Newbury et al., 2009). The existence of multiple genetic associations with organellar ion homeostasis suggests a common set of cellular pathways whose disruption is sufficient to cause severe deficits in brain development. It will be important for future studies to define the relationship between Ube3a and the various molecular mechanisms regulating endomembrane pH and ion homeostasis.
Despite a moderately increased ER pH in UBE3Am−/p+ neurons, we did not observe alterations in ER morphology in the Ube3a-deficient brain. The neutral pH of the ER is maintained by a combination of chloride channels/exchangers, potassium channels, and a H+ leak current, presumably via K+/H+ exchange (Hirota et al., 2006; Edwards and Kahl, 2010; Kuum et al., 2012). Differences between ER and Golgi counterion permeability may account for lack of ER swelling in the Ube3a-deficient cortex. For example, whereas both the ER-localized SERCA and the Golgi-localized SPCA1 pump Ca2+ in and H+ out, SERCA−/− mice have a collapsed ER structure (Swift et al., 2012) and SPCA1−/− mice have swollen Golgi (Okunade et al., 2007). Alternatively, the modest increase in lumenal ER pH may be insufficient to induce a noticeable osmolarity change relative to the cytoplasm.
Although we have identified Golgi under-acidification as the likely cause of the distended Golgi phenotype, the mechanism by which Ube3a regulates Golgi pH remains undetermined. Perhaps the simplest explanation would be the existence of a Ube3a substrate that either directly or indirectly regulates Golgi pH. The acidic pH of the GA is achieved by balancing active acidification by vacuolar H+-ATPases with chloride influx, cation exchange, and a H+ leak current, although the precise molecular identities and relative contributions of these are poorly understood (Casey et al., 2010). Given the overlapping phenotypes of AS and NHE6 mutations, an especially attractive mechanism would involve the organellar NHEs. These ubiquitously expressed (Na+,K+)/H+ exchangers concentrate in different subcellular compartments (NHE6, NHE9: endosomes; NHE7, NHE8: Golgi), and may contribute significantly to the H+ leak current in the secretory pathway (Casey et al., 2010; Ohgaki et al., 2011). Notably, overexpression of NHE6 (Ohgaki et al., 2010), NHE8 (Nakamura et al., 2005), or NHE9 (Nakamura et al., 2005) leads to alkalinization of corresponding intracellular compartments. Therefore, mechanisms leading to an overabundance of one or more organellar ion exchangers in the GA, perhaps by ubiquitin-dependent regulation of NHE trafficking (Roxrud et al., 2009), would be compatible with our findings. Alternatively, the trafficking of plasma-membrane localized NHEs (e.g., NHE1) could be disrupted, resulting in their GA accumulation.
The postnatal onset of AS and grossly normal histology of AS patients and UBE3Am−/p+ mice suggest that Ube3a is required for synaptic refinement, maintenance, and/or function. Golgi alkalinization impairs sialylation of diverse proteins and lipids (Thorens and Vassalli, 1986; Axelsson et al., 2001, Maeda et al., 2008; Rivinoja et al., 2009; Hirata et al., 2010), and we demonstrated here that loss of Ube3a reduces protein sialylation in both Ube3a KD cells and Ube3a-deficient mouse brain. In the brain, sialylation of proteins and lipids occurs in a developmentally regulated manner and regulates synapse formation, neurite outgrowth, neuron–glia interactions, ion channel properties, and neuronal excitability (Castillo et al., 1997; Tyrrell et al., 2001; Kleene and Schachner, 2004; Isaev et al., 2007; Rutishauser, 2008; Yu et al., 2009; Repnikova et al., 2010; Hu et al., 2011; Schwetz et al., 2011). Interestingly, alteration of lipid sialylation could conceivably explain the developmental delay in myelination in AS patients (Harting et al., 2009; Castro-Gago et al., 2010; Peters et al., 2011), a surprising phenotype given the absence of UBE3A imprinting in glial cells (Yamasaki et al., 2003). Myelination depends on interactions between membrane proteins and sialylated lipids (Schnaar and Lopez, 2009), and disrupting these interactions induces a developmental delay in myelination (Li et al., 1994; Montag et al., 1994; Sheikh et al., 1999). Reducing sialylation on several sodium and potassium ion channels significantly alters their conductance–voltage relationships and inactivation recovery rates (Bennett, 2002; Stocker and Bennett, 2006; Isaev et al., 2007; Schwetz et al., 2011). It will be interesting for future studies to determine whether reduced ion channel sialylation contributes to the stimulus-dependent long-term potentiation deficit, altered EEG patterns, or epilepsy in AS patients and AS model mice (Mabb et al., 2011). GA dysfunction can also disrupt dendritic branching and polarization (Hanus and Ehlers, 2008). Notably, Miao et al. (2013) recently reported altered dendritic branching, accompanied by altered GA polarization, in Ube3a-deficient neurons.
At the GA, the most prominent role for ubiquitination is sorting, rather than degradation, of protein substrates. In particular, ubiquitination regulates GGA-mediated sorting of cargo at the trans-Golgi network (Bonifacino, 2004) and postmitotic Golgi reassembly via the AAA ATPase p97 (Meyer, 2005). To date, Ube3a has only been shown to form K48-linked polyubiquitin chains on protein substrates (Kim et al., 2007), suggesting that a sorting role for Ube3a is less likely. However, proteasome inhibition can induce reversible Golgi fragmentation (Harada et al., 2003), suggesting that proteolytic functions of the ubiquitin pathway are also critical for Golgi integrity. Interestingly, the putative Ube3a substrate HHR23 (Kumar et al., 1999) was isolated with p97 (Besche et al., 2009), although the significance of this interaction is unknown. Identification of Ube3a as a regulator of Golgi ion homeostasis provides a new function for Ube3a and may reveal a new role for protein degradation as a regulator of the GA.
The recent description of proteins that regulate Golgi ion homeostasis provide targets for precise genetic manipulation of organellar pH in cellular and in vivo systems. Although several diseases linked to organellar ion homeostasis have recently been described (Gilfillan et al., 2008; Morrow et al., 2008; Hucthagowder et al., 2009; Newbury et al., 2009), the role of organellar pH in neuronal development and synaptic plasticity remains poorly understood. Examination of the effects of genetic or drug manipulation of these factors on a Ube3a-deficient background would provide insight into which AS phenotypes can be attributed to disruption of Golgi ion homeostasis. A set of small-molecule inhibitors have been developed for the cell-surface targeted NHE1 and evaluated for cardioprotective effects in clinical trials (Masereel et al., 2003; Slepkov et al., 2007), suggesting that specific drugs could be discovered for other NHEs.
The etiology of AS is relatively simple, as a single mutation in a single gene is sufficient to cause the disease (Cooper et al., 2004). However, it has become increasingly clear that AS pathogenesis is complex, with Ube3a regulating diverse pathways. In this study, we have described a novel phenotype of severely distended Golgi cisternae in the AS model mouse, accompanied by Golgi under-acidification and a reduction in protein sialylation in cells lacking Ube3a. We propose that Ube3a has a role in the maintenance of Golgi ion homeostasis and that Golgi under-acidification could underlie deficits in neuronal function and plasticity observed in UBE3Am−/p+ mice and AS patients.
Footnotes
This work was supported by National Institutes of Health Grants NS047574 and MH064748, the Angelman Syndrome Foundation, and the Howard Hughes Medical Institute (M.D.E.). K.H.C. was supported by a fellowship from the Ruth K. Broad Foundation and a National Institutes of Health training grant to the Duke University Department of Neurobiology. We thank John Allen, Tom Helton, Ben Philpot, Joel Schwartz, and Koji Yashiro for helpful discussions and assistance; Richard Weinberg for assistance with electron microscopy; Marguerita Klein for generation of the pGolgi-CFP-YFP construct; Kewa Mou for assistance with embryonic mouse cultures; and John Allen, Juliet Hernandez, Angela Mabb, Tingting Wang, and Jason Yi for insightful discussions and critical comments on the manuscript.
M.D.E. is an employee and shareholder of Pfizer, Inc. The remaining authors declare no competing financial interests.
References
- Abrahams BS, Geschwind DH. Advances in autism genetics: on the threshold of a new neurobiology. Nat Rev Genet. 2008;9:341–355. doi: 10.1038/nrg2346. [DOI] [PMC free article] [PubMed] [Google Scholar]
- Albrecht U, Sutcliffe JS, Cattanach BM, Beechey CV, Armstrong D, Eichele G, Beaudet AL. Imprinted expression of the murine Angelman syndrome gene, Ube3a, in hippocampal and Purkinje neurons. Nat Genet. 1997;17:75–78. doi: 10.1038/ng0997-75. [DOI] [PubMed] [Google Scholar]
- Alonso-Caplen FV, Compans RW. Modulation of glycosylation and transport of viral membrane glycoproteins by a sodium ionophore. J Cell Biol. 1983;97:659–668. doi: 10.1083/jcb.97.3.659. [DOI] [PMC free article] [PubMed] [Google Scholar]
- Axelsson MA, Karlsson NG, Steel DM, Ouwendijk J, Nilsson T, Hansson GC. Neutralization of pH in the Golgi apparatus causes redistribution of glycosyltransferases and changes in the O-glycosylation of mucins. Glycobiology. 2001;11:633–644. doi: 10.1093/glycob/11.8.633. [DOI] [PubMed] [Google Scholar]
- Bennett ES. Isoform-specific effects of sialic acid on voltage-dependent Na+ channel gating: functional sialic acids are localized to the S5–S6 loop of domain I. J Physiol. 2002;538:675–690. doi: 10.1113/jphysiol.2001.013285. [DOI] [PMC free article] [PubMed] [Google Scholar]
- Berger EG. Ectopic localizations of Golgi glycosyltransferases. Glycobiology. 2002;12:29R–36R. doi: 10.1093/glycob/12.2.29r. [DOI] [PubMed] [Google Scholar]
- Besche HC, Haas W, Gygi SP, Goldberg AL. Isolation of mammalian 26S proteasomes and p97/VCP complexes using the ubiquitin-like domain from HHR23B reveals novel proteasome-associated proteins. Biochemistry. 2009;48:2538–2549. doi: 10.1021/bi802198q. [DOI] [PMC free article] [PubMed] [Google Scholar]
- Bonifacino JS. The GGA proteins: adaptors on the move. Nat Rev Mol Cell Biol. 2004;5:23–32. doi: 10.1038/nrm1279. [DOI] [PubMed] [Google Scholar]
- Boss WF, Morré DJ, Mollenhauer HH. Monensin-induced swelling of Golgi apparatus cisternae mediated by a proton gradient. Eur J Cell Biol. 1984;34:1–8. [PubMed] [Google Scholar]
- Brett CL, Wei Y, Donowitz M, Rao R. Human Na(+)/H(+) exchanger isoform 6 is found in recycling endosomes of cells, not in mitochondria. Am J Physiol Cell Physiol. 2002;282:C1031–C1041. doi: 10.1152/ajpcell.00420.2001. [DOI] [PubMed] [Google Scholar]
- Bucan M, Abrahams BS, Wang K, Glessner JT, Herman EI, Sonnenblick LI, Alvarez Retuerto AI, Imielinski M, Hadley D, Bradfield JP, Kim C, Gidaya NB, Lindquist I, Hutman T, Sigman M, Kustanovich V, Lajonchere CM, Singleton A, Kim J, Wassink TH, et al. Genome-wide analyses of exonic copy number variants in a family-based study point to novel autism susceptibility genes. PLoS Genet. 2009;5:e1000536. doi: 10.1371/journal.pgen.1000536. [DOI] [PMC free article] [PubMed] [Google Scholar]
- Burghardt RC, Droleskey R. Transmission electron microscopy. Curr Protoc Microbiol Chapter. 2006;2 doi: 10.1002/9780471729259.mc02b01s03. Unit 2B.1. [DOI] [PubMed] [Google Scholar]
- Cao H, Weller S, Orth JD, Chen J, Huang B, Chen JL, Stamnes M, McNiven MA. Actin and Arf1-dependent recruitment of a cortactin-dynamin complex to the Golgi regulates post-Golgi transport. Nat Cell Biol. 2005;7:483–492. doi: 10.1038/ncb1246. [DOI] [PubMed] [Google Scholar]
- Casey JR, Grinstein S, Orlowski J. Sensors and regulators of intracellular pH. Nat Rev Mol Cell Biol. 2010;11:50–61. doi: 10.1038/nrm2820. [DOI] [PubMed] [Google Scholar]
- Castillo C, Díaz ME, Balbi D, Thornhill WB, Recio-Pinto E. Changes in sodium channel function during postnatal brain development reflect increases in the level of channel sialidation. Brain Res Dev Brain Res. 1997;104:119–130. doi: 10.1016/s0165-3806(97)00159-4. [DOI] [PubMed] [Google Scholar]
- Castro-Gago M, Gómez-Lado C, Eirís-Puñal J, Rodríguez-Mugico VM. Abnormal myelination in Angelman syndrome. Eur J Paediatr Neurol. 2010;14:292. doi: 10.1016/j.ejpn.2009.07.007. [DOI] [PubMed] [Google Scholar]
- Chamberlain SJ, Lalande M. Angelman syndrome, a genomic imprinting disorder of the brain. J Neurosci. 2010;30:9958–9963. doi: 10.1523/JNEUROSCI.1728-10.2010. [DOI] [PMC free article] [PubMed] [Google Scholar]
- Chanat E, Huttner WB. Milieu-induced, selective aggregation of regulated secretory proteins in the trans-Golgi network. J Cell Biol. 1991;115:1505–1519. doi: 10.1083/jcb.115.6.1505. [DOI] [PMC free article] [PubMed] [Google Scholar]
- Chen C, Ma J, Lazic A, Backovic M, Colley KJ. Formation of insoluble oligomers correlates with ST6Gal I stable localization in the golgi. J Biol Chem. 2000;275:13819–13826. doi: 10.1074/jbc.275.18.13819. [DOI] [PubMed] [Google Scholar]
- Cooper EM, Hudson AW, Amos J, Wagstaff J, Howley PM. Biochemical analysis of Angelman syndrome-associated mutations in the E3 ubiquitin ligase E6-associated protein. J Biol Chem. 2004;279:41208–41217. doi: 10.1074/jbc.M401302200. [DOI] [PubMed] [Google Scholar]
- Cui-Wang T, Hanus C, Cui T, Helton T, Bourne J, Watson D, Harris KM, Ehlers MD. Local zones of endoplasmic reticulum complexity confine cargo in neuronal dendrites. Cell. 2012;148:309–321. doi: 10.1016/j.cell.2011.11.056. [DOI] [PMC free article] [PubMed] [Google Scholar]
- Dindot SV, Antalffy BA, Bhattacharjee MB, Beaudet AL. The Angelman syndrome ubiquitin ligase localizes to the synapse and nucleus, and maternal deficiency results in abnormal dendritic spine morphology. Hum Mol Genet. 2008;17:111–118. doi: 10.1093/hmg/ddm288. [DOI] [PubMed] [Google Scholar]
- Edwards JC, Kahl CR. Chloride channels of intracellular membranes. FEBS Lett. 2010;584:2102–2111. doi: 10.1016/j.febslet.2010.01.037. [DOI] [PMC free article] [PubMed] [Google Scholar]
- Egea G, Francí C, Gambús G, Lesuffleur T, Zweibaum A, Real FX. cis-Golgi resident proteins and O-glycans are abnormally compartmentalized in the RER of colon cancer cells. J Cell Sci. 1993;105:819–830. doi: 10.1242/jcs.105.3.819. [DOI] [PubMed] [Google Scholar]
- Farinas J, Verkman AS. Receptor-mediated targeting of fluorescent probes in living cells. J Biol Chem. 1999;274:7603–7606. doi: 10.1074/jbc.274.12.7603. [DOI] [PubMed] [Google Scholar]
- Gilfillan GD, Selmer KK, Roxrud I, Smith R, Kyllerman M, Eiklid K, Kroken M, Mattingsdal M, Egeland T, Stenmark H, Sjøholm H, Server A, Samuelsson L, Christianson A, Tarpey P, Whibley A, Stratton MR, Futreal PA, Teague J, Edkins S, et al. SLC9A6 mutations cause X-linked mental retardation, microcephaly, epilepsy, and ataxia, a phenotype mimicking Angelman syndrome. Am J Hum Genet. 2008;82:1003–1010. doi: 10.1016/j.ajhg.2008.01.013. [DOI] [PMC free article] [PubMed] [Google Scholar]
- Glessner JT, Wang K, Cai G, Korvatska O, Kim CE, Wood S, Zhang H, Estes A, Brune CW, Bradfield JP, Imielinski M, Frackelton EC, Reichert J, Crawford EL, Munson J, Sleiman PM, Chiavacci R, Annaiah K, Thomas K, Hou C, et al. Autism genome-wide copy number variation reveals ubiquitin and neuronal genes. Nature. 2009;459:569–573. doi: 10.1038/nature07953. [DOI] [PMC free article] [PubMed] [Google Scholar]
- Gonatas NK, Stieber A, Gonatas JO. Fragmentation of the Golgi apparatus in neurodegenerative diseases and cell death. J Neurol Sci. 2006;246:21–30. doi: 10.1016/j.jns.2006.01.019. [DOI] [PubMed] [Google Scholar]
- Greer PL, Hanayama R, Bloodgood BL, Mardinly AR, Lipton DM, Flavell SW, Kim TK, Griffith EC, Waldon Z, Maehr R, Ploegh HL, Chowdhury S, Worley PF, Steen J, Greenberg ME. The Angelman syndrome protein Ube3A regulates synapse development by ubiquitinating arc. Cell. 2010;140:704–716. doi: 10.1016/j.cell.2010.01.026. [DOI] [PMC free article] [PubMed] [Google Scholar]
- Griffiths G, Fuller SD, Back R, Hollinshead M, Pfeiffer S, Simons K. The dynamic nature of the Golgi complex. J Cell Biol. 1989;108:277–297. doi: 10.1083/jcb.108.2.277. [DOI] [PMC free article] [PubMed] [Google Scholar]
- Gustin RM, Bichell TJ, Bubser M, Daily J, Filonova I, Mrelashvili D, Deutch AY, Colbran RJ, Weeber EJ, Haas KF. Tissue-specific variation of Ube3a protein expression in rodents and in a mouse model of Angelman syndrome. Neurobiol Dis. 2010;39:283–291. doi: 10.1016/j.nbd.2010.04.012. [DOI] [PMC free article] [PubMed] [Google Scholar]
- Han J, Burgess K. Fluorescent indicators for intracellular pH. Chem Rev. 2010;110:2709–2728. doi: 10.1021/cr900249z. [DOI] [PubMed] [Google Scholar]
- Hanus C, Ehlers MD. Secretory outposts for the local processing of membrane cargo in neuronal dendrites. Traffic. 2008;9:1437–1445. doi: 10.1111/j.1600-0854.2008.00775.x. [DOI] [PMC free article] [PubMed] [Google Scholar]
- Harada M, Kumemura H, Omary MB, Kawaguchi T, Maeyama N, Hanada S, Taniguchi E, Koga H, Suganuma T, Ueno T, Sata M. Proteasome inhibition induces inclusion bodies associated with intermediate filaments and fragmentation of the Golgi apparatus. Exp Cell Res. 2003;288:60–69. doi: 10.1016/s0014-4827(03)00162-9. [DOI] [PubMed] [Google Scholar]
- Harting I, Seitz A, Rating D, Sartor K, Zschocke J, Janssen B, Ebinger F, Wolf NI. Abnormal myelination in Angelman syndrome. Eur J Paediatr Neurol. 2009;13:271–276. doi: 10.1016/j.ejpn.2008.04.005. [DOI] [PubMed] [Google Scholar]
- Hassinen A, Pujol FM, Kokkonen N, Pieters C, Kihlström M, Korhonen K, Kellokumpu S. Functional organization of Golgi N- and O-glycosylation pathways involves pH-dependent complex formation that is impaired in cancer cells. J Biol Chem. 2011;286:38329–38340. doi: 10.1074/jbc.M111.277681. [DOI] [PMC free article] [PubMed] [Google Scholar]
- Hirata Y, Shimokawa N, Oh-hashi K, Yu ZX, Kiuchi K. Acidification of the Golgi apparatus is indispensable for maturation but not for cell surface delivery of Ret. J Neurochem. 2010;115:606–613. doi: 10.1111/j.1471-4159.2010.06966.x. [DOI] [PMC free article] [PubMed] [Google Scholar]
- Hirota S, Trimble N, Pertens E, Janssen LJ. Intracellular Cl- fluxes play a novel role in Ca2+ handling in airway smooth muscle. Am J Physiol Lung Cell Mol Physiol. 2006;290:L1146–L1153. doi: 10.1152/ajplung.00393.2005. [DOI] [PubMed] [Google Scholar]
- Horton AC, Ehlers MD. Dual modes of endoplasmic reticulum-to-Golgi transport in dendrites revealed by live-cell imaging. J Neurosci. 2003;23:6188–6199. doi: 10.1523/JNEUROSCI.23-15-06188.2003. [DOI] [PMC free article] [PubMed] [Google Scholar]
- Horton AC, Rácz B, Monson EE, Lin AL, Weinberg RJ, Ehlers MD. Polarized secretory trafficking directs cargo for asymmetric dendrite growth and morphogenesis. Neuron. 2005;48:757–771. doi: 10.1016/j.neuron.2005.11.005. [DOI] [PubMed] [Google Scholar]
- Hu J, Fei J, Reutter W, Fan H. Involvement of sialic acid in the regulation of γ-aminobutyric acid uptake activity of γ-aminobutyric acid transporter 1. Glycobiology. 2011;21:329–339. doi: 10.1093/glycob/cwq166. [DOI] [PubMed] [Google Scholar]
- Huang C, Chang A. pH-dependent cargo sorting from the Golgi. J Biol Chem. 2011;286:10058–10065. doi: 10.1074/jbc.M110.197889. [DOI] [PMC free article] [PubMed] [Google Scholar]
- Huang HS, Allen JA, Mabb AM, King IF, Miriyala J, Taylor-Blake B, Sciaky N, Dutton JW, Jr, Lee HM, Chen X, Jin J, Bridges AS, Zylka MJ, Roth BL, Philpot BD. Topoisomerase inhibitors unsilence the dormant allele of Ube3a in neurons. Nature. 2012;481:185–189. doi: 10.1038/nature10726. [DOI] [PMC free article] [PubMed] [Google Scholar]
- Hucthagowder V, Morava E, Kornak U, Lefeber DJ, Fischer B, Dimopoulou A, Aldinger A, Choi J, Davis EC, Abuelo DN, Adamowicz M, Al-Aama J, Basel-Vanagaite L, Fernandez B, Greally MT, Gillessen-Kaesbach G, Kayserili H, Lemyre E, Tekin M, Türkmen S, et al. Loss-of-function mutations in ATP6V0A2 impair vesicular trafficking, tropoelastin secretion and cell survival. Hum Mol Genet. 2009;18:2149–2165. doi: 10.1093/hmg/ddp148. [DOI] [PMC free article] [PubMed] [Google Scholar]
- Ioffe E, Stanley P. Mice lacking N-acetylglucosaminyltransferase I activity die at mid-gestation, revealing an essential role for complex or hybrid N-linked carbohydrates. Proc Natl Acad Sci U S A. 1994;91:728–732. doi: 10.1073/pnas.91.2.728. [DOI] [PMC free article] [PubMed] [Google Scholar]
- Isaev D, Isaeva E, Shatskih T, Zhao Q, Smits NC, Shworak NW, Khazipov R, Holmes GL. Role of extracellular sialic acid in regulation of neuronal and network excitability in the rat hippocampus. J Neurosci. 2007;27:11587–11594. doi: 10.1523/JNEUROSCI.2033-07.2007. [DOI] [PMC free article] [PubMed] [Google Scholar]
- Jeong KW, Kim HZ, Kim S, Kim YS, Choe J. Human papillomavirus type 16 E6 protein interacts with cystic fibrosis transmembrane regulator-associated ligand and promotes E6-associated protein-mediated ubiquitination and proteasomal degradation. Oncogene. 2007;26:487–499. doi: 10.1038/sj.onc.1209837. [DOI] [PubMed] [Google Scholar]
- Jiang YH, Armstrong D, Albrecht U, Atkins CM, Noebels JL, Eichele G, Sweatt JD, Beaudet AL. Mutation of the Angelman ubiquitin ligase in mice causes increased cytoplasmic p53 and deficits of contextual learning and long-term potentiation. Neuron. 1998;21:799–811. doi: 10.1016/s0896-6273(00)80596-6. [DOI] [PubMed] [Google Scholar]
- Jung SY, Malovannaya A, Wei J, O'Malley BW, Qin J. Proteomic analysis of steady-state nuclear hormone receptor coactivator complexes. Mol Endocrinol. 2005;19:2451–2465. doi: 10.1210/me.2004-0476. [DOI] [PubMed] [Google Scholar]
- Kellokumpu S, Sormunen R, Kellokumpu I. Abnormal glycosylation and altered Golgi structure in colorectal cancer: dependence on intra-Golgi pH. FEBS Lett. 2002;516:217–224. doi: 10.1016/s0014-5793(02)02535-8. [DOI] [PubMed] [Google Scholar]
- Kennedy MJ, Davison IG, Robinson CG, Ehlers MD. Syntaxin-4 defines a domain for activity-dependent exocytosis in dendritic spines. Cell. 2010;141:524–535. doi: 10.1016/j.cell.2010.02.042. [DOI] [PMC free article] [PubMed] [Google Scholar]
- Kim HT, Kim KP, Lledias F, Kisselev AF, Scaglione KM, Skowyra D, Gygi SP, Goldberg AL. Certain pairs of ubiquitin-conjugating enzymes (E2s) and ubiquitin-protein ligases (E3s) synthesize nondegradable forked ubiquitin chains containing all possible isopeptide linkages. J Biol Chem. 2007;282:17375–17386. doi: 10.1074/jbc.M609659200. [DOI] [PubMed] [Google Scholar]
- Kim JH, Lingwood CA, Williams DB, Furuya W, Manolson MF, Grinstein S. Dynamic measurement of the pH of the Golgi complex in living cells using retrograde transport of the verotoxin receptor. J Cell Biol. 1996;134:1387–1399. doi: 10.1083/jcb.134.6.1387. [DOI] [PMC free article] [PubMed] [Google Scholar]
- Kleene R, Schachner M. Glycans and neural cell interactions. Nat Rev Neurosci. 2004;5:195–208. doi: 10.1038/nrn1349. [DOI] [PubMed] [Google Scholar]
- Kleijnen MF, Shih AH, Zhou P, Kumar S, Soccio RE, Kedersha NL, Gill G, Howley PM. The hPLIC proteins may provide a link between the ubiquitination machinery and the proteasome. Mol Cell. 2000;6:409–419. doi: 10.1016/s1097-2765(00)00040-x. [DOI] [PubMed] [Google Scholar]
- Kono M, Ohyama Y, Lee YC, Hamamoto T, Kojima N, Tsuji S. Mouse β-galactoside alpha 2,3-sialyltransferases: comparison of in vitro substrate specificities and tissue specific expression. Glycobiology. 1997;7:469–479. doi: 10.1093/glycob/7.4.469. [DOI] [PubMed] [Google Scholar]
- Kotani N, Asano M, Iwakura Y, Takasaki S. Knockout of mouse beta 1,4-galactosyltransferase-1 gene results in a dramatic shift of outer chain moieties of N-glycans from type 2 to type 1 chains in hepatic membrane and plasma glycoproteins. Biochem J. 2001;357:827–834. doi: 10.1042/0264-6021:3570827. [DOI] [PMC free article] [PubMed] [Google Scholar]
- Kumar S, Talis AL, Howley PM. Identification of HHR23A as a substrate for E6-associated protein-mediated ubiquitination. J Biol Chem. 1999;274:18785–18792. doi: 10.1074/jbc.274.26.18785. [DOI] [PubMed] [Google Scholar]
- Kuum M, Veksler V, Liiv J, Ventura-Clapier R, Kaasik A. Endoplasmic reticulum potassium-hydrogen exchanger and small conductance calcium-activated potassium channel activities are essential for ER calcium uptake in neurons and cardiomyocytes. J Cell Sci. 2012;125:625–633. doi: 10.1242/jcs.090126. [DOI] [PubMed] [Google Scholar]
- Ladinsky MS, Wu CC, McIntosh S, McIntosh JR, Howell KE. Structure of the Golgi and distribution of reporter molecules at 20 degrees C reveals the complexity of the exit compartments. Mol Biol Cell. 2002;13:2810–2825. doi: 10.1091/mbc.01-12-0593. [DOI] [PMC free article] [PubMed] [Google Scholar]
- Lasiecka ZM, Winckler B. Mechanisms of polarized membrane trafficking in neurons: focusing in on endosomes. Mol Cell Neurosci. 2011;48:278–287. doi: 10.1016/j.mcn.2011.06.013. [DOI] [PMC free article] [PubMed] [Google Scholar]
- Lázaro-Diéguez F, Jiménez N, Barth H, Koster AJ, Renau-Piqueras J, Llopis JL, Burger KN, Egea G. Actin filaments are involved in the maintenance of Golgi cisternae morphology and intra-Golgi pH. Cell Motil Cytoskeleton. 2006;63:778–791. doi: 10.1002/cm.20161. [DOI] [PubMed] [Google Scholar]
- Ledger PW, Tanzer ML. Monensin: a perturbant of cellular physiology. Trends Biochem Sci. 1984;9:313–314. [Google Scholar]
- Ledger PW, Uchida N, Tanzer ML. Immunocytochemical localization of procollagen and fibronectin in human fibroblasts: effects of the monovalent ionophore, monensin. J Cell Biol. 1980;87:663–671. doi: 10.1083/jcb.87.3.663. [DOI] [PMC free article] [PubMed] [Google Scholar]
- Levy D, Seigneuret M, Bluzat A, Rigaud JL. Evidence for proton countertransport by the sarcoplasmic reticulum Ca2(+)-ATPase during calcium transport in reconstituted proteoliposomes with low ionic permeability. J Biol Chem. 1990;265:19524–19534. [PubMed] [Google Scholar]
- Li C, Tropak MB, Gerlai R, Clapoff S, Abramow-Newerly W, Trapp B, Peterson A, Roder J. Myelination in the absence of myelin-associated glycoprotein. Nature. 1994;369:747–750. doi: 10.1038/369747a0. [DOI] [PubMed] [Google Scholar]
- Lippincott-Schwartz J, Roberts TH, Hirschberg K. Secretory protein trafficking and organelle dynamics in living cells. Annu Rev Cell Dev Biol. 2000;16:557–589. doi: 10.1146/annurev.cellbio.16.1.557. [DOI] [PMC free article] [PubMed] [Google Scholar]
- Llopis J, McCaffery JM, Miyawaki A, Farquhar MG, Tsien RY. Measurement of cytosolic, mitochondrial, and Golgi pH in single living cells with green fluorescent proteins. Proc Natl Acad Sci U S A. 1998;95:6803–6808. doi: 10.1073/pnas.95.12.6803. [DOI] [PMC free article] [PubMed] [Google Scholar]
- Lowe JB, Marth JD. A genetic approach to Mammalian glycan function. Annu Rev Biochem. 2003;72:643–691. doi: 10.1146/annurev.biochem.72.121801.161809. [DOI] [PubMed] [Google Scholar]
- Mabb AM, Judson MC, Zylka MJ, Philpot BD. Angelman syndrome: insights into genomic imprinting and neurodevelopmental phenotypes. Trends Neurosci. 2011;34:293–303. doi: 10.1016/j.tins.2011.04.001. [DOI] [PMC free article] [PubMed] [Google Scholar]
- Maeda Y, Ide T, Koike M, Uchiyama Y, Kinoshita T. GPHR is a novel anion channel critical for acidification and functions of the Golgi apparatus. Nat Cell Biol. 2008;10:1135–1145. doi: 10.1038/ncb1773. [DOI] [PubMed] [Google Scholar]
- Martínez-Noël G, Galligan JT, Sowa ME, Arndt V, Overton TM, Harper JW, Howley PM. Identification and proteomic analysis of distinct UBE3A/E6AP protein complexes. Mol Cell Biol. 2012;32:3095–3106. doi: 10.1128/MCB.00201-12. [DOI] [PMC free article] [PubMed] [Google Scholar]
- Masereel B, Pochet L, Laeckmann D. An overview of inhibitors of Na(+)/H(+) exchanger. Eur J Med Chem. 2003;38:547–554. doi: 10.1016/s0223-5234(03)00100-4. [DOI] [PubMed] [Google Scholar]
- Metzler M, Gertz A, Sarkar M, Schachter H, Schrader JW, Marth JD. Complex asparagine-linked oligosaccharides are required for morphogenic events during post-implantation development. EMBO J. 1994;13:2056–2065. doi: 10.1002/j.1460-2075.1994.tb06480.x. [DOI] [PMC free article] [PubMed] [Google Scholar]
- Meyer HH. Golgi reassembly after mitosis: the AAA family meets the ubiquitin family. Biochim Biophys Acta. 2005;1744:108–119. doi: 10.1016/j.bbamcr.2005.03.011. [DOI] [PubMed] [Google Scholar]
- Miao S, Chen R, Ye J, Tan GH, Li S, Zhang J, Jiang YH, Xiong ZQ. The Angelman syndrome protein Ube3a is required for polarized dendrite morphogenesis in pyramidal neurons. J Neurosci. 2013;33:327–333. doi: 10.1523/JNEUROSCI.2509-12.2013. [DOI] [PMC free article] [PubMed] [Google Scholar]
- Miesenböck G, De Angelis DA, Rothman JE. Visualizing secretion and synaptic transmission with pH-sensitive green fluorescent proteins. Nature. 1998;394:192–195. doi: 10.1038/28190. [DOI] [PubMed] [Google Scholar]
- Montag D, Giese KP, Bartsch U, Martini R, Lang Y, Blüthmann H, Karthigasan J, Kirschner DA, Wintergerst ES, Nave KA. Mice deficient for the myelin-associated glycoprotein show subtle abnormalities in myelin. Neuron. 1994;13:229–246. doi: 10.1016/0896-6273(94)90472-3. [DOI] [PubMed] [Google Scholar]
- Morrow EM, Yoo SY, Flavell SW, Kim TK, Lin Y, Hill RS, Mukaddes NM, Balkhy S, Gascon G, Hashmi A, Al-Saad S, Ware J, Joseph RM, Greenblatt R, Gleason D, Ertelt JA, Apse KA, Bodell A, Partlow JN, Barry B, et al. Identifying autism loci and genes by tracing recent shared ancestry. Science. 2008;321:218–223. doi: 10.1126/science.1157657. [DOI] [PMC free article] [PubMed] [Google Scholar]
- Nakamura N, Tanaka S, Teko Y, Mitsui K, Kanazawa H. Four Na+/H+ exchanger isoforms are distributed to Golgi and post-Golgi compartments and are involved in organelle pH regulation. J Biol Chem. 2005;280:1561–1572. doi: 10.1074/jbc.M410041200. [DOI] [PubMed] [Google Scholar]
- Newbury DF, Winchester L, Addis L, Paracchini S, Buckingham LL, Clark A, Cohen W, Cowie H, Dworzynski K, Everitt A, Goodyer IM, Hennessy E, Kindley AD, Miller LL, Nasir J, O'Hare A, Shaw D, Simkin Z, Simonoff E, Slonims V, et al. CMIP and ATP2C2 modulate phonological short-term memory in language impairment. Am J Hum Genet. 2009;85:264–272. doi: 10.1016/j.ajhg.2009.07.004. [DOI] [PMC free article] [PubMed] [Google Scholar]
- Niemann H, Boschek B, Evans D, Rosing M, Tamura T, Klenk HD. Post-translational glycosylation of coronavirus glycoprotein E1: inhibition by monensin. EMBO J. 1982;1:1499–1504. doi: 10.1002/j.1460-2075.1982.tb01346.x. [DOI] [PMC free article] [PubMed] [Google Scholar]
- Nurmi EL, Bradford Y, Chen Y, Hall J, Arnone B, Gardiner MB, Hutcheson HB, Gilbert JR, Pericak-Vance MA, Copeland-Yates SA, Michaelis RC, Wassink TH, Santangelo SL, Sheffield VC, Piven J, Folstein SE, Haines JL, Sutcliffe JS, et al. Linkage disequilibrium at the Angelman syndrome gene UBE3A in autism families. Genomics. 2001;77:105–113. doi: 10.1006/geno.2001.6617. [DOI] [PubMed] [Google Scholar]
- Oda H, Kumar S, Howley PM. Regulation of the Src family tyrosine kinase Blk through E6AP-mediated ubiquitination. Proc Natl Acad Sci U S A. 1999;96:9557–9562. doi: 10.1073/pnas.96.17.9557. [DOI] [PMC free article] [PubMed] [Google Scholar]
- Ohgaki R, Matsushita M, Kanazawa H, Ogihara S, Hoekstra D, van Ijzendoorn SC. The Na+/H+ exchanger NHE6 in the endosomal recycling system is involved in the development of apical bile canalicular surface domains in HepG2 cells. Mol Biol Cell. 2010;21:1293–1304. doi: 10.1091/mbc.E09-09-0767. [DOI] [PMC free article] [PubMed] [Google Scholar]
- Ohgaki R, van IJzendoorn SC, Matsushita M, Hoekstra D, Kanazawa H. Organellar Na+/H+ exchangers: novel players in organelle pH regulation and their emerging functions. Biochemistry. 2011;50:443–450. doi: 10.1021/bi101082e. [DOI] [PubMed] [Google Scholar]
- Ohtsubo K, Marth JD. Glycosylation in cellular mechanisms of health and disease. Cell. 2006;126:855–867. doi: 10.1016/j.cell.2006.08.019. [DOI] [PubMed] [Google Scholar]
- Okunade GW, Miller ML, Azhar M, Andringa A, Sanford LP, Doetschman T, Prasad V, Shull GE. Loss of the Atp2c1 secretory pathway Ca(2+)-ATPase (SPCA1) in mice causes Golgi stress, apoptosis, and midgestational death in homozygous embryos and squamous cell tumors in adult heterozygotes. J Biol Chem. 2007;282:26517–26527. doi: 10.1074/jbc.M703029200. [DOI] [PubMed] [Google Scholar]
- Orsó E, Broccardo C, Kaminski WE, Böttcher A, Liebisch G, Drobnik W, Götz A, Chambenoit O, Diederich W, Langmann T, Spruss T, Luciani MF, Rothe G, Lackner KJ, Chimini G, Schmitz G. Transport of lipids from Golgi to plasma membrane is defective in tangier disease patients and Abc1-deficient mice. Nat Genet. 2000;24:192–196. doi: 10.1038/72869. [DOI] [PubMed] [Google Scholar]
- Palokangas H, Metsikkö K, Väänänen K. Active vacuolar H+ATPase is required for both endocytic and exocytic processes during viral infection of BHK-21 cells. J Biol Chem. 1994;269:17577–17585. [PubMed] [Google Scholar]
- Paroutis P, Touret N, Grinstein S. The pH of the secretory pathway: measurement, determinants, and regulation. Physiology (Bethesda) 2004;19:207–215. doi: 10.1152/physiol.00005.2004. [DOI] [PubMed] [Google Scholar]
- Peters SU, Kaufmann WE, Bacino CA, Anderson AW, Adapa P, Chu Z, Yallampalli R, Traipe E, Hunter JV, Wilde EA. Alterations in white matter pathways in Angelman syndrome. Dev Med Child Neurol. 2011;53:361–367. doi: 10.1111/j.1469-8749.2010.03838.x. [DOI] [PMC free article] [PubMed] [Google Scholar]
- Presley JF, Cole NB, Schroer TA, Hirschberg K, Zaal KJ, Lippincott-Schwartz J. ER-to-Golgi transport visualized in living cells. Nature. 1997;389:81–85. doi: 10.1038/38001. [DOI] [PubMed] [Google Scholar]
- Repnikova E, Koles K, Nakamura M, Pitts J, Li H, Ambavane A, Zoran MJ, Panin VM. Sialyltransferase regulates nervous system function in Drosophila. J Neurosci. 2010;30:6466–6476. doi: 10.1523/JNEUROSCI.5253-09.2010. [DOI] [PMC free article] [PubMed] [Google Scholar]
- Rivinoja A, Kokkonen N, Kellokumpu I, Kellokumpu S. Elevated Golgi pH in breast and colorectal cancer cells correlates with the expression of oncofetal carbohydrate T-antigen. J Cell Physiol. 2006;208:167–174. doi: 10.1002/jcp.20653. [DOI] [PubMed] [Google Scholar]
- Rivinoja A, Hassinen A, Kokkonen N, Kauppila A, Kellokumpu S. Elevated Golgi pH impairs terminal N-glycosylation by inducing mislocalization of Golgi glycosyltransferases. J Cell Physiol. 2009;220:144–154. doi: 10.1002/jcp.21744. [DOI] [PubMed] [Google Scholar]
- Rougeulle C, Glatt H, Lalande M. The Angelman syndrome candidate gene, UBE3A/E6-AP, is imprinted in brain. Nat Genet. 1997;17:14–15. doi: 10.1038/ng0997-14. [DOI] [PubMed] [Google Scholar]
- Roxrud I, Raiborg C, Gilfillan GD, Strømme P, Stenmark H. Dual degradation mechanisms ensure disposal of NHE6 mutant protein associated with neurological disease. Exp Cell Res. 2009;315:3014–3027. doi: 10.1016/j.yexcr.2009.07.012. [DOI] [PubMed] [Google Scholar]
- Rutishauser U. Polysialic acid in the plasticity of the developing and adult vertebrate nervous system. Nat Rev Neurosci. 2008;9:26–35. doi: 10.1038/nrn2285. [DOI] [PubMed] [Google Scholar]
- Sampo B, Kaech S, Kunz S, Banker G. Two distinct mechanisms target membrane proteins to the axonal surface. Neuron. 2003;37:611–624. doi: 10.1016/s0896-6273(03)00058-8. [DOI] [PubMed] [Google Scholar]
- Sato M, Stryker MP. Genomic imprinting of experience-dependent cortical plasticity by the ubiquitin ligase gene Ube3a. Proc Natl Acad Sci U S A. 2010;107:5611–5616. doi: 10.1073/pnas.1001281107. [DOI] [PMC free article] [PubMed] [Google Scholar]
- Saxon E, Bertozzi CR. Cell surface engineering by a modified Staudinger reaction. Science. 2000;287:2007–2010. doi: 10.1126/science.287.5460.2007. [DOI] [PubMed] [Google Scholar]
- Schapiro FB, Grinstein S. Determinants of the pH of the Golgi complex. J Biol Chem. 2000;275:21025–21032. doi: 10.1074/jbc.M002386200. [DOI] [PubMed] [Google Scholar]
- Schnaar RL, Lopez PH. Myelin-associated glycoprotein and its axonal receptors. J Neurosci Res. 2009;87:3267–3276. doi: 10.1002/jnr.21992. [DOI] [PMC free article] [PubMed] [Google Scholar]
- Schoch S, Deák F, Königstorfer A, Mozhayeva M, Sara Y, Südhof TC, Kavalali ET. SNARE function analyzed in synaptobrevin/VAMP knockout mice. Science. 2001;294:1117–1122. doi: 10.1126/science.1064335. [DOI] [PubMed] [Google Scholar]
- Schroer RJ, Holden KR, Tarpey PS, Matheus MG, Griesemer DA, Friez MJ, Fan JZ, Simensen RJ, Strømme P, Stevenson RE, Stratton MR, Schwartz CE. Natural history of Christianson syndrome. Am J Med Genet A. 2010;152A:2775–2783. doi: 10.1002/ajmg.a.33093. [DOI] [PMC free article] [PubMed] [Google Scholar]
- Schwetz TA, Norring SA, Ednie AR, Bennett ES. Sialic acids attached to O-glycans modulate voltage-gated potassium channel gating. J Biol Chem. 2011;286:4123–4132. doi: 10.1074/jbc.M110.171322. [DOI] [PMC free article] [PubMed] [Google Scholar]
- Seksek O, Biwersi J, Verkman AS. Evidence against defective trans-Golgi acidification in cystic fibrosis. J Biol Chem. 1996;271:15542–15548. doi: 10.1074/jbc.271.26.15542. [DOI] [PubMed] [Google Scholar]
- Sheikh KA, Sun J, Liu Y, Kawai H, Crawford TO, Proia RL, Griffin JW, Schnaar RL. Mice lacking complex gangliosides develop Wallerian degeneration and myelination defects. Proc Natl Acad Sci U S A. 1999;96:7532–7537. doi: 10.1073/pnas.96.13.7532. [DOI] [PMC free article] [PubMed] [Google Scholar]
- Shibuya N, Goldstein IJ, Broekaert WF, Nsimba-Lubaki M, Peeters B, Peumans WJ. The elderberry (Sambucus nigra L.) bark lectin recognizes the Neu5Ac(alpha 2–6)Gal/GalNAc sequence. J Biol Chem. 1987;262:1596–1601. [PubMed] [Google Scholar]
- Simpson MA, Cross H, Proukakis C, Priestman DA, Neville DC, Reinkensmeier G, Wang H, Wiznitzer M, Gurtz K, Verganelaki A, Pryde A, Patton MA, Dwek RA, Butters TD, Platt FM, Crosby AH. Infantile-onset symptomatic epilepsy syndrome caused by a homozygous loss-of-function mutation of GM3 synthase. Nat Genet. 2004;36:1225–1229. doi: 10.1038/ng1460. [DOI] [PubMed] [Google Scholar]
- Slepkov ER, Rainey JK, Sykes BD, Fliegel L. Structural and functional analysis of the Na+/H+ exchanger. Biochem J. 2007;401:623–633. doi: 10.1042/BJ20061062. [DOI] [PMC free article] [PubMed] [Google Scholar]
- Stocker PJ, Bennett ES. Differential sialylation modulates voltage-gated Na+ channel gating throughout the developing myocardium. J Gen Physiol. 2006;127:253–265. doi: 10.1085/jgp.200509423. [DOI] [PMC free article] [PubMed] [Google Scholar]
- Swift F, Franzini-Armstrong C, Øyehaug L, Enger UH, Andersson KB, Christensen G, Sejersted OM, Louch WE. Extreme sarcoplasmic reticulum volume loss and compensatory T-tubule remodeling after Serca2 knockout. Proc Natl Acad Sci U S A. 2012;109:3997–4001. doi: 10.1073/pnas.1120172109. [DOI] [PMC free article] [PubMed] [Google Scholar]
- Takashima S. Characterization of mouse sialyltransferase genes: their evolution and diversity. Biosci Biotechnol Biochem. 2008;72:1155–1167. doi: 10.1271/bbb.80025. [DOI] [PubMed] [Google Scholar]
- Tartakoff A, Vassalli P, Détraz M. Comparative studies of intracellular transport of secretory proteins. J Cell Biol. 1978;79:694–707. doi: 10.1083/jcb.79.3.694. [DOI] [PMC free article] [PubMed] [Google Scholar]
- Thorens B, Vassalli P. Chloroquine and ammonium chloride prevent terminal glycosylation of immunoglobulins in plasma cells without affecting secretion. Nature. 1986;321:618–620. doi: 10.1038/321618a0. [DOI] [PubMed] [Google Scholar]
- Tyrrell L, Renganathan M, Dib-Hajj SD, Waxman SG. Glycosylation alters steady-state inactivation of sodium channel Nav1.9/NaN in dorsal root ganglion neurons and is developmentally regulated. J Neurosci. 2001;21:9629–9637. doi: 10.1523/JNEUROSCI.21-24-09629.2001. [DOI] [PMC free article] [PubMed] [Google Scholar]
- Ueno T, Sekine T. A role of H+ flux in active Ca2+ transport into sarcoplasmic reticulum vesicles: II. H+ ejection during Ca2+ uptake. J Biochem. 1981;89:1247–1252. [PubMed] [Google Scholar]
- van Vliet C, Thomas EC, Merino-Trigo A, Teasdale RD, Gleeson PA. Intracellular sorting and transport of proteins. Prog Biophys Mol Biol. 2003;83:1–45. doi: 10.1016/s0079-6107(03)00019-1. [DOI] [PubMed] [Google Scholar]
- Varki A. Nothing in glycobiology makes sense, except in the light of evolution. Cell. 2006;126:841–845. doi: 10.1016/j.cell.2006.08.022. [DOI] [PubMed] [Google Scholar]
- Varki A. Glycan-based interactions involving vertebrate sialic-acid-recognizing proteins. Nature. 2007;446:1023–1029. doi: 10.1038/nature05816. [DOI] [PubMed] [Google Scholar]
- Varki A. Sialic acids in human health and disease. Trends Mol Med. 2008;14:351–360. doi: 10.1016/j.molmed.2008.06.002. [DOI] [PMC free article] [PubMed] [Google Scholar]
- Varki A, Cummings RD, Esko JD, Freeze HH, Stanley P, Bertozzi CR, Hart GW, Etzler ME. Essentials of glycobiology. Ed 2. Cold Spring Harbor, NY: Cold Spring Harbor Laboratory; 2009. [PubMed] [Google Scholar]
- Vocadlo DJ, Hang HC, Kim EJ, Hanover JA, Bertozzi CR. A chemical approach for identifying O-GlcNAc-modified proteins in cells. Proc Natl Acad Sci U S A. 2003;100:9116–9121. doi: 10.1073/pnas.1632821100. [DOI] [PMC free article] [PubMed] [Google Scholar]
- Wallace ML, Burette AC, Weinberg RJ, Philpot BD. Maternal loss of Ube3a produces an excitatory/inhibitory imbalance through neuron type-specific synaptic defects. Neuron. 2012;74:793–800. doi: 10.1016/j.neuron.2012.03.036. [DOI] [PMC free article] [PubMed] [Google Scholar]
- Weinstein IB, Orenstein JM, Gebert R, Kaighn ME, Stadler UC. Growth and structural properties of epithelial cell cultures established from normal rat liver and chemically induced hepatomas. Cancer Res. 1975;35:253–263. [PubMed] [Google Scholar]
- Williams CA. The behavioral phenotype of the Angelman syndrome. Am J Med Genet C Semin Med Genet. 2010;154C:432–437. doi: 10.1002/ajmg.c.30278. [DOI] [PubMed] [Google Scholar]
- Winckler B. Scientiae forum/models and speculations pathways for axonal targeting of membrane proteins. Biol Cell. 2004;96:669–674. doi: 10.1016/j.biolcel.2004.05.005. [DOI] [PubMed] [Google Scholar]
- Xiang M, Mohamalawari D, Rao R. A novel isoform of the secretory pathway Ca2+,Mn(2+)-ATPase, hSPCA2, has unusual properties and is expressed in the brain. J Biol Chem. 2005;280:11608–11614. doi: 10.1074/jbc.M413116200. [DOI] [PubMed] [Google Scholar]
- Yamasaki K, Joh K, Ohta T, Masuzaki H, Ishimaru T, Mukai T, Niikawa N, Ogawa M, Wagstaff J, Kishino T. Neurons but not glial cells show reciprocal imprinting of sense and antisense transcripts of Ube3a. Hum Mol Genet. 2003;12:837–847. doi: 10.1093/hmg/ddg106. [DOI] [PubMed] [Google Scholar]
- Yashiro K, Riday TT, Condon KH, Roberts AC, Bernardo DR, Prakash R, Weinberg RJ, Ehlers MD, Philpot BD. Ube3a is required for experience-dependent maturation of the neocortex. Nat Neurosci. 2009;12:777–783. doi: 10.1038/nn.2327. [DOI] [PMC free article] [PubMed] [Google Scholar]
- Yu RK, Nakatani Y, Yanagisawa M. The role of glycosphingolipid metabolism in the developing brain. J Lipid Res. 2009;50(Suppl):S440–S445. doi: 10.1194/jlr.R800028-JLR200. [DOI] [PMC free article] [PubMed] [Google Scholar]
- Yu X, Inesi G. Effects of anions on the Ca2+, H+ and electrical gradients formed by the sarcoplasmic reticulum ATPase in reconstituted proteoliposomes. FEBS Lett. 1993;328:301–304. doi: 10.1016/0014-5793(93)80948-t. [DOI] [PubMed] [Google Scholar]
- Zheng L, Ding H, Lu Z, Li Y, Pan Y, Ning T, Ke Y. E3 ubiquitin ligase E6AP-mediated TSC2 turnover in the presence and absence of HPV16 E6. Genes Cells. 2008;13:285–294. doi: 10.1111/j.1365-2443.2008.01162.x. [DOI] [PubMed] [Google Scholar]