

Abstract
This study compares the incidence, nature, and impact of persistent post-surgical pain after total knee arthroplasty (TKA) and total hip arthroplasty (THA) and investigates differences between these procedures, with the focus on potential presurgical and post-surgical issues that could be related to the distinct persistent post-surgical pain outcomes between these two groups. A consecutive sample of 92 patients was assessed prospectively 24 hours before, 48 hours, and 4–6 months after surgery. The data show that TKA patients had a higher likelihood of developing persistent post-surgical pain, of reporting higher pain levels, and of using more neuropathic descriptors when classifying their pain. In addition, TKA patients more often reported interference from pain on functional domains, including general activity, walking ability, and normal work. Demographic factors, like gender and age, along with presurgical clinical factors like disease onset, existence of medical comorbidities, and other pain problems, may have contributed to these differences, whereas baseline psychologic factors and functionality levels did not seem to exert an influence. Heightened acute post-surgical pain experience among TKA patients could also be related to distinct outcomes for persistent post-surgical pain. Future prospective studies should therefore collect TKA and THA samples wherein patients are homogeneous for demographic and presurgical clinical issues. Overall, these findings contribute to a small but growing body of literature documenting persistent post-surgical pain after major arthroplasty, conducted in different countries and across different health care settings.
Keywords: total knee arthroplasty, total hip arthroplasty, persistent post-surgical pain, demographic factors, clinical factors, psychologic factors
Introduction
Osteoarthritis of the knee and hip is one of the most prevalent chronic disorders in the elderly population, being characterized by both substantial pain and considerable disability in daily activities. Therefore, with the present and anticipated rise in the aging population, a considerable increase in the prevalence of this condition is expected.1–4
Despite the existence of pharmacologic and conservative treatments aimed at improving the symptoms of osteoarthritis, total joint replacement surgery, or arthroplasty, is the most effective common solution for such a chronic disease. Total knee arthroplasty (TKA) and total hip arthroplasty (THA) are the last solution to knee and hip osteoarthritis, usually yielding significant improvements in both functional status and experience of pain for the majority of patients.5 Nevertheless, some patients do not report amelioration of their condition, either with regard to functional restoration or pain relief.6 Interestingly, a significant number of these nonsuccessful cases do not show any abnormal radiologic findings, which suggests a multifarious set of factors playing a role in this process.4,6 The fact that many patients experience continuing pain and mobility difficulties after arthroplasty, a surgical procedure wherein pain relief is a key outcome, may leave patients confused, concerned, and emotionally upset.7,8
Persistent post-surgical pain (PPSP) is a major clinical problem with significant social and health care costs, and also causes considerable individual suffering.9,10 Recent data from a systematic review on the prevalence of PPSP after major joint arthroplasty11 indicate that 7%–23% and 10%–34% of patients report significant pain after THA and TKA, respectively. These estimates of PPSP prevalence are usually based on analyses of improvement in mean pain scores, thus not accounting for the associated standard deviation, which implies that some pain patients are not adequately considered by these statistical figures.11 The recent and growing interest in these two types of surgery is understandable, given their expected increase and some as yet unexpected outcomes. Being better acquainted with the specific features of pain after each of these two surgical procedures might improve knowledge on the part of health care practitioners, allowing clinical planning of preventive and treatment strategies that could target the prevention of PPSP after major arthroplasty. Therefore, the present study examined the incidence, nature, and impact of PPSP after THA and TKA in a Portuguese population sample. It also investigated potential demographic, clinical, and psychologic differences between these two groups before and after surgery.
Materials and methods
Participants and procedures
This was a prospective study conducted in a central hospital in northern Portugal, wherein a consecutive sample of 130 patients with osteoarthritis was enrolled. Inclusion criteria were age up to 80 years, being able to understand written information (and sign informed consent), not presenting any diagnosed psychiatric or neurologic pathology (eg, psychosis, dementia), having an American Society of Anesthesiologists (ASA) score between grade I and III, and undergoing THA or TKA following diagnosis of coxarthrosis or gonarthrosis only. Arthroplasties performed due to fractures were excluded, as well as hemiarthroplasties and revision or emergency arthroplasties.
Patients were recruited at the hospital and assessed 24 hours before (T1) and 48 hours after (T2) surgery. Follow-up assessments were performed during follow-up consultations 4–6 months later. Figure 1 provides a brief description of patient flow along the three assessment points. Between the T1 and T2 measurement points, six patients were withdrawn because of canceled surgery (n = 3), repeated surgery/reoperation (n = 2), and occurrence of post-surgical delirium (n = 1). Of the 124 patients with knee or hip arthroplasty who were assessed both before and after surgery, 32 were lost to the follow-up assessment at 4–6 months, leaving a sample of 92 patients for final analysis. These exclusions were due to post-surgical complications (eg, infection) or accidents (prosthesis displacement) that required revision arthroplasty in the operated joint (n = 8), need for arthroplasty in another joint (n = 7) or no attendance at the follow-up orthopedic consultation or a mismatch between patient and researcher timing (n = 17). Results for 92 patients (including 61 women) with a mean age at surgery of 64.0 ± 7.9 years were included in the analyses for the three time points.
Figure 1.

Flow chart of THA and TKA patients showing screening, inclusion, and assessment at all data collection points.
Abbreviations: ASA, American Society of Anesthesiologists; THA, total hip arthroplasty; TKA, total knee arthroplasty.
Ethical approval was granted by the hospital ethics committee and all participants had been previously informed about the study. After giving their consent to be included, all participants read and signed a written informed consent form.
Measures
The Portuguese validated versions of the following questionnaires were administered in a face-to-face interview by a trained psychologist. Table 1 provides an overview of the questionnaires administered at each assessment time point.
Table 1.
Sociodemographic, clinical and psychological measures used in each assessment point T1, T2, and T3
| Measures | T1 | T2 | T3 |
|---|---|---|---|
| Sociodemographic questionnaire | x | x | |
| Clinical data questionnaire | x | x | x |
| Brief Pain Inventory-short form | x | x | x |
| Neuropathic Pain Questionnaire | x | ||
| Hospital Anxiety and Depression Scale | x | x (only anxiety) | x |
| Revised Illness Perception Questionnaire (shortened version) | x | ||
| Revised Coping Strategies Questionnaire (pain catastrophizing subscale) | x | ||
| Sickness Impact Profile | x | x |
Abbreviations: T1, 24 hours before surgery; T2, 48 hours after surgery; T3, 4–6 months after surgery.
Sociodemographic questionnaire
The sociodemographic questionnaire included questions on age, education, residence, marital status, professional status, household, and parity.
Clinical data questionnaire
The clinical data questionnaire included questions concerning presurgical history of pain, including its onset, duration, and frequency, as well as pain due to other causes, pain in other joints (specifically in the knees and hips), and back pain. Data on other clinical issues like disease onset, previous surgery, height, weight, comorbidities, and use of psychotropic drugs were also collected. The existence of presurgical comorbid conditions was ascertained by patient interview or extracted from medical charts. For that purpose, the Deyo-Charlson comorbidity index12 was used, consisting of a weighted scale of 17 comorbidities, including hypertension, cardiac, pulmonary, renal and hepatic disease, diabetes mellitus, and cancer. The total number of comorbid health conditions was summed to yield a total score.
Brief Pain Inventory-short form
The Brief Pain Inventory-short form (BPI-SF)13 measures pain intensity on an 11-point numerical rating scale (NRS; from 0 or “no pain” to 10 or “worst pain imaginable”), pain analgesia, perception of analgesic relief, pain interference in daily activities (general activity, mood, walking, work, relationships with others, sleep, and enjoyment of life), and pain location. In this study, the Cronbach’s alpha internal consistency reliability coefficient14 for the pain interference subscale scores was high (T1, α = 0.88; T3, α = 0.92).
Neuropathic Pain Questionnaire
The Neuropathic Pain Questionnaire (DN4) instrument assesses pain characteristics/qualities along 10 items,15,16 and was used in this study because previous research has claimed that PPSP has a potential neuropathic component.17–19 Seven of the items in this instrument concern specific sensory pain descriptors, like burning, pinpricking, and numbness, and patients need to answer if their pain has those features through a dichotomous format (ie, “yes” or “no”). The last three items are scored on sensory examination of the patient performed by a clinician. For the purposes of this study, only the first seven items were used (our sample reliability, α = 0.67),14 as already described in other studies.16,20 In order to determine the potential neuropathic PPSP character, a total score was calculated, based on the sum of the number of positive answers to the seven pain descriptors (a score of 1 was given to each positive item and a score of 0 to each negative item), as described elsewhere.15,20 The total score was calculated as the sum of the seven items, and patients with a total score ≥3 were considered as presenting neuropathic pain characteristics.
Hospital Anxiety and Depression Scale
The Hospital Anxiety and Depression Scale (HADS)21 consists of two seven-item subscales that evaluate anxiety and depression levels in patients in nonpsychiatric hospital settings. The item response format is a Likert scale ranging from 0 to 3, with subscale scores varying between 0 and 21. Higher scores correspond to higher levels of anxiety and depression. In the current sample, internal consistency reliability14 was adequate for both anxiety (T1, α = 0.76; T2, α = 0.83; T3, α = 0.84) and depression (T1, α = 0.72; T3, α = 0.82).
Revised Illness Perception Questionnaire
The Revised Illness Perception Questionnaire (IPQ-R)22 assesses patient beliefs about the underlying condition that led to surgery, which in the present study was osteoarthritis. A psychometrically shortened version23 was used, with seven subscales encompassed by three items each, and focused on distinct dimensions of illness perception as follows: “timeline acute/chronic” (α = 0.97; eg, “My illness will last for a long time”); “timeline cyclical” (α = 0.57; eg, “My symptoms come and go in cycles”); “consequences” (α = 0.48; eg, “The disease underlying surgery has major consequences on my life”); “personal control” (α = 0.79; eg, “I have the power to influence my illness”); “treatment control” (α = 0.85; eg, “Surgery can control my illness”); “illness coherence” (α = 0.87; eg, “My illness is a mystery for me”); and “emotional representation” (α = 0.89; eg, “When I think about my illness I get upset”). With the exception of the “timeline cyclical” and “consequences” subscales, which had low internal consistency (0.57 and 0.48, respectively), the remaining subscales were found to have adequate properties. Items were classified on a five-point adjective rating scale (1 = strongly disagree, 2 = disagree, 3 = neither agree or disagree, 4 = agree, and 5 = strongly agree). To yield each subscale score, item scores were summed, with each subscale being rated on a scale of 3–15. Higher scores indicate worst results, with the exception of the personal and treatment control subscales.
Pain Catastrophizing Scale
The Pain Catastrophizing Scale of the Coping Strategies Questionnaire-revised form (CSQ-R)24 is a subscale containing six items that measure pain catastrophizing. Like in previous studies,20,25–27 items were rated on a five-point adjective rating scale (1 = never, 2 = almost never, 3 = sometimes, 4 = almost always, and 5 = always) rather than the seven-point scale used in the original instrument, due to difficulties encountered by patients in a pilot study when discriminating the seven points.25 The total subscale score varies between 6 and 30 (the sum of the six-item scores), with higher scores pointing to greater use of this specific pain coping strategy. In the current sample, the Cronbach’s alpha14 was 0.93, indicating good reliability.
Sickness Impact Profile
The Sickness Impact Profile (SIP)28 measures health-related disability. Ambulation, body care and movement, mobility, management in the home, recreation activities, social activities, emotion, sleep, and rest were the eight subscales included in this study, providing either an overall score or a specific score for physical, psychosocial, and other dimensions. Higher results, expressed as a percentage (0%–100%) are associated with more limitations. In this study, the internal consistency reliability14 for the total subscale scores was adequate (T1, α = 0.78; T3, α = 0.84).
Clinical variables
Clinical data related to surgery, anesthesia, and analgesia were obtained from medical records. After surgery, standardized postoperative nursing and physical therapy protocols were used for all patients. Patients were mobilized out of bed on the second postoperative day, and all had a postoperative anticoagulation protocol using low molecular weight heparin. After surgery, patients were given prophylactic systemic antibiotics and prophylactic anticoagulation to decrease the risk of deep venous thrombosis. No research-related change was introduced into the standard clinical protocol. Acute pain team professionals were blinded as to their patients’ participation in the study.
Surgical procedure
From the sample of 92 patients, 44 (47.8%) underwent TKA (14 on the left side and 30 on the right side), and 48 (52.2%) underwent THA (25 on the left side and 23 on the right side). The surgeries were performed by the team of surgeons in the orthopedic unit at the hospital.
Anterior-posterior hip and lateral knee radiographs were taken for THA and TKA patients, respectively, and reviewed both immediately after surgery and before the patients were transferred to the infirmary for continued care. At the follow-up consultation (T3), radiographs were taken again in order to ensure that the prosthesis was inserted properly and that alignment was correct, which was verified for all patients included in the study sample.
Anesthetic technique
In all patients, the type of anesthesia used was determined by the health care team according to the usual standard anesthetic protocols at the hospital, with no research-related change being introduced. The type of anesthesia used was: locoregional alone (n = 61/66.3%), which could be spinal block or epidural; or locoregional (spinal block or epidural) plus peripheral nerve block (n = 31/33.7%). ASA score was recorded including cases of ASA grade I (7/7.6%), II (67/72.8%), and III (18/19.6%).
Analgesic protocols
After surgery and prior to transfer of the patient to the infirmary, a standardized analgesia protocol was implemented according to the usual standard of care at the hospital. This was determined and supervised by the acute pain unit, and led by an anesthesiologist. Delivery of the analgesic protocol could be intravenous, epidural, or perineural, followed by oral analgesics on subsequent days.
The standardized intravenous protocol comprised a continuous infusion of tramadol 600 mg, metamizole 6 g, and metoclopramide 60 mg delivered by a balloon pump. The standardized epidural protocol consisted of a continuous infusion of ropivacaine 0.1% and fentanyl 3 μg/mL delivered by a balloon pump. The standardized perineural protocol included a continuous perineural infusion with ropivacaine 0.1% delivered by balloon pump. For all these protocols, paracetamol 1 g 6/6 h and a nonsteroidal anti-inflammatory drug (ketorolac 30 mg 12/12 h or parecoxib 40 mg 12/12 h) were included as adjuvant analgesics. All analgesic regimens included prokinetic treatment that was standardized to metoclopramide (10 mg intravenously 8/8 h). Further, all protocols allowed for use of rescue analgesia beyond the standardized ordinary analgesics in patients reporting moderate to severe acute post-surgical pain (NRS > 3).29–31
Statistical analysis
The sample size was determined using G*Power version 3.1.6.32 For this, we assumed a medium effect size (d = 0.5), a type I error (α) of 0.05, and 0.80 statistical power. With these assumptions, inclusion of 106 patients would be sufficient to obtain statistically significant results. Since this was a longitudinal study with three assessment time points (T1, T2, and T3), some patient mortality was expected, so the decision was taken to include 130 patients. The data were analyzed using Statistical Package for the Social Sciences version 19.0 software (SPSS Inc, Chicago, IL, USA). Internal consistency of responses to the questionnaires was assessed using Cronbach’s alpha14 (see earlier). Continuous variables are presented either as the median and range or as the mean and standard deviation, whereas categorical data are presented as the number and percentage. The primary outcome variable in this study was the report of any pain, regardless of its intensity, 4–6 months after arthroplasty and perceived by patients as being linked to the surgical procedure itself. Hence, for the purposes of this study, those reporting an NRS value >0 were counted as presenting PPSP. Accordingly, two groups were considered, ie, a group without pain (NRS = 0) and a group with pain (NRS > 0). To understand better the data concerning pain reports and to facilitate comparison with data from other studies, patients were classified further according to pain severity using guidelines published elsewhere.29–31 Thus, NRS values of 1–3 corresponded to mild pain levels, NRS values of 4–7 indicated moderate pain, and NRS values of ≥8 indicated severe pain. Distribution of the data differed significantly from normality assumptions, so Mann–Whitney (for continuous variables) or chi-square (χ2 for nominal variables) tests were used to compare sociodemographic, clinical, and psychologic measures between the TKA and THA groups. Two-sided tests were used for all comparisons, with P < 0.05 used to indicate statistical significance.
Results
Incidence and severity of PPSP after TKA and THA
Table 2 shows the incidence of pain 4–6 months after THA or TKA. Of the 48 THA patients, 32 (66.7%) reported pain, and of the 44 TKA patients, 39 (88.6%) reported pain, indicating that TKA patients had a greater likelihood of developing PPSP (P = 0.012). Table 2 also shows that, of the 32 patients reporting pain after THA, 18 (56.3%) perceived it on a daily basis, which did not differ significantly from the pain frequency patterns observed in the TKA group (P = 0.064). Concerning PPSP intensity, both worst and average pain levels were significantly higher for TKA patients than for THA patients (P = 0.008 and P = 0.003, respectively) on the NRS. Figures 2 and 3 further illustrate the frequency of pain levels in the two pain groups, indicating clearly that for both worst and average pain intensity, the two groups showed distinct trends and distribution. Further, Table 3 shows that, for worst pain levels, while in the THA sample there were no reports of severe pain, with a significant majority of patients reporting no or mild pain (72.9%), 56.8% of patients in the TKA sample complained of moderate to severe pain. Concerning average pain levels, Table 3 indicates that reports of severe pain ceased and the account of moderate pain levels also dropped sharply, from 27.1% (worst pain level) to 6.3% in the THA sample and from 50% (worst pain level) to 25% in the TKA sample. Accordingly, in terms of average pain, the majority of patients had mild levels of PPSP, both for THA (60.4%) and for TKA (63.6%, Table 3).
Table 2.
Characteristics and impact of pain 4–6 months after TKA and THA (n = 71)
| THA (n = 32)
|
TKA (n = 39)
|
P | |||||
|---|---|---|---|---|---|---|---|
| n (%) | Mean (SD) | Median (range) | n (%) | Mean (SD) | Median (range) | ||
| Pain report (PPSP)a | 32 (66.7%) | 39 (88.6%) | 0.012 | ||||
| Frequency | 0.064 | ||||||
| Daily | 18 (56.3%) | 30 (76.9%) | |||||
| Several times week | 8 (25.0%) | 4 (10.3%) | |||||
| Several times month | 6 (18.7%) | 5 (12.8%) | |||||
| Intensityb (NRS 0–10) | |||||||
| Worst level | 3.02 (1.60) | 3 (0.5–7) | 4.23 (1.91) | 4 (1–10) | 0.008 | ||
| Average level | 2.05 (1.12) | 2 (0.5–5) | 2.92 (1.20) | 3 (1–6) | 0.003 | ||
| DN4c descriptors | |||||||
| Burning | 2 (6.3%) | 5 (12.8%) | 0.446 | ||||
| Painful cold | 0 (0.0%) | 1 (2.6) | 1.000 | ||||
| Electric shocks | 1 (3.1%) | 7 (17.9%) | 0.065 | ||||
| Pins and needles | 17 (53.1%) | 22 (56.4%) | 0.782 | ||||
| Numbness | 10 (31.3%) | 30 (76.9%) | <0.001 | ||||
| Itching | 11 (34.4%) | 12 (30.8%) | 0.747 | ||||
| Tingling | 8 (25.0%) | 11 (28.2%) | 0.761 | ||||
| DN4c total score | 1.78 (1.60) | 1 (0–6) | 2.67 (1.56) | 2 (1–7) | 0.013 | ||
| DN4c total score ≥3 | 9 (28.1%) | 19 (43.2%) | 0.119 | ||||
| Total Pain interferenced | 8.63 (9.28) | 3 (0–28) | 13.4 (11.5) | 12 (0–50) | 0.100 | ||
| Pain interference (BPI-SF)d | 21 (65.6%) | 31 (70.5%) | 0.189 | ||||
| Subscales pain interferencee | |||||||
| General activity | 16 (50.0%) | 3.50 (0.82) | 4 (1–4) | 30 (68.2%) | 3.27 (1.66) | 3 (1–8) | 0.018 |
| Mood | 11 (34.4%) | 3.00 (1.26) | 3 (2–6) | 19 (43.2%) | 3.16 (1.80) | 3 (1–8) | 0.223 |
| Walking ability | 18 (56.2%) | 3.78 (1.40) | 4 (1–6) | 31 (70.5%) | 4.23 (1.80) | 4 (1–9) | 0.035 |
| Normal work | 16 (50.0%) | 3.63 (1.09) | 4 (1–5) | 30 (68.2%) | 3.33 (1.63) | 3 (1–8) | 0.018 |
| Relationships | 3 (9.3%) | 2.33 (1.53) | 2 (1–4) | 8 (18.2%) | 3.63 (1.19) | 3.5 (2–6) | 0.324 |
| Sleep | 10 (31.2%) | 2.90 (2.02) | 2 (1–7) | 14 (31.8%) | 3.64 (1.60) | 4 (1–6) | 0.680 |
| Enjoyment of life | 9 (28.1%) | 2.78 (1.30) | 3 (1–5) | 17 (38.6%) | 3.06 (1.56) | 3 (1–6) | 0.178 |
Notes: Continuous variables are presented both as mean (SD) and as median (range); categorical variables are presented as n (%). T3, 4–6 months after surgery;
patients reporting PPSP, defined as NRS >0;
NRS (BPI), NRS 0–10 from BPI;
DN4, Neuropathic Pain Questionnaire;
Pain Total Interference Scale 0–70 from BPI;
specific subscales of Pain Total Interference Scale 0–10 from BPI.
Abbreviations: BPI-SF, Brief Pain Inventory-short form; THA, total hip arthroplasty; TKA, total knee arthroplasty; NRS, numerical rating scale; PPSP, persistent post-surgical pain; SD, standard deviation.
Figure 2.
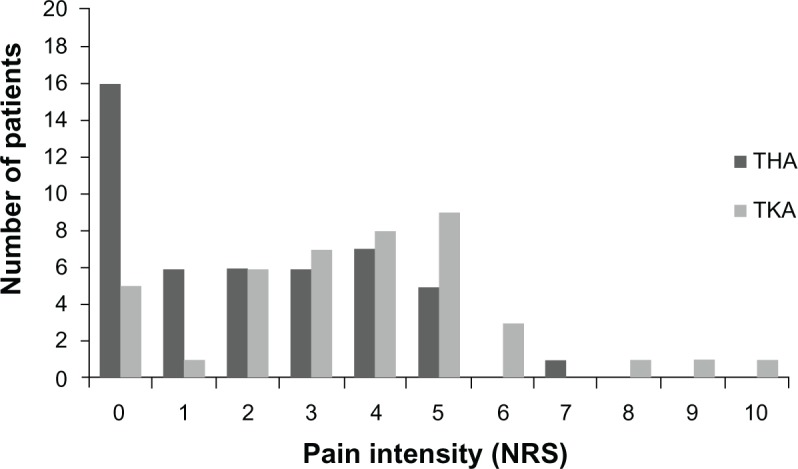
Comparison between THA and TKA on NRS (x-axis) of worst pain level 4–6 months after surgery (y-axis depicts number of patients reporting each score).
Abbreviations: THA, total hip arthroplasty; TKA, total knee arthroplasty; NRS, numerical rating scale.
Figure 3.
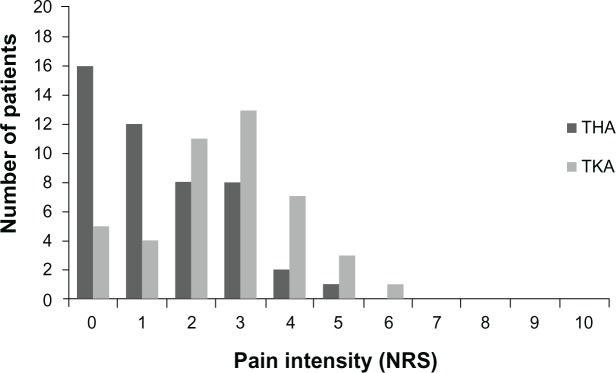
Comparison between THA and TKA on NRS (x-axis) of average pain level 4–6 months after surgery (y-axis depicts number of patients reporting each score).
Abbreviations: THA, total hip arthroplasty; TKA, total knee arthroplasty; NRS, numerical rating scale.
Table 3.
Distribution of patients across each pain severity group 4–6 months after THA and TKA (n = 92)
| PPSP groups (NRS 0–10) | Average level
|
Worst level
|
||
|---|---|---|---|---|
| THA (n = 48) | TKA (n = 44) | THA (n = 48) | TKA (n = 44) | |
| No pain (NRS, 0) | 16 (33.3%) | 5 (11.4%) | 16 (33.3%) | 5 (11.4%) |
| Mild pain (NRS, 1–3) | 29 (60.4%) | 28 (63.6%) | 19 (39.6%) | 14 (31.8%) |
| Moderate pain (NRS, 4–7) | 3 (6.3%) | 11 (25.0%) | 13 (27.1%) | 22 (50.0%) |
| Severe pain (NRS, 8–10) | 0 (0.00%) | 0 (0.00%) | 0 (0.00%) | 3 (6.8%) |
Note: Data are presented as n (%).
Abbreviations: NRS (BPI), Numerical Rating Scale 0–10 from Brief Pain Inventory; THA, total hip arthroplasty; TKA, total knee arthroplasty; PPSP, persistent post-surgical pain.
Descriptors of PPSP
Of the 32 THA patients reporting PPSP, seven did not identify their pain via any of the DN4 descriptors, 10 reported one descriptor, and six reported two descriptors. Thus, following the cutoff point of ≥3, which indicates the potential neuropathic character of pain,14,15 23 (71.9%) patients did not show any pain with neuropathic features (DN4 < 3) and nine patients (28.1%) presented pain with neuropathic characteristics (DN4 ≥ 3). Five patients chose three descriptors, one patient chose four, two patients chose five, one patient chose six, and none selected all seven descriptors; the mean score was 1.78 and the median was 1. On the other hand, all 39 TKA patients with PPSP chose at least one of the DN4 descriptors to characterize their pain. Eleven patients chose one descriptor and ten patients chose two descriptors. Hence, following the cutoff point of ≥3, 18 patients (46.2%) presented pain with a potentially neuropathic character (DN4 ≥ 3). In this group, seven patients selected three descriptors, six patients selected four, three patients selected five, one patient selected six, and one patient selected all seven descriptors; the mean score was 2.67 and the median was 2. Concerning the total number of pain descriptors chosen, TKA patients chose significantly more descriptors than THA patients (P = 0.013), but did not show a higher likelihood of reporting PPSP with neuropathic features (P = 0.119). Moreover, concerning the frequency of use of each descriptor, numbness was the only descriptor for which the arthroplasty subgroups differed significantly (P < 0.001), with TKA patients characterizing PPSP with this descriptor more often (Table 2).
Impact of PPSP interference
Not all patients reporting PPSP indicated interference from pain. Sixty-five percent of THA patients and 70.5% of TKA patients complained of some type of interference from pain, but this difference was not statistically significant between the two groups (Table 2). Within these figures, Table 2 specifies the life domains wherein PPSP exerted some type of interference. General activity, walking ability, and normal work were described by both arthroplasty groups as being the main life domains affected by pain, although such interference was significantly higher for TKA patients (P = 0.018, P = 0.035, and P = 0.018, respectively). For other areas, ie, mood, relationships, sleep, and enjoyment of life, some interference from pain was still reported, although by less than half of patients in each sample and not yielding significant differences between the two arthroplasty groups.
In sum, regarding PPSP after THA and TKA, 66.7% and 88.6% of patients, respectively, reported pain of any intensity (NRS > 0) 4–6 months after having undergone the surgical procedure. When further examining potential differences between the two arthroplasty groups, the data showed that, when compared with THA patients, TKA patients showed a higher likelihood of developing PPSP, as well as of reporting higher pain levels and used more neuropathic descriptors when classifying their pain, ie, numbness, albeit not having a higher odds of revealing a definitive neuropathic type of pain. In addition, TKA patients referred more often to pain interference on domains such as general activity, walking ability, and normal work.
Sociodemographic, clinical, and psychologic measures
At T1, and regarding baseline measures, the arthroplasty groups did not differ on any sociodemographic measure, except for age and gender. As shown in Table 4, patients undergoing TKA were older than those undergoing THA (P = 0.018), and included more women than men (P = 0.033). Both groups were similar concerning clinical measures like body mass index and previous surgical procedures; however, TKA patients reported a longer duration of surgical disease (P = 0.019) and had more medical comorbidities (P = 0.040). Although the groups did not differ in terms of presurgical pain intensity or total presurgical pain interference levels with regard to activities of daily living, TKA patients reported presurgical pain of longer duration (P = 0.009). Further, TKA patients reported pain due to other causes more often (P = 0.009) and pain in other joints (P = 0.023, Table 4).
Table 4.
Differences between patients submitted to THA and TKA on sociodemographic, clinical, and psychologic measures determined at T1, T2, and T3
| Measures | THA (n = 48)
|
TKA (n = 44)
|
P | ||||
|---|---|---|---|---|---|---|---|
| n (%) | Mean (SD) | Median (range) | n (%) | Mean (SD) | Median (range) | ||
| T1 | |||||||
| Demographic | |||||||
| Age (years) | 62.0 (8.05) | 62 (43–77) | 66.2 (7.10) | 66 (54–78) | 0.018 | ||
| Gender (women) | 27 (56.3) | 34 (77.3) | 0.033 | ||||
| Clinical (general indicators) | |||||||
| Disease onset (months) | 81.9 (75.8) | 54 (6–300) | 142 (140) | 120 (14–600) | 0.019 | ||
| BMI (kg/m2) | 28.9 (4.39) | 29 (21–40) | 29.8 (4.95) | 29 (20–40) | 0.713 | ||
| Previous surgeries | 40 (83.3) | 40 (90.9) | 0.281 | ||||
| Comorbidities total* | 1.92 (1.32) | 2 (0–5) | 2.41 (1.11) | 3 (0–4) | 0.040 | ||
| Clinical (presurgical pain indicators) | |||||||
| Intensity† (worst) | 6.91 (2.06) | 7.00 (3–10) | 6.82 (1.82) | 7 (4–10) | 0.855 | ||
| Intensity† (average) | 4.47 (1.08) | 5.00 (3–7) | 4.50 (1.41) | 4 (2–8) | 0.898 | ||
| Pain intensity‡ (0–70) | 26.9 (12.8) | 29 (7–49) | 27.7 (11.8) | 28 (3–50) | 0.882 | ||
| Pain other causes | 24 (51.1) | 34 (77.3) | 0.009 | ||||
| Pain in other joints | 12 (25.0) | 21 (47.7) | 0.023 | ||||
| Back pain | 20 (41.7) | 25 (56.8) | 0.146 | ||||
| Psychologic variables | |||||||
| Anxietya | 4.75 (3.89) | 4 (0–16) | 5.66 (4.06) | 5.5 (0–17) | 0.228 | ||
| Depressiona | 2.46 (3.31) | 1.5 (0–17) | 2.34 (3.03) | 1 (0–11) | 0.864 | ||
| Timeline acute/chronicb | 8.17 (2.70) | 6 (6–15) | 8.61 (2.95) | 9 (4–15) | 0.465 | ||
| Timeline cyclicb | 9.06 (2.44) | 9 (4–13) | 8.89 (2.46) | 9 (4–15) | 0.572 | ||
| Consequencesb | 10.3 (2.42) | 11 (5–15) | 10.3 (2.28) | 10 (5–14) | 0.794 | ||
| Personal controlb | 6.00 (1.52) | 6 (4–12) | 7.05 (2.54) | 6 (4–12) | 0.081 | ||
| Treatment controlb | 11.8 (1.25) | 12 (9–15) | 12.2 (0.92) | 12 (9–15) | 0.177 | ||
| Illness coherenceb | 8.38 (3.43) | 7.5 (3–14) | 6.89 (2.54) | 6 (3–13) | 0.037 | ||
| Emotional representationb | 9.00 (3.22) | 10 (3–15) | 9.80 (2.99) | 10 (3–15) | 0.217 | ||
| Pain catastrophizingc | 10.1 (5.69) | 6 (6–27) | 11.1 (6.20) | 8 (6–29) | 0.390 | ||
| Functionalityd | 48.4 (14.6) | 51 (20–74) | 47.0 (14.1) | 48 (13–71) | 0.579 | ||
| T2 | |||||||
| Intensity† (worst) | 5.90 (2.62) | 6 (0–10) | 7.16 (2.23) | 8 (3–10) | 0.023 | ||
| Intensity† (average) | 3.39 (1.46) | 3.25 (0–6) | 4.19 (1.37) | 4 (1–6) | 0.014 | ||
| Rescue analgesia | 16 (33.3) | 23 (52.3) | 0.066 | ||||
| Anxietya | 3.35 (3.40) | 3 (0–16) | 3.82 (3.55) | 3.5 (0–14) | 0.556 | ||
| Length of hospital stay | 6.77 (1.81) | 7 (4–14) | 7.28 (3.45) | 7 (4–27) | 0.825 | ||
| T3 | |||||||
| Anxietya | 3.26 (3.27) | 3 (0–11) | 4.91 (4.42) | 4.5 (0–17) | 0.081 | ||
| Depressiona | 1.44 (2.31) | 1 (0–12) | 2.91 (3.76) | 1 (0–13) | 0.102 | ||
| Functionalityd | 28.5 (15.4) | 29 (0–65) | 38.5 (16.0) | 38 (0–77) | 0.003 | ||
Notes: Continuous variables are presented both as mean (SD) and as median (range); categorical variables are presented as n (%). T1, 24 hours before surgery; T2, 48 hours after surgery; T3, 4–6 months after surgery;
comorbidities total, number of comorbid health conditions;
NRS (BPI), Numerical Rating Scale 0–10 from Brief Pain Inventory;
Pain Total Interference Scale 0–70 from Brief Pain Inventory (BPI);
HADS, Hospital Anxiety and Depression Scale;
IPQ-R, Illness Perception Questionnaire-Revised;
CSQ-R, Coping Strategies Questionnaire-Revised;
SIP, Sickness Impact Profile.
Abbreviations: BMI, body mass index; SD, standard deviation; TKA, total knee arthroplasty; THA, total hip arthroplasty.
The two arthroplasty groups did not differ regarding baseline psychologic measures, with the exception of illness coherence concerning the surgical disease, which was lower in THA patients (P = 0.037, Table 4), ie, the illness made less sense for the THA group than for the TKA group. Moreover, at T2 (48 hours after surgery) and T3 (4–6 months after arthroplasty), the groups did not show any significant difference with regard to psychologic factors. The lack of presurgical baseline differences occurred also on functionality levels, with the two surgical groups showing similar functional status before surgery, albeit not at 4–6 months after surgery, wherein TKA patients showed the worst functionality levels (P = 0.003). In conclusion, at baseline, the groups were homogeneous for psychologic profile and functionality issues. This homogeneity was maintained at T2 and T3 for psychologic issues but not for functionality.
Finally, Table 4 also shows that, in the immediate period after surgery, TKA patients had heightened intensity of acute post-surgical pain, both in terms of average (P < 0.001) and worst (P < 0.001) pain. In addition, in terms of type of anesthesia and analgesia, patients in the TKA group were administered drugs via the perineural route more often. No other distinction in clinical parameters was found between the groups 48 hours after surgery (eg, length of stay, rescue analgesia, or pain frequency).
Discussion
The present study aimed to increase knowledge on PPSP after arthroplasty by comparing the incidence, nature, and impact of PPSP with regard to the most widely performed two types of arthroplasties ie, THA and TKA. Our data show that TKA patients have a higher likelihood of developing PPSP, of reporting higher pain levels, and of using more neuropathic descriptors when classifying their pain. In addition, TKA patients referred more often to pain interference on general activity, walking ability, and normal work. The data also show that demographic factors such as gender and age, along with some presurgical clinical factors like disease onset, existence of medical comorbidities, and other pain problems, may contribute to these differences, whereas baseline psychologic factors and functionality levels do not seem to exert an influence.
Prevalence of pain after THA and TKA
In this study, 66.7% of THA patients and 88.6% of TKA patients reported PPSP 4–6 months after surgery. However, these figures must be interpreted with caution in terms of pain severity, frequency, its interference in daily life, and the relatively short period of time elapsed since surgery. Accordingly, with regard to the data concerning average pain ratings, no patient reported severe pain, and 6.3% of THA patients and 25% of TKA patients showed average moderate pain levels. Thus, despite the high prevalence of PPSP, most cases were mild in severity. These results are difficult to compare with other studies because most of the relevant research focuses on pain improvement values rather than on the percentage of patients reporting pain or on absolute pain levels.1 Further, follow-up assessment varies across the studies. Studies with a timeframe similar to ours33–37 either report PPSP figures differently or approach THA and TKA jointly, without exploring potential differences between these procedures. However, when this distinction is taken into account, the findings show unequivocally that the prevalence of PPSP is higher with TKA than with THA,1,34,38 which is in accordance with our present findings. Another aspect also precluding comparisons is that most arthroplasty studies use osteoarthritis-specific instruments, such as the Western Ontario and McMaster Universities Arthritis Index,39,40 rather than generic measures of pain.41 A potentially comparable study,6 albeit focused only on TKA but using a 0–100 visual analog scale (VAS) for pain comparable with our 0–10 NRS, reported that 22.6% and 18.4% of patients, respectively, had a VAS > 40 at 3 and 6 months after surgery. However, the authors did not clarify whether they had assessed pain at its worst, on average, on movement, or at rest. Thus, these figures are difficult to compare with our present findings, ie, 4–6 months after surgery, an NRS > 4 was reported by 9.1% (n = 4; average pain level) and 34% (n = 15; worst pain level) of TKA patients. The wide variation in outcome measures across studies hinders the comparability and interpretability of findings, and calls for consensus on development and application of homogeneous outcome measures and methods of analysis.11,42
Differential impact and nature of PPSP after THA and TKA
Concerning the interference of PPSP in daily life, the most domains affected were general activity, walking ability, and normal work, and were also those wherein TKA patients revealed more interference compared with THA patients. It is understandable that these domains are more affected than areas such as mood or sleep, given that major orthopedic joint surgeries concern precisely the body areas responsible for movement, particularly for the knee. Despite these differences in PPSP, the groups showed similar anxiety and depression levels 4–6 months after surgery. Although no study has compared the two types of surgery in terms of mediumterm emotional state, several have centered on comparison of quality of life or global functionality. As in our study, those studies mostly found worse functional levels in TKA patients, with a pattern of slower recovery when compared with THA patients.1,34,36
Neuropathic pain is common after surgical procedures such as herniorrhaphy,19 thoracotomy,43 and mastectomy.18 Given the paucity of studies exploring potential neuropathic pain characteristics after THA and TKA, we further characterized PPSP using the DN4 questionnaire. TKA patients chose the word “numbness” to describe their pain more frequently, with no further distinction on any other descriptor between the groups. Although TKA patients chose more descriptors to characterize their pain, they did not have higher odds of reporting neuropathic pain (DN4 ≥ 3) when compared with THA patients. Previous studies focusing on PPSP after arthroplasty did not include an examination of neuropathic PPSP features1,33 or did not use the DN4, but rather used the PainDETECT4 or McGill6,44 questionnaires, with the latter more aimed at the study of general pain qualities. Concerning use of the DN4, we are aware of a study in which 12.7% of TKA patients had DN4 ≥ 3,45 which is substantially lower than the data from our study showing that 43.2% of TKA patients had a DN4 score ≥ 3.
It has been suggested that the underlying mechanisms of PPSP after arthroplasty vary according to surgical site.46 Previous features of pain sensitization in patients with osteoarthritis of the knee, along with presurgical neuropathic pain-specific characteristics, could be linked to the worst post-surgical scenario for TKA in comparison with THA.46 Further, other studies47–49 report that administration of second-generation antiepileptic drugs (eg, pregabalin and gabapentin) reduces neuropathic pain 6 months after TKA but not after THA. Hence, future studies should evaluate not only the potential neuropathic features of PPSP but also presurgical pain.
Differences between THA and TKA samples before and after surgery
We also examined patient demographic, clinical, and psychologic characteristics at baseline, looking for similarities and differences between the two surgical groups that could explain the differences in surgical outcome. The question was if the different PPSP outcomes could be related to distinct specificities of each surgical procedure,8 or if they could be better explained by any distinctive baseline feature, eg, gender, which has been associated with higher odds of PPSP after orthopedic surgery.8,50,51 The present data show that there are more women undergoing TKA than THA. Gender may thus be a confounding variable in the drawing of conclusions concerning the higher prevalence of PPSP among TKA patients when compared with THA patients. The same may be true of age, given that TKA patients were older than THA patients. Along these lines, McGuigan et al52 hypothesized that the better surgical outcomes for THA than for TKA could be due to demographic differences. Further, in the present study, in addition to being older and more likely to be female, TKA patients had a longer history of surgical disease (ie, osteoarthritis), more comorbidity, and more pain from other causes. Another study also showed that TKA patients were older and had a longer duration of disease than THA patients.1 Overall, these results suggest that such presurgical differences between THA and TKA patients may influence the distinct prevalence of PPSP among them, underlining the importance of taking demographic and clinical variables into account when reporting follow-up data after arthroplasty.52
Our current findings indicate that TKA patients had more pain in the acute post-surgical period. We are aware of only one study targeting acute pain after TKA and THA,53 but without comparing them directly, and only focusing on descriptive analyses and assessing pain at rest. Acute post-surgical pain has been identified as a predictor of PPSP after various surgical procedures.54–58 With regard to arthroplasty, we are aware of only two studies59,60 wherein post-surgical pain predicted PPSP after THA and TKA, although that assessment was retrospective and recalled one year after surgery. Most arthroplasty studies have shown a stronger predictive value of presurgical pain in prediction of PPSP when compared with acute post-surgical pain.2,6,61,62 Therefore, given the limited evidence for an association between acute post-surgical pain intensity and PPSP after major arthroplasty, it might be hypothesized that differences in PPSP between THA and TKA do not result from differences in acute pain levels. However, future studies should examine this hypothesis further.
Another important issue in the present study concerns the potential influence of psychologic factors on the different results for PPSP after TKA and THA.41 Several psychosocial variables are known to influence osteoarthritis pain and disability,63 and it has been suggested that differences in PPSP after TKA and THA could originate from psychosocial sources with different impacts on poor hip or knee function.8 However, the present data does not confirm this hypothesis, showing unequivocally that the two samples show similar psychologic profiles in terms of emotional state, illness perception, and pain coping strategies (pain catastrophizing) and also similar presurgical functionality levels. A previous study1 comparing TKA and THA, albeit using different presurgical questionnaires (Western Ontario and McMaster Universities Arthritis Index, Medical Outcome Study 36-Item Short Form Health Survey) also found similar figures between the two groups for psychologic, physical, and social presurgical factors.
Limitations of the study
This study has some limitations that should be considered when interpreting its findings. Regarding external validity, the generalizability of the results is limited by this being a single-site and single-country study, with small samples. Future epidemiologic studies with larger samples should be undertaken. Another issue is that the small samples, along with the discrepancy in gender proportions, ie, the low number of men with TKA (n = 10), substantially reduced the tests’ statistical power for the correction of gender influence. Therefore, we chose not to correct for gender in the statistical analyses or in the interpretation of our results. Future studies should examine gender differences further and the effect of the interaction between surgical group and gender, specifically with regard to psychologic outcomes, such as anxiety and pain catastrophizing, for which gender differences are well documented.64,65
It is also important to underline that the lack of reporting of analgesic consumption stems from the fact that the study patients often had other joint comorbidities for which they were medicated, thus precluding us from rigorously recording analgesic use linked specifically to the research question.
Another potential limitation concerning internal validity is that 32 patients were lost to follow-up between T2 and T3. However, additional analyses did not reveal significant differences between these and the remaining 92 patients, either in terms of baseline characteristics (T1) or post-surgical issues (T2).
It should be recognized that the 4–6-month assessment point for PPSP analyses might introduce some bias in PPSP prevalence, and it is possible that any difference in PPSP outcome could occur during the 4–6-month period. This is relevant because THA patients achieve their most significant improvements within the first 3 months after surgery,66 whereas TKA patients are likely to show improvement later, ie, between 3 and 6 months.67,68 However, improvement can still be observed up to 12 months after these types of surgery.69,70
Conclusion
In conclusion, we have confirmed a higher prevalence of PPSP in TKA patients when compared with THA patients, and given a detailed description of pain after each surgical procedure. Moreover, certain demographic and presurgical clinical characteristics may be important in these differences, whereas psychologic factors do not seem to exert influence. Future prospective studies should include TKA and THA patient groups that are homogeneous with regard to demographic and presurgical clinical characteristics. Overall, these findings contribute to a small but growing body of literature documenting PPSP after major arthroplasty, conducted in different countries, across different health care settings.
Acknowledgments
This work was supported by a project grant (PTDC/SAU-NEU/108557/2008) from the Portuguese Foundation of Science and Technology, COMPETE (Thematic Operational Programme for Competitive Factors), and FEDER (European Fund for Regional Development). We also thank the patients who agreed to participate in this study.
Footnotes
Disclosure
The authors report no conflicts of interest in this work.
References
- 1.Bachmeier CJM, March LM, Cross MJ, et al. Arthritis Cost and Outcome Project Group A comparison of outcomes in osteoarthritis patients undergoing total hip and knee replacement surgery. Osteoarthritis Cartilage. 2001;9:137–146. doi: 10.1053/joca.2000.0369. [DOI] [PubMed] [Google Scholar]
- 2.Lingard EA, Katz JN, Wright EA, Sledge CB. Predicting the outcome of total knee arthroplasty. J Bone Joint Surg Am. 2004;86:2179–2186. doi: 10.2106/00004623-200410000-00008. [DOI] [PubMed] [Google Scholar]
- 3.Hamel MB, Toth M, Legedza A, Rosen MP. Joint replacement surgery in elderly patients with severe osteoarthritis of the hip or knee. Arch Intern Med. 2008;168:1430–1440. doi: 10.1001/archinte.168.13.1430. [DOI] [PubMed] [Google Scholar]
- 4.Wylde V, Hewlett S, Learmonth ID, Dieppe P. Persistent pain after joint replacement: prevalence, sensory qualities, and postoperative determinants. Pain. 2011;152:566–572. doi: 10.1016/j.pain.2010.11.023. [DOI] [PubMed] [Google Scholar]
- 5.Rasanen P, Paavolainen P, Sintonen H, et al. Effectiveness of hip or knee replacement surgery in terms of quality-adjusted life years and costs. Acta Orthop. 2007;78:108–115. doi: 10.1080/17453670610013501. [DOI] [PubMed] [Google Scholar]
- 6.Brander VA, Stulberg SD, Adams AD, et al. Predicting total knee replacement pain – a prospective, observational study. Clin Orthop Relat Res. 2003;416:27–36. doi: 10.1097/01.blo.0000092983.12414.e9. [DOI] [PubMed] [Google Scholar]
- 7.Woolhead GM, Donovan JL, Dieppe PA. Outcomes of total knee replacement: a qualitative study. Rheumatology. 2005;44:1032–1037. doi: 10.1093/rheumatology/keh674. [DOI] [PubMed] [Google Scholar]
- 8.Wylde V, Dieppe P, Hewlett S, Learmonth ID. Total knee replacement: is it really an effective procedure for all? Knee. 2007;14:417–423. doi: 10.1016/j.knee.2007.06.001. [DOI] [PubMed] [Google Scholar]
- 9.Perkins F, Gopal A. Postsurgical chronic pain: a model for investigating the origins of chronic pain. Tech Reg Anesth Pain Manag. 2003;7:122–126. [Google Scholar]
- 10.Kehlet H, Jensen TS, Woolf C. Persistent postsurgical pain: risk factors and prevention. Lancet. 2006;367:1618–1625. doi: 10.1016/S0140-6736(06)68700-X. [DOI] [PubMed] [Google Scholar]
- 11.Beswick AD, Wylde V, Gooberman-Hill R, Blom A, Dieppe P. What proportion of patients report long-term pain after total hip or knee replacement for osteoarthritis? A systematic review of prospective studies in unselected patients. BMJ Open. 2012;2:e000435. doi: 10.1136/bmjopen-2011-000435. [DOI] [PMC free article] [PubMed] [Google Scholar]
- 12.Charlson ME, Pompei P, Ales KL, MacKenzie CR. A new method of classifying prognostic comorbidity in longitudinal studies: development and validation. J Chronic Dis. 1987;40:373–383. doi: 10.1016/0021-9681(87)90171-8. [DOI] [PubMed] [Google Scholar]
- 13.Cleeland C, Ryan KM. Pain assessment: global use of the Brief Pain Inventory. Ann Acad Med. 1994;23:129–138. [PubMed] [Google Scholar]
- 14.Cronbach LJ. Coefficient alpha and the internal structure of tests. Psychometrika. 1951;16:297–334. [Google Scholar]
- 15.Bouhassira D, Attal N, Alchaar H, et al. Comparison of pain syndromes associated with nervous or somatic lesions and development of a new neuropathic pain diagnosis questionnaire (DN4) Pain. 2005;114:29–36. doi: 10.1016/j.pain.2004.12.010. [DOI] [PubMed] [Google Scholar]
- 16.Bouhassira D, Lantéri-Minet M, Attal N, Laurent B, Touboul C. Prevalence of chronic pain with neuropathic characteristics in the general population. Pain. 2008;136:380–387. doi: 10.1016/j.pain.2007.08.013. [DOI] [PubMed] [Google Scholar]
- 17.Bruce J, Drury N, Poobalan AS, Jeffrey RR, Smith WC, Chambers WA. The prevalence of chronic chest and leg pain following cardiac surgery: a historical cohort study. Pain. 2003;104:265–273. doi: 10.1016/s0304-3959(03)00017-4. [DOI] [PubMed] [Google Scholar]
- 18.Jung BF, Gretchen MA, Oaklander AL, Dworkin RW. Neuropathic pain following breast cancer surgery: proposed classification and research update. Pain. 2003;104:1–13. doi: 10.1016/s0304-3959(03)00241-0. [DOI] [PubMed] [Google Scholar]
- 19.Poobalan AS, Bruce J, King PM, Chambers WA, Krukowski ZH, Smith WC. Chronic pain and quality of life following open inguinal hernia repair. Br J Surg. 2001;88:1122–1126. doi: 10.1046/j.0007-1323.2001.01828.x. [DOI] [PubMed] [Google Scholar]
- 20.Pinto PR, McIntyre T, Nogueira-Silva C, Almeida A, Araújo-Soares V. Risk factors for persistent post-surgical pain in women undergoing hysterectomy due to benign causes: a prospective predictive study. J Pain. 2012;13:1045–1057. doi: 10.1016/j.jpain.2012.07.014. [DOI] [PubMed] [Google Scholar]
- 21.Zigmond AS, Snaith RP. The Hospital Anxiety and Depression Scale. Acta Psychiatr Scand. 1983;67:361–370. doi: 10.1111/j.1600-0447.1983.tb09716.x. [DOI] [PubMed] [Google Scholar]
- 22.Moss-Morris R, Weinman J, Petrie KJ, et al. The Revised Illness Perception Questionnaire (IPQ-R) Psychol Health. 2002;17:1–16. [Google Scholar]
- 23.Sniehotta FF, Gorski C, Araujo-Soares V. Adoption of community-based cardiac rehabilitation programs and physical activity following phase III cardiac rehabilitation in Scotland: a prospective and predictive study. Psychol Health. 2010;25:839–854. doi: 10.1080/08870440902915915. [DOI] [PubMed] [Google Scholar]
- 24.Riley JL, Robinson ME. CSQ: five factors or fiction? Clin J Pain. 1997;13:156–162. doi: 10.1097/00002508-199706000-00010. [DOI] [PubMed] [Google Scholar]
- 25.Pinto P, McIntyre T, Almeida A, Araújo-Soares V. The mediating role of pain catastrophizing in the relationship between presurgical anxiety and acute postsurgical pain after hysterectomy. Pain. 2012;153:218–226. doi: 10.1016/j.pain.2011.10.020. [DOI] [PubMed] [Google Scholar]
- 26.Pinto PR, McIntyre T, Fonseca C, Almeida A, Araújo-Soares V. Pre and post-surgical factors that predict the provision of rescue analgesia following hysterectomy. Eur J Pain. 2013;17:423–433. doi: 10.1002/j.1532-2149.2012.00205.x. [DOI] [PubMed] [Google Scholar]
- 27.Ulmer JF. An exploratory study of pain, coping, and depressed mood following burn injury. J Pain Symptom Manage. 1997;13:148–157. doi: 10.1016/s0885-3924(96)00301-6. [DOI] [PubMed] [Google Scholar]
- 28.Pollard B, Johnston M. Problems with the sickness impact profile: a theoretically based analysis and a proposal for a new method of implementation and scoring. Soc Sci Med. 2001;52:921–934. doi: 10.1016/s0277-9536(00)00194-5. [DOI] [PubMed] [Google Scholar]
- 29.Dihle A, Helseth S, Paul SM, Miaskowski C. The exploration of the establishment of cutpoints to categorize the severity of acute postoperative pain. Clin J Pain. 2006;22:617–624. doi: 10.1097/01.ajp.0000210905.57546.c1. [DOI] [PubMed] [Google Scholar]
- 30.Hartrick CT, Kovan JP, Shapiro S. The numeric rating scale for clinical pain measurement: a ratio measure? Pain Pract. 2003;3:310–316. doi: 10.1111/j.1530-7085.2003.03034.x. [DOI] [PubMed] [Google Scholar]
- 31.Dolin SJ, Cashman JN, Bland JM. Effectiveness of acute postoperative pain management: I. Evidence from published data. Br J Anaesth. 2002;89:409–423. [PubMed] [Google Scholar]
- 32.Erdfelder E, Faul F, Buchner A. GPOWER: a general power analysis program. Behav Res Methods Instrum Comput. 1996;28:1–11. [Google Scholar]
- 33.MacWilliam CH, Yood MU, Verner JJ, McCarthy BD, Ward RE. Patient-related risk factors that predict poor outcome after total hip replacement. Health Serv Res. 1996;31:623–638. [PMC free article] [PubMed] [Google Scholar]
- 34.Salmon P, Hall G, Peerbhoy D, Parker C. Recovery from hip and knee arthroplasty: patients’ perspective on pain, function, quality of life, and well-being up to 6 months postoperatively. Arch Phys Med Rehabil. 2001;82:360–366. doi: 10.1053/apmr.2001.21522. [DOI] [PubMed] [Google Scholar]
- 35.Ayers DC, Franklin PD, Trief PM, Ploutz-Snyder R, Freund D. Psychological attributes of preoperative total joint replacement patients. Implications for optimal physical outcome. J Arthroplasty. 2004;19:125–130. doi: 10.1016/j.arth.2004.06.019. [DOI] [PubMed] [Google Scholar]
- 36.Ethgen O, Bruyère O, Richi F, Dardenness C, Reginster JY. Health-related quality of life in total hip and total knee arthroplasty. A qualitative and systematic review of the literature. J Bone Joint Surg Am. 2004;86A:963–974. doi: 10.2106/00004623-200405000-00012. [DOI] [PubMed] [Google Scholar]
- 37.Quintana JM, Escobar A, Arostegui I, et al. Health-related quality of life and appropriateness of knee or hip joint replacement. Arch Intern Med. 2006;166:220–226. doi: 10.1001/archinte.166.2.220. [DOI] [PubMed] [Google Scholar]
- 38.Linsell L, Dawson J, Zondervan K, et al. Pain and overall health status in older people with hip and knee replacement: a population perspective. J Public Health. 2006;28:267–273. doi: 10.1093/pubmed/fdl020. [DOI] [PubMed] [Google Scholar]
- 39.Sullivan M, Tanzer M, Stanish W, et al. Psychological determinants of problematic outcomes following total knee arthroplasty. Pain. 2009;143:123–129. doi: 10.1016/j.pain.2009.02.011. [DOI] [PubMed] [Google Scholar]
- 40.Riddle DL, Wade JB, Jiranek WA, Kong X. Preoperative pain catastrophizing predicts pain outcome after knee arthroplasty. Clin Orthop Relat Res. 2010;468:798–806. doi: 10.1007/s11999-009-0963-y. [DOI] [PMC free article] [PubMed] [Google Scholar]
- 41.Vissers MM, Bussmann JB, Verhaar JA, Busschbach JJ, Bierma-Zeinstra SM, Reijman M. Psychological factors affecting the outcome of total hip and knee arthroplasty: a systematic review. Semin Arthritis Rheum. 2012;41:576–588. doi: 10.1016/j.semarthrit.2011.07.003. [DOI] [PubMed] [Google Scholar]
- 42.Riddle DL, Stratford PW, Bowman DH. Findings of extensive variation in the types of outcome measures used in hip and knee replacement clinical trials: a systematic review. Arthritis Care Res. 2008;59:876–883. doi: 10.1002/art.23706. [DOI] [PubMed] [Google Scholar]
- 43.Gotoda Y, Kambara N, Sakai T, Kishi Y, Kodama K, Koyama T. The morbidity, time course and predictive factors for persistent postthoracotomy pain. Eur J Pain. 2001;5:89–96. doi: 10.1053/eujp.2001.0225. [DOI] [PubMed] [Google Scholar]
- 44.Forsythe ME, Dunbar MJ, Hennigar AW, Sullivan M, Gross M. Prospective relation between catastrophizing and residual pain following knee arthroplasty; two-year follow-up. Pain Res Manag. 2008;13:335–341. doi: 10.1155/2008/730951. [DOI] [PMC free article] [PubMed] [Google Scholar]
- 45.Wattier JM, Tiffreau V, Levisse C, et al. Neuropathic pain after knee arthroplasty. J Bone Joint Surg Br. 2011;93B(Suppl IV):518. [Google Scholar]
- 46.Dowsey MM, Choong PF.Predictors of pain and function following total joint replacement Available from: http://cdn.intechopen.com/pdfs/42805/InTech-Predictors_of_pain_and_function_following_total_joint_replacement.pdfAccessed June 20, 2013
- 47.Buvanendran A, Kroin JS, Valle CJ, Kari M, Moric M, Tuman KJ. Perioperative oral pregabalin reduces chronic pain after total knee arthroplasty: a prospective, randomized, controlled trial. Anesth Analg. 2010;110:199–207. doi: 10.1213/ANE.0b013e3181c4273a. [DOI] [PubMed] [Google Scholar]
- 48.Clarke H, Pereira S, Kennedy D, et al. Adding gabapentin to a multimodal regimen does not reduce acute pain, opioid consumption or chronic pain after total hip arthroplasty. Acta Anaesthesiol Scand. 2009;53:1073–1083. doi: 10.1111/j.1399-6576.2009.02039.x. [DOI] [PubMed] [Google Scholar]
- 49.Clarke H, Pereira S, Kennedy D, et al. Gabapentin decreases morphine consumption and improves functional recovery following total knee arthroplasty. Pain Res Manag. 2009;14:217–222. doi: 10.1155/2009/930609. [DOI] [PMC free article] [PubMed] [Google Scholar]
- 50.Rosseland LA, Solheim N, Stubaugh A. Pain and disability 1 year after knee arthroscopic procedures. Acta Anaesthesiol Scand. 2008;52:332–337. doi: 10.1111/j.1399-6576.2007.01541.x. [DOI] [PubMed] [Google Scholar]
- 51.Valdes AM, Doherty SA, Zhang W, Muir KR, Maciewicz RA, Doherty M. Inverse relationship between preoperative radiographic severity and postoperative pain in patients with osteoarthritis who have undergone total joint arthroplasty. Semin Arthritis Rheum. 2012;41:568–575. doi: 10.1016/j.semarthrit.2011.07.002. [DOI] [PubMed] [Google Scholar]
- 52.McGuigan FX, Hozack WJ, Moriarty L, Eng K, Rothman RH. Predicting quality-of-life outcomes following total joint arthroplasty. Limitations of the SF-36 Health Status Questionnaire. J Arthroplasty. 1995;10:742–747. doi: 10.1016/s0883-5403(05)80069-5. [DOI] [PubMed] [Google Scholar]
- 53.Wylde V, Rooker J, Halliday L, Blom A. Acute postoperative pain at rest after hip and knee arthroplasty: severity, sensory qualities and impact on sleep. Orthop Traumatol Surg Res. 2011;97:139–144. doi: 10.1016/j.otsr.2010.12.003. [DOI] [PubMed] [Google Scholar]
- 54.Hanley MA, Jensen MP, Smith DG, Ehde DM, Edwards WT, Robinson LR. Preamputation pain and acute pain predict chronic pain after lower extremity amputation. J Pain. 2007;8:102–109. doi: 10.1016/j.jpain.2006.06.004. [DOI] [PubMed] [Google Scholar]
- 55.Bisgaard T, Rosenberg J, Kehlet H. From acute to chronic pain after laparoscopic cholecystectomy. A prospective follow-up analysis. Scand J Gastroenterol. 2005;40:1358–1364. doi: 10.1080/00365520510023675. [DOI] [PubMed] [Google Scholar]
- 56.Eisenach JC, Pan PH, Smiley R, Lavand’homme P, Landau R, Houle TT. Severity of acute pain after childbirth, but not type of delivery, predicts persistent pain and postpartum depression. Pain. 2008;140:87–94. doi: 10.1016/j.pain.2008.07.011. [DOI] [PMC free article] [PubMed] [Google Scholar]
- 57.Peters ML, Sommer M, Rijke JM, et al. Somatic and psychologic predictors of long-term unfavourable outcome after surgical intervention. Ann Surg. 2007;245:487–494. doi: 10.1097/01.sla.0000245495.79781.65. [DOI] [PMC free article] [PubMed] [Google Scholar]
- 58.Poleshuck EL, Katz J, Andrus CH, et al. Risk factors for chronic pain following breast cancer surgery: a prospective study. J Pain. 2006;7:626–634. doi: 10.1016/j.jpain.2006.02.007. [DOI] [PMC free article] [PubMed] [Google Scholar]
- 59.Nikolajsen L, Brandsborg B, Lucht U, Jensen TS, Kehlet H. Chronic pain following total hip arthroplasty: a nationwide questionnaire study. Acta Anaesthesiol Scand. 2006;50:495–500. doi: 10.1111/j.1399-6576.2006.00976.x. [DOI] [PubMed] [Google Scholar]
- 60.Puolakka PA, Rorarius MG, Roviola M, Puolakka TJ, Nordhausen K, Lindgren L. Persistent pain following knee arthroplasty. Eur J Anaesthesiol. 2010;27:455–460. doi: 10.1097/EJA.0b013e328335b31c. [DOI] [PubMed] [Google Scholar]
- 61.Brander VA, Gondek S, Martin E, Stulberg SD. Pain and depression influence outcome 5 years after knee replacement surgery. Clin Orthop Relat Res. 2007;464:21–26. doi: 10.1097/BLO.0b013e318126c032. [DOI] [PubMed] [Google Scholar]
- 62.Lundblad H, Kreicbergs A, Jansson KA. Prediction of persistent pain after total knee replacement for osteoarthritis. J Bone Joint Surg Br. 2008;90B:166–171. doi: 10.1302/0301-620X.90B2.19640. [DOI] [PubMed] [Google Scholar]
- 63.Somers TJ, Keefe FJ, Godiwala N, Hoyler G. Psychosocial factors and the pain experience of osteoarthritis patients: new findings and new directions. Curr Opin Rheumatol. 2009;21:501–506. doi: 10.1097/BOR.0b013e32832ed704. [DOI] [PubMed] [Google Scholar]
- 64.Keefe FJ, Lefebvre JC, Egert JR, Affeck G, Sullivan MJ, Caldwell DS. The relationship of gender to pain, pain behavior, and disability in osteoarthritis patients: the role of catastrophizing. Pain. 2000;87:325–334. doi: 10.1016/S0304-3959(00)00296-7. [DOI] [PubMed] [Google Scholar]
- 65.Sullivan MJ, Tripp DA, Santor D. Gender differences in pain and pain behavior: the role of catastrophizing. Cognit Ther Res. 2000;24:121–134. [Google Scholar]
- 66.Laupacis A, Bourne R, Rorabeck C, et al. The effect of elective total hip replacement on health-related quality of life. J Bone Joint Surg Am. 1993;75:1619–1626. doi: 10.2106/00004623-199311000-00006. [DOI] [PubMed] [Google Scholar]
- 67.Rissanen P, Aro S, Sintonen H, Slätis P, Paavolainen P. Quality of life and functional ability in hip and knee replacements: a prospective study. Qual Life Res. 1996;5:56–64. doi: 10.1007/BF00435969. [DOI] [PubMed] [Google Scholar]
- 68.Shields RK, Enloe LJ, Leo KC. Health related quality of life in patients with total hip or knee replacement. Arch Phys Med Rehabil. 1999;80:572–579. doi: 10.1016/s0003-9993(99)90202-2. [DOI] [PubMed] [Google Scholar]
- 69.Nilsdotter AK, Toksvig-Larsen S, Roos EM. A 5 year prospective study of patient-relevant outcomes after total knee replacement. Osteoarthritis Cartilage. 2009;17:601–606. doi: 10.1016/j.joca.2008.11.007. [DOI] [PubMed] [Google Scholar]
- 70.Huang NF, Dowsey MM, Ee E, Stoney JD, Babazadeh S, Choong PF. Coronal alignment correlates with outcome after total knee arthroplasty: five-year follow-up of a randomized controlled trial. J Arthroplasty. 2012;27:1737–1741. doi: 10.1016/j.arth.2012.03.058. [DOI] [PubMed] [Google Scholar]