Abstract
Background
Mitochondria, powerhouses of cells, are responsible for many critical cellular functions, such as cell energy metabolism, reactive oxygen species production, and apoptosis regulation. Monitoring mitochondria morphology in live cells temporally and spatially could help with understanding of the mechanisms of mitochondrial functional regulation and the pathogenesis of mitochondria-related diseases.
Methods
A novel non-cytotoxic fluorogenic compound, AcQCy7, was developed as a mitochondria-specific dye.
Results
AcQCy7 emitted no fluorescent signal outside of cells, but it became fluorescent after intracellular hydrolysis of the acetyl group. The hydrolyzed fluorescent product was well retained in mitochondria, enabling long-lasting fluorescence imaging of mitochondria without cell washing. A 2-day culture study using AcQCy7 showed no sign of cytotoxicity, whereas a commonly used mitochondria-staining probe, Mitochondria Tracker Green, caused significant cell death even at a much lower concentration. Apoptosis-causing mitochondria fission was monitored clearly in real time by AcQCy7.
Conclusions
A simple add-and-read mitochondria specific dye AcQCy7 has been validated in various cell models. Bright mitochondria specific fluorescent signal in treated cells lasted several days without noticeable toxicity.
General Significance
The probe AcQCy7 has been proofed to be a non-toxic agent for long-term mitochondria imaging.
Keywords: fluorogenic dye, mitochondria, cyanine dye, cytotoxicity, apoptosis
1. Introduction
Mitochondria play important roles in cellular pathways, such as cellular energy metabolism, apoptosis regulation, cell redox signaling, as well as reactive oxygen species production [1–5]. The multiple functionality of mitochondria is highly associated with their dynamic heterogeneous structures [6]. Additionally, mitochondria morphological changes are indications of many cellular processes [7–12]. Monitoring mitochondria morphological changes temporally and spatially could help with understanding of the mechanisms of mitochondrial functional regulation, leading to possible therapeutics [5, 13, 14]. Mitochondria morphological changes are usually followed in living cells non-invasively using an appropriate mitochondria-selective dye by fluorescence microscopy. Because of the unique negative membrane potentials, mitochondria passively collect positively charged compounds. Based on this phenomenon, most of the mitochondria-selective fluorophores are generally cationic lipophilic dyes, including conventional fluorescent mitochondria stains, such as rhodamine 123 [15], JC-1 dye [16], and tetramethylrhodamine [11], as well as chloromethyl moiety-containing dyes, such as Mitotracker Green (MTG), Mitotracker Orange (CMTMRos), and Mitotracker Red (CMXRos) [17]. The chloromethyl moiety-containing dyes react with thiol groups associated with mitochondria, resulting in long retention of the stains; thus, they are also compatible with commonly used fixation or permeabilization protocols. However, of numerous mitochondria-selective fluorescent probes, including the ones mentioned above, very few are non-cytotoxic. Here, we report the novel usage of a recently reported compound, AcQCy7 [18], for mitochondria-specific labeling, and importantly, AcQCy7 is not toxic to cells. Moreover, this probe has the fluorogenic advantage in that it only becomes fluorescent once it is picked up by cells, and the fluorescent signal is retained inside of mitochondria, enabling long-term fluorescent imaging of mitochondria in live cells without cell washing.
2. Materials and methods
2.1. Reagents and cells
The probes AcQCy7 and QCy7 were prepared following a published procedure [18]. The key fluorogenic compound AcQCy7 was prepared conveniently in 84% yield through just one step from two commercially available starting materials. Mito Tracker Green FM™ (MTG), Hoechst 33324, Endoplasmic Reticulum (ER) Tracker™ Blue-White, and Lyso Tracker Green were purchased from Life Technologies (Carlsbad, CA). They were dissolved in dimethylsulfoxide and stored as a stock solution (1 mM) at – 20 °C in the dark. Staurosporine was purchased from Sigma-Aldrich (St Louis, MO).
The human glioma C6 and C6/LacZ7 cell lines, the HeLa human cervical cancer cell line, and the MDA-MB-231 breast cancer cell line, obtained from the American Type Culture Collection (ATCC, Manassas, VA), were maintained in Dulbecco’s modified Eagle’s medium (DMEM), which was supplemented with 10% fetal bovine serum, 1% antibiotics (penicillin-streptomycin), 200 nM L-glutamine, and 100 nM NEAA at 37 °C under humidified 5% CO2.
2.2. Fluorescence and confocal microscopy
Images of live cells were acquired using either an inverted fluorescence microscope (Olympus 81X; Tokyo, Japan) or a confocal microscope (Olympus FluoView TM FV1000) as indicated in the figure legends. The emission of AcQCy7 was collected through the TRITC band pass filter set (excitation: 510–550 nm, emission: 573–648 nm). The fluorescence of MTG and Lyso Tracker Green was obtained through the FITC filter set (excitation: 450–490 nm, emission: 500– 550 nm), whereas Hoechst 33342 and ER Tracker Blue was taken via the DAPI filter set (excitation: 325–375 nm, emission: 435–485 nm).
2.3. Co-localization staining and fluorescence imaging
HeLa cells (5 × 10³/well) were cultured in wells on a μ-Slide 8-well chamber (ibidi, Munich, Germany) in complete media for 20 h. The cells were incubated in media in the presence of AcQCy7 (1 μM) for 40 min at 37 °C under humidified 5% CO2. The cells were washed using Hank’s balanced salt solution (HBSS), followed by incubation with MTG (250 nM), Hoechst (200 nM), ER Tracker (500 nM), or Lyso Tracker (500 nM) in HBSS buffer for 20 – 30 min. The concentration and labeling condition of each tracker was suggested by the manufacture. The cells were washed and replaced with fresh complete medium (phenol-red free) before confocal fluorescence imaging. Other cell lines, including C6, C6/LacZ7, and MDA-MB-231, were studied following the same protocol.
2.4. MTS cell viability assay
HeLa cells (5 × 10³/well), seeded in wells of a 96-well plate, were treated with AcQCy7 (1 μM) or MTG (250 nM) in complete medium for 30 min, washed, and cultured in complete medium for an additional 24 to 48 h. The medium was replaced with a fresh mixture containing DMEM and 20 μL Celltiter96 reagent solution (Promega, Wisconsin, WI). The cells were incubated for 3 h and the absorbance of each sample was measured at 490 nm to determine cell viability. The results are expressed as the mean percentage of cell viability relative to untreated cells. Each concentration was tested at least three times, and differences were deemed to be significant at a P value less than 0.1.
2.5. Images of washed vs. non-washed cells treated with AcQCy7 and MTG
C6/LacZ7 cells (5 × 10³/well) were plated in wells of a 96-well plate for 20 h (37 °C, 5% CO2). The cells were incubated with a solution of AcQCy7 (1 μM) and MTG (0.5 μM) in DMEM (phenol-red free) for 40 min. For the washing experiment, the cells were washed with and maintained in DMEM (phenol-red free) for an additional 24 h and imaged with a fluorescence microscope. For non-washed visualization, the cells were left in the same AcQCy7 and MTG containing DMEM for additional 24 h and imaged as-is.
2.6. Treatment with apoptosis inducer
HeLa cells (5 × 10³/well) were incubated on a μ-Slide eight-well chamber in complete media for 20 h at 37 °C under humidified 5% CO2. The cells were pre-incubated with AcQCy7 (1 μM) for 40 min, followed by addition of Hoechst 33342 for an additional 20 min. The cells were washed and incubated in complete culture media (phenol-red free) at 37 °C under humidified 5% CO2. Next, cells were treated with staurosporine (STS, 5 μM), and images were taken at 1.5, 3.0, and 5.5 h using a confocal microscope.
3. Results and discussion
3.1. Fluorogenic probe AcQCy7
The fluorescent dye QCy7, recently introduced by Karton-Lifshin et al., has a π-conjugated system as other cyanine dyes, in which one positive charge delocalizes between the two nitrogen atoms through a heptamethine chain (Scheme 1) [18]. It emits red light with a peak at approximately 700 nm in phosphate-buffered saline (pH 7.4). Although QCy7 is an excellent fluorophore, its application in cells is limited because of its poor membrane permeability. To overcome this shortcoming, a temporary lipophilicity-enhancing acetyl group is introduced (see structure AcQCy7) to increase its cell permeability. This acetyl group is expected to be removed quickly by intracellular esterase after the dye AcQCy7 is internalized, as we previously demonstrated [19]. Another advantage of this acetylation is that the fluorescence emission property of QCy7 is completely masked because its π-conjugated system is disrupted. Subsequent intracellular hydrolysis of the acetate ester of AcQCy7 would restore the fluorescent property of QCy7.
Scheme 1.

The fluorogenic probe AcQCy7 and proposed hydrolysis inside live cells. Graphical abstract
3.2. Specific labeling of mitochondria in various types of cells
The preferential binding of intracellular organelles by the hydrolyzed AcQCy7 was tested by co-staining with four known fluorescent organelle trackers in HeLa cells. MTG, Hoechst Blue, ER Tracker Blue-White, and Lyso Tracker™ Green were used for staining of mitochondria, the cell nucleus, ER, and lysosomes, respectively. Comparing the fluorescent images of the hydrolyzed AcQCy7 with those of the known organelle trackers, a good co-registration was only observed between AcQCy7- and MTG-treated cells (Fig. 1a). The fluorescent patterns of hydrolyzed AcQCy7 (red) and MTG (green) are near identical, as supported by the yellow staining in the merged image (Fig 1a). Poor co-localizations were observed when AcQCy7-treated cells were co-stained with Hoechst Blue, ER tracker, or Lyso tracker Green (Fig. 1b–d), indicating that the probe AcQCy7 could not label these three organelles well. The positive charge on QCy7 most likely facilitates quick translocation into mitochondria because of the negative membrane potential.
Fig. 1.
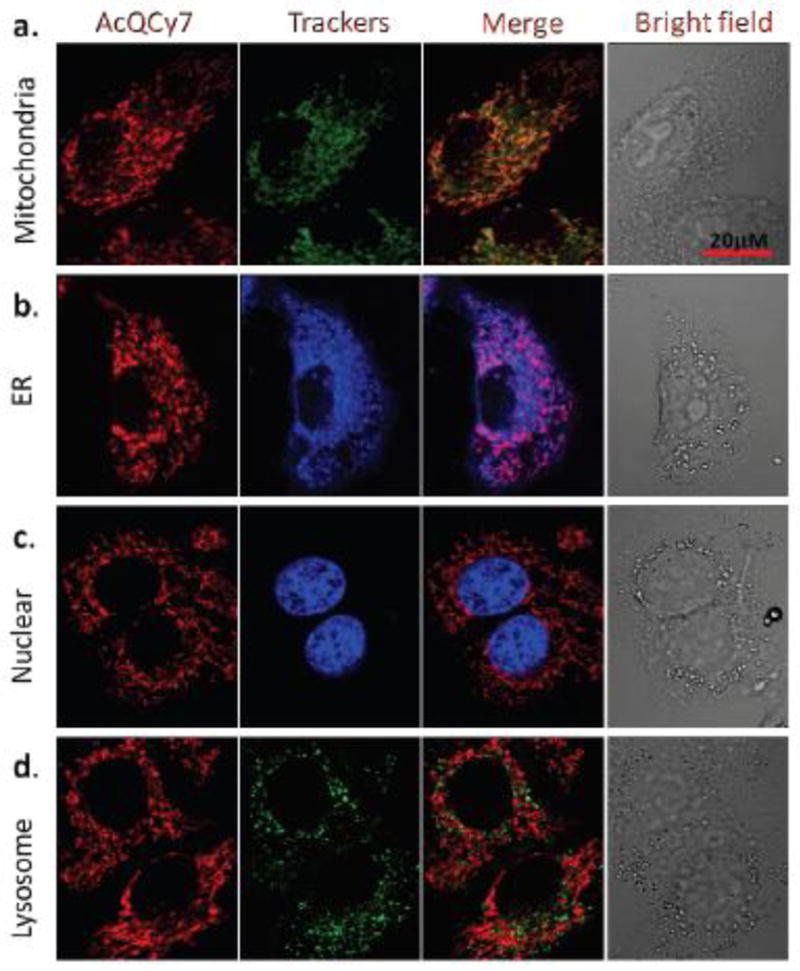
The subcellular fluorescence signals produced by the hydrolyzed AcQCy7 probe. HeLa cells were co-incubated with AcQCy7 (1 μM) and representative organelle trackers (a) MTG (250 nM) for mitochondria, (b) ER Tracker™ Blue-white (500 nM) for the ER, (c) Hoechst 33324 (200 nM) for the nucleus, and (d) Lyso Tracker™ Green (500 nM) for lysosomes. The pictures from left to right in each panel are the hydrolyzed AcQCy7 fluorescence images, and organelle trackers images, as well as merged fluorescence images and bright field images, respectively.
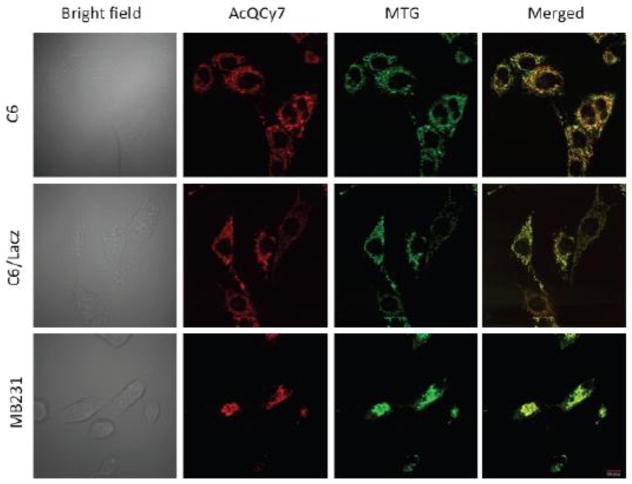
To determine its universal mitochondria-labeling capability, AcQCy7 was further investigated in three additional cell lines, including MDA-MB231, C6, and C6/lacZ cells. As observed in Figure 2, the localization of the hydrolyzed AcQCy7 (red signal) significantly overlaps with MTG (green signal) in all three lines. These results demonstrated that AcQCy7 is a potential universal mitochondrial tracker for various live cells. As expected, when the polar un-acetylated QCy7 probe was incubated with HeLa, MDA-MB231, C6, or C6/LacZ cells, no appreciable fluorescence was observed inside any cells under the microscope (data not shown).
Fig. 2.
The subcellular fluorescence signals of AcQCy7 in C6, C6/LacZ and MB231 cells. All cells were co-treated with AcQCy7 (1 μM) and MTG (250 nM). From left to right in each panel are the bright field images, fluorescence images of AcQCy7 (red), MTG (green), and merged images, respectively.
3.3. Cytotoxicity of AcQCy7 and Mito Tracker MTG
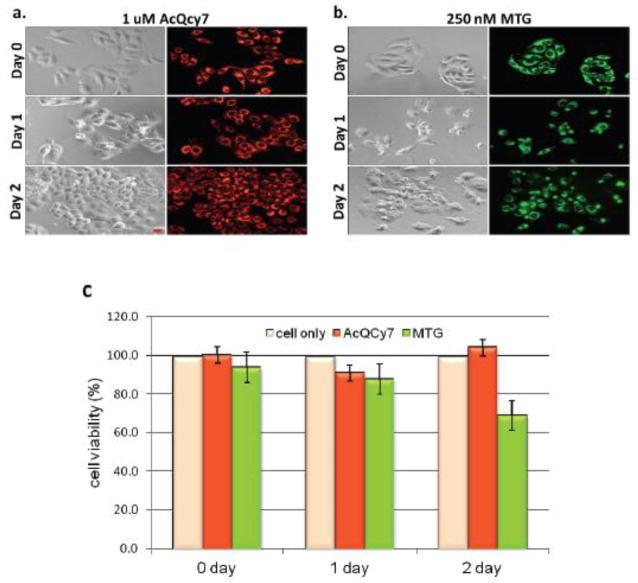
The potential cytotoxicity of AcQCy7 (1 μM) and MTG (250 nM) was first validated by incubating HeLa cells with either probe for 30 min, and imaging and performing assays at different time points. Using a fluorescence microscope, no immediate morphological changes were observed immediately after treatment. However, latent toxicity was found in MTG-treated cells after 24 or 48 h of incubation. Characteristic indications of apoptosis, such as a shrunken cytoplasm and condensed nuclei, were observed in MTG-treated cells 1 day after an initial pulse incubation (Figure 3). More apoptotic cells were observed when the incubation time was extended for another day. By contrast, HeLa cells remained healthy 1 or 2 days after the AcQCy7 (1 μM) label (Figure 3a). The cytotoxicity of AcQCy7 and MTG was further quantitated by MTS assays (Figure 3c). MTS assay is a common method used for measuring cytotoxicity of toxic materials. The assay uses a tetrazolium salt, 3-(4,5-dimethylthiazol-2-yl)-5-(3-carboxymethoxyphenyl)-2-(4-sulfophenyl)-2H-tetrazolium (MTS) in conjunction with phenazine methosulfate, the intermediate electron acceptor. The MTS is reduced to its water soluble derivative formazan, which has an absorbance maximum at about 490 nm in phosphate-buffered saline, by the cellular NAD(P)H-dependent oxidoreductase enzymes in live cells. Therefore, the cellular oxidoreductase activity can be measured through the measurement of the absorbance of the formazan at 490 nm, which, under defined conditions, reflects the number of viable cells. The MTS assay results shown in Figure 3(c) indicated that only 70% of MTG-treated cells were viable after 2 days of incubation. These MTS cell viability results were consistent with the fluorescence imaging results, indicating that AcQCy7 is non-toxic. Additionally, MTG caused significant damage to cells; even at a concentration of 250 nM, which was four times lower than that of AcQCy7 (1 μM).
Fig. 3.
Cell toxicity of AcQCy7 or MTG studied by real-time fluorescence imaging of (a) AcQCy7-treated, (b) MTG-treated HeLa cells and (c) quantitative MTS assays. The left and right panel in figure a and b are the bright field and fluorescence images respectively. The cells were treated with either AcQCy7 (1 μM) or MTG (250 nM) for 30 min and then cultured with fresh complete media until fluorescent imaging or the MTS assay. Scale bar = 20 μm.
3.4. Cell images with AcQCy7 without washing
Because AcQCy7 does not fluoresce in culture media until it is hydrolyzed to QCy7 in cells, it is possible that a typical washing step could be skipped after labeling. The non-washing process can circumvent some disadvantages caused by the conventional post-label washing process, such as cell intolerance and missing temporal information. Two parallel co-labeling experiments with AcQCy7 and MTG were performed to test whether these probes are suitable for wash-free imaging. The first set of C6/LacZ7 cells were incubated with both probes for 40 min, washed, and supplied with fresh complete culture medium, and cells were cultured for an additional 24 h prior to imaging. The second set of cells was incubated with both probes for 24 h without washing and was imaged directly (Figure 4). Clearly, there is little difference between the washed and non-washed group using the AcQCy7 fluorescence filter set. The fluorescence signals of AcQCy7 (orange) were mainly confined inside mitochondria, and the background signal in the medium was negligible, even when the AcQCy7 probe has been incubated for 24 h. However, non-washed MTG images (green) showed a strong background fluorescence signal in the cell culture media; therefore, extensive washes are needed to reduce the background MTG signal. These results indicate that mitochondria could be labeled by AcQCy7 with a high signal to background ratio conveniently (wash-free imaging) because AcQCy7 is non-fluorescent before hydrolysis, and its intracellularly hydrolyzed product is well retained in mitochondria.
Fig. 4.
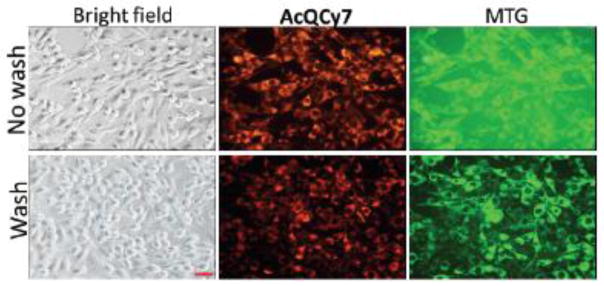
Live-cell imaging of mitochondria with the AcQCy7 (1 μM) probe and Mito Tracker MTG (0.5 μM) without (top raw) and with (bottom raw) washing procedures. The left, middle, and right panels are bright field, AcQCy7, and MTG fluorescence images.
3.5. Imaging of morphological changes during apoptosis
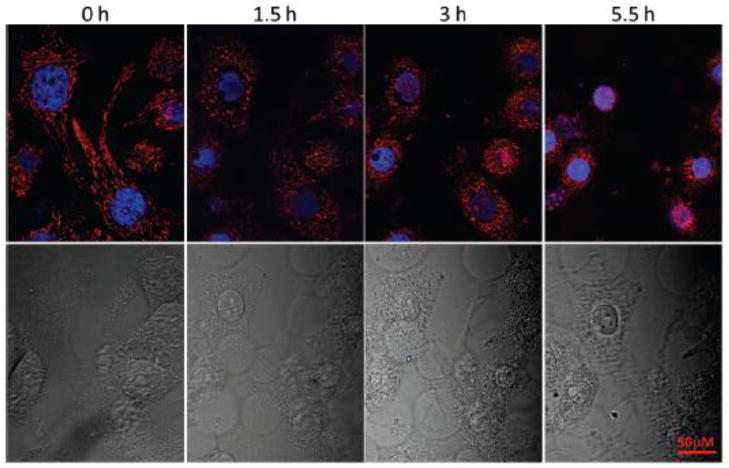
Mitochondria, a cellular apoptosis regulator, plays central roles in both extrinsic and intrinsic apoptotic pathways [20, 21]. Fragmentation of mitochondria and opening of the mitochondrial permeability transition pore to release apoptogenic factors, such as cytochrome c and apoptosisinducing factors, are critical and characteristic events in apoptosis [22, 23]. Therefore, imaging of mitochondria during apoptosis is of utmost important because it can detect the response of mitochondria to the stimuli and reveal the process of apoptosis. This is often accomplished with commercially available Mito Trackers, such as MTG, CTMRos, and CMXRos [17]; however, the process could be misinterpreted. Detection errors are usually observed because these trackers are also toxic to cells. It is reasoned that the new tracker AcQCy7 could avoid this disadvantage of current mitochondria trackers because of its lack of cytotoxicity. The potential usage of AcQCy7 was thus demonstrated by monitoring the specific mitochondria changes during apoptosis. AcQCy7-stained HeLa cells were treated with staurosporine (STS, 5 μM), a known apoptosis inducer for various cell types [11, 24]. In healthy cells, mitochondria were in a filamentous shape (Figure 5, 0 h). After 1.5 h of STS treatment, the mitochondria were shrunken to rounded structures. Extending the treatment time caused the mitochondria to further shrink, and some of them were completely disrupted as indicated by the loss and the presence of the red fluorescence in the cytosol and nucleus, respectively (Figure 5; 3 h and 5.5 h). Obviously, chromatin condensation and nucleus shrinkage were also observed in this apoptosis process as indicated by the blue fluorescence nuclear stain. The combination of the mitochondria-selective probe AcQCy7 and nucleus stain Hoechst 33324 clearly captured the characteristics of apoptosis.
Fig. 5.
Progression of apoptosis in STS (5 μM)-treated HeLa cells. The cell morphology was captured using a fluorescence confocal microscope. Mitochondria and nuclei were visualized with red (AcQCy7) and blue (Hoechst 33324) fluorescence, respectively. Scheme
4. Conclusion
In summary, AcQCy7 showed high selectivity for mitochondria over other subcellular organelles in cells. Clear mitochondrial images could be obtained conveniently after simple addition of the probe (1 μM) into the culture medium. Bypassing the routine cell-washing step, mitochondria images could be acquired without delay, and fragile cells could also be studied immediately. The probe is not toxic to cells; it persisted in mitochondria for more than 2 days. By contrast, the commercially available mitochondria tracker, MTG, caused significant cell death. Our validation results suggest that AcQCy7 is an excellent fluorogenic probe for mitochondria imaging.
Highlight.
A fluorogenic dye for mitochondrial labeling
Long lasting nontoxic mitochondria stain
A simple add-and-read dye, cell washing is not needed.
Acknowledgments
This research was supported, in part, by NIH CA135312 and GM 094880.
Footnotes
Publisher's Disclaimer: This is a PDF file of an unedited manuscript that has been accepted for publication. As a service to our customers we are providing this early version of the manuscript. The manuscript will undergo copyediting, typesetting, and review of the resulting proof before it is published in its final citable form. Please note that during the production process errorsmaybe discovered which could affect the content, and all legal disclaimers that apply to the journal pertain.
References
- 1.Newmeyer DD, Ferguson-Miller S. Mitochondria: releasing power for life and unleashing the machineries of death. Cell. 2003;112:481–490. doi: 10.1016/s0092-8674(03)00116-8. [DOI] [PubMed] [Google Scholar]
- 2.Li P, Nijhawan D, Wang X. Mitochondrial activation of apoptosis. Cell. 2004;116:S57–59. doi: 10.1016/s0092-8674(04)00031-5. 52 p following S59. [DOI] [PubMed] [Google Scholar]
- 3.Collins Y, Chouchani ET, James AM, Menger KE, Cocheme HM, Murphy MP. Mitochondrial redox signalling at a glance. J Cell Sci. 2012;125:801–806. doi: 10.1242/jcs.098475. [DOI] [PubMed] [Google Scholar]
- 4.Murphy MP. How mitochondria produce reactive oxygen species. Biochem J. 2009;417:1–13. doi: 10.1042/BJ20081386. [DOI] [PMC free article] [PubMed] [Google Scholar]
- 5.Mitchell T, Chacko BK, Darley-Usmar V. Controlling radicals in the powerhouse: development of MitoSOD. Chem Biol. 2012;19:1217–1218. doi: 10.1016/j.chembiol.2012.10.004. [DOI] [PMC free article] [PubMed] [Google Scholar]
- 6.Hoppins S, Lackner L, Nunnari J. The machines that divide and fuse mitochondria. Annu Rev Biochem. 2007;76:751–780. doi: 10.1146/annurev.biochem.76.071905.090048. [DOI] [PubMed] [Google Scholar]
- 7.Wang D, Wang J, Bonamy GM, Meeusen S, Brusch RG, Turk C, Yang P, Schultz PG. A small molecule promotes mitochondrial fusion in mammalian cells. Angew Chem Int Ed. 2012;51:9302–9305. doi: 10.1002/anie.201204589. [DOI] [PubMed] [Google Scholar]
- 8.Lane N. Mitochondrial disease: powerhouse of disease. Nature. 2006;440:600–602. doi: 10.1038/440600a. [DOI] [PubMed] [Google Scholar]
- 9.Chen M, Guerrero AD, Huang L, Shabier Z, Pan M, Tan TH, Wang J. Caspase-9-induced mitochondrial disruption through cleavage of anti-apoptotic BCL-2 family members. J Biol Chem. 2007;282:33888–33895. doi: 10.1074/jbc.M702969200. [DOI] [PubMed] [Google Scholar]
- 10.Weber T, Dalen H, Andera L, Negre-Salvayre A, Auge N, Sticha M, Lloret A, Terman A, Witting PK, Higuchi M, Plasilova M, Zivny J, Gellert N, Weber C, Neuzil J. Mitochondria play a central role in apoptosis induced by alpha-tocopheryl succinate, an agent with antineoplastic activity: comparison with receptor-mediated pro-apoptotic signaling. Biochemistry. 2003;42:4277–4291. doi: 10.1021/bi020527j. [DOI] [PubMed] [Google Scholar]
- 11.Heiskanen KM, Bhat MB, Wang HW, Ma J, Nieminen AL. Mitochondrial depolarization accompanies cytochrome c release during apoptosis in PC6 cells. J Biol Chem. 1999;274:5654–5658. doi: 10.1074/jbc.274.9.5654. [DOI] [PubMed] [Google Scholar]
- 12.Tang D, Kang R, Livesey KM, Kroemer G, Billiar TR, Van Houten B, Zeh HJ, 3rd, Lotze MT. High-mobility group box 1 is essential for mitochondrial quality control. Cell Metab. 2011;13:701–711. doi: 10.1016/j.cmet.2011.04.008. [DOI] [PMC free article] [PubMed] [Google Scholar]
- 13.Hoye AT, Davoren JE, Wipf P, Fink MP, Kagan VE. Targeting mitochondria. Acc Chem Res. 2008;41:87–97. doi: 10.1021/ar700135m. [DOI] [PubMed] [Google Scholar]
- 14.Murphy MP. Mitochondria--a neglected drug target. Curr Opin Investig Drugs. 2009;10:1022–1024. [PubMed] [Google Scholar]
- 15.Chen LB. Fluorescent labeling of mitochondria. Methods Cell Biol. 1989;29:103–123. doi: 10.1016/s0091-679x(08)60190-9. [DOI] [PubMed] [Google Scholar]
- 16.Poot M, Zhang YZ, Kramer JA, Wells KS, Jones LJ, Hanzel DK, Lugade AG, Singer VL, Haugland RP. Analysis of mitochondrial morphology and function with novel fixable fluorescent stains. J Histochem Cytochem. 1996;44:1363–1372. doi: 10.1177/44.12.8985128. [DOI] [PubMed] [Google Scholar]
- 17.Johnson I, Spence MTZ. Probes for Mitochondria. 11. Chapter 12.2. Life Technologies; 2010. The molecular probes handbook - A guide to Fluorescnet probes and labeling technologies. [Google Scholar]
- 18.Karton-Lifshin N, Segal E, Omer L, Portnoy M, Satchi-Fainaro R, Shabat D. A unique paradigm for a Turn-ON near-infrared cyanine-based probe: noninvasive intravital optical imaging of hydrogen peroxide. J Am Chem Soc. 2011;133:10960–10965. doi: 10.1021/ja203145v. [DOI] [PubMed] [Google Scholar]
- 19.Kim Y, Choi Y, Weissleder R, Tung CH. Membrane permeable esterase-activated fluorescent imaging probe. Bioorg Med Chem Lett. 2007;17:5054–5057. doi: 10.1016/j.bmcl.2007.07.026. [DOI] [PMC free article] [PubMed] [Google Scholar]
- 20.Hockenbery DM, Oltvai ZN, Yin XM, Milliman CL, Korsmeyer SJ. Bcl-2 functions in an antioxidant pathway to prevent apoptosis. Cell. 1993;75:241–251. doi: 10.1016/0092-8674(93)80066-n. [DOI] [PubMed] [Google Scholar]
- 21.Zamzami N, Susin SA, Marchetti P, Hirsch T, Gomez-Monterrey I, Castedo M, Kroemer G. Mitochondrial control of nuclear apoptosis. J Exp Med. 1996;183:1533–1544. doi: 10.1084/jem.183.4.1533. [DOI] [PMC free article] [PubMed] [Google Scholar]
- 22.Wolf BB, Green DR. Suicidal tendencies: apoptotic cell death by caspase family proteinases. J Biol Chem. 1999;274:20049–20052. doi: 10.1074/jbc.274.29.20049. [DOI] [PubMed] [Google Scholar]
- 23.Mignotte B, Vayssiere JL. Mitochondria and apoptosis. Eur J Biochem. 1998;252:1–15. doi: 10.1046/j.1432-1327.1998.2520001.x. [DOI] [PubMed] [Google Scholar]
- 24.Chae HJ, Kang JS, Byun JO, Han KS, Kim DU, Oh SM, Kim HM, Chae SW, Kim HR. Molecular mechanism of staurosporine-induced apoptosis in osteoblasts. Pharmacol Res. 2000;42:373–381. doi: 10.1006/phrs.2000.0700. [DOI] [PubMed] [Google Scholar]


