Abstract
The sea urchin oral ectoderm gene regulatory network (GRN) model has increased in complexity as additional genes are added to it, revealing its multiple spatial regulatory state domains. The formation of the oral ectoderm begins with an oral-aboral redox gradient, which is interpreted by the cis-regulatory system of the nodal gene to cause its expression on the oral side of the embryo. Nodal signaling drives cohorts of regulatory genes within the oral ectoderm and its derived subdomains. Activation of these genes occurs sequentially, spanning the entire blastula stage. During this process the stomodeal subdomain emerges inside of the oral ectoderm, and bilateral subdomains defining the lateral portions of the future ciliary band emerge adjacent to the central oral ectoderm. Here we examine two regulatory genes encoding repressors, sip1 and ets4, which selectively prevent transcription of oral ectoderm genes until their expression is cleared from the oral ectoderm as an indirect consequence of Nodal signaling. We show that the timing of transcriptional de-repression of sip1 and ets4 targets which occurs upon their clearance explains the dynamics of oral ectoderm gene expression. In addition two other repressors, the direct Nodal target not, and the feed forward Nodal target goosecoid, repress expression of regulatory genes in the central animal oral ectoderm thereby confining their expression to the lateral domains of the animal ectoderm. These results have permitted construction of an enhanced animal ectoderm GRN model highlighting the repressive interactions providing precise temporal and spatial control of regulatory gene expression.
Keywords: Sea urchin, oral ectoderm, sip1, ets4, gene regulatory network
Introduction
This work was undertaken as an effort to generate a realistic and relatively complete GRN model that would encompass the genomic regulatory code for the sea urchin (Strongylocentrotus purpuratus) embryo oral ectoderm. Both additional genes and additional spatial regulatory state domains have recently been added to the initial draft GRN model for oral ectoderm specification (Li et al, 2012; Su et al., 2009), and we continue that process here. The oral ectoderm GRN is activated initially in cells that both express and receive Nodal signals (Bolouri and Davidson, 2010 ; Duboc et al., 2004; Nam et al., 2007). These cells are located on the oral side of the cleavage stage embryo in consequence of nodal cis-regulatory response to a redox gradient set up very early in development by a primordial asymmetric distribution of mitochondria (Coffman et al., 2009; Coffman and Davidson, 2001; Coffman et al., 2004; Nam et al., 2007; Range et al., 2007). Sea urchin embryos become radialized and lose oral-aboral polarity when Nodal signaling is blocked by morpholino anti-sense oligos, or by Nodal pathway inhibitors (Duboc et al., 2004; Saudemont et al., 2010). The Nodal receptor has been identified as the Alk4 receptor kinase, which activates the Smad signal transduction pathway (Yaguchi et al., 2007). However, many regulatory genes that apparently respond to Nodal signaling in the oral ectoderm do so indirectly. For example, we recently found that an immediate Nodal signaling target, the homeobox gene not, plays an essential role in establishing oral-aboral polarity (Li et al., 2012; Materna et al., 2012).
Specification of the ectoderm is progressive and dynamic. Regulatory genes are activated, affecting one another’s spatial domain of expression often by repression, and the result is an increase in the spatial complexity of the regulatory state patterns. Thus various new subdomains emerge during the blastula stage (Li et al., 2012). Early cell lineage tracing experiments showed that the oral ectoderm is parsed into veg1 and animal oral ectoderm, which was supported by subsequent gene expression analysis. Inside the animal oral ectoderm, the subject of the present work, a stomodeal subdomain forms at the late mesenchyme blastula stage; while outside, ciliary band (CB) genes are expressed bilaterally. Furthermore, the regulatory genes of the animal oral ectoderm and future stomodeum are activated only sequentially, over the period between the early blastula (~9 hr) and mesenchyme blastula (>22 hr) stages. Considering that in this species at 15° the time typically elapsing between activation of an upstream regulatory gene and the activation of its immediate downstream target gene is ~3 hr (Bolouri and Davidson, 2003; Peter et al., 2012), the dynamics of progressive gene activation during oral ectoderm specification cannot simply be due to a single set of inputs (e.g., the Nodal signal input). Rather the observed dynamics requires the intercalation of additional intervening genes and/or repression gates which set the timing of activation. As we shall see, both in fact are in evidence.
Here, we introduce new components into the GRN model including ets4, sip1, pax4l and emx, expression of which reveals dynamic ectodermal pattern formation in the sea urchin blastula. Additionally, on the basis of perturbation, spatial expression and cis-regulatory studies, we describe the functional significance of four genes, ets4, sip1, not, and gsc, all of which execute spatial repression, contributing to the evolving complexity of oral ectoderm specification. The sip1 and ets4 genes selectively repress the expression of the key ectodermal genes gsc, foxg, and the stomodeal gene bra. Their own expression in the oral ectoderm is transient and is eventually cleared indirectly from the oral ectoderm by Nodal signaling. Their clearance thus mediates a de-repression mechanism, providing precise temporal control of downstream genes. Furthermore, the boundaries between the animal oral ectoderm and the ciliary band are determined by the homeobox genes gsc and not that function as domain-specific repressors. These new components and regulatory interactions are crucial elements in the GRN underlying oral ectoderm formation. They provide additional control functions that ensure accurate establishment of the various oral ectoderm domains downstream of Nodal signaling.
Results
Evolving spatial expression of pax41, ets4, sip1, and emx genes
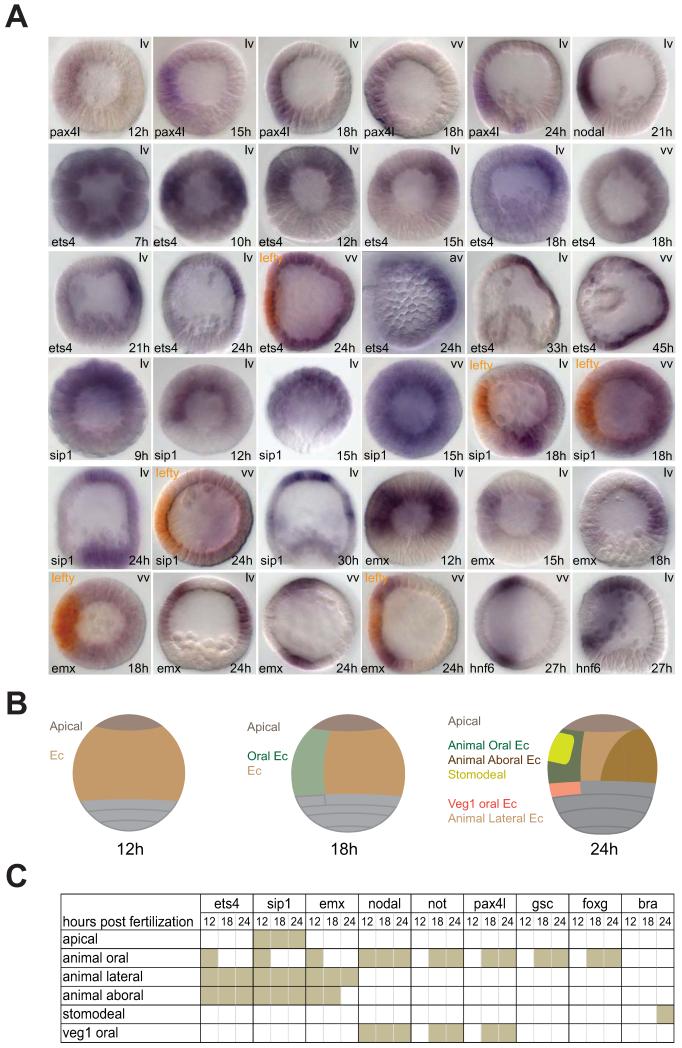
We identified new regulatory genes expressed specifically in the oral ectoderm at any time prior to gastrulation, and analyzed their temporal and spatial expression at high-resolution. The expression pattern changes (Fig.1 and Table S1) and transcript accumulation profiles (Fig.2) revealed new details of the utilization of these genes during oral ectoderm specification.
Figure 1.
Dynamic spatial gene expression patterns and territories of the oral ectoderm. A) Expression of pax4l, ets4, sip1 and emx. pax4l transcripts are localized in the oral ectoderm during the blastula stage, similar to nodal. Initially ets4, sip1, and emx transcripts cover both oral and aboral ectoderm. Oral expression of these genes fades at mid-blastula and becomes complementary to the central oral ectoderm (marked by lefty expression in the double WMISH) after18 h. B) Diagrams illustrating ectodermal gene expression domains shown in lateral view. Developmental stages are the early blastula stage (12h), late blastula stage (18h), and mesenchyme blastula stage (24h). For simplicity, endomesodermal domains are not indicated. Ectodermal domains are color-coded and labeled on the left; domain-specific genes are shown in Table S1. Apical—apical plate; Ec—ectoderm. lv—lateral view; vv—vegetal view; av—apical view. All embryos in lateral or vegetal views were shown with the oral ectoderm facing left. C) Expression matrix for ectodermal genes during the blastula stage. Three time points were included representing the early blastula stage (12h), late blastula stage (18h), and mesenchyme blastula stage (24h). A graphic presentation of the expression patterns is shown in Table S1.
Figure 2.
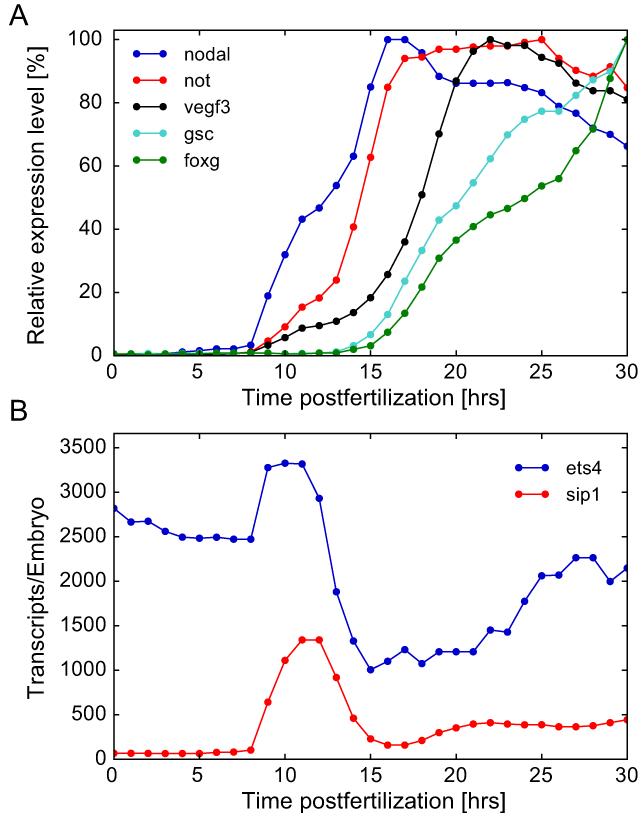
Temporal expression profiles of selected ectodermal genes establishing oral-aboral polarity at the blastula stage. A) Time courses for nodal, not, vegf3, gsc, and foxg. These genes are activated sequentially between 8 hr and 18 hr. B) Time courses for ets4 and sip1. Zygotic activation of ets4 and sip1 is concurrent with nodal transcription; ets4 is also transcribed maternally. After 11–12 h, transcript levels of sip1 and ets4 undergo a sharp decline.
A novel paired-domain homeo-box gene, pax41, is expressed in the oral ectoderm. Zygotic pax4l transcripts were detected as early as 12 hr, and this gene continues to be expressed in the same oral ectoderm territory as nodal (Fig.1A). pax4l, along with other very early oral ectodermal genes driven by Nodal signaling, marks the initial oral ectoderm regulatory state (Li et al., 2012).
The ets4 gene (Rizzo et al., 2006; Wei et al., 1999a; Wei et al., 1999b), the sip1 gene (Howard-Ashby et al., 2006; Materna et al., 2006; Yaguchi et al., 2012), and the emx gene are initially expressed zygotically in both oral and aboral ectoderm precursors during late cleavage (9-12 hrs; Fig.1A). Many hours following activation of nodal, expression of these initially pan-ectodermal genes was excluded from the oral ectoderm (Fig.1A): by 18 hr for ets4 and emx, and by 15 hr for sip1. The ets4, sip1, and emx genes thus come to share a complementary expression pattern relative to that of oral ectoderm genes. This pattern lasts throughout the mesenchyme blastula stage. After that, ets4 expression continues in the aboral ectoderm, while sip1 expression is gradually restricted to a limited number of neuron precursor cells (Yaguchi et al., 2012). Additionally, sip1 transcription is newly activated in the aboral mesoderm starting from the mesenchyme blastula stage. Expression of emx undergoes further restriction following oral clearance. Its aboral expression gradually attenuates during the mesenchyme blastula stage. The resultant expression pattern of emx marks a new subdomain: the animal lateral ectoderm, which is defined as a region sandwiched between the oral and aboral ectoderm, and between the apical region and veg1 ectoderm (Fig.1B). The animal lateral ectoderm is distinct from that of the whole ciliary band (CB) which surrounds the entire oral ectoderm, running both through the apical plate and through the veg1 oral ectoderm (Li et al., 2012). Previously some signaling genes were reported in the animal lateral ectoderm subdomain (Saudemont et al., 2010), but emx (at 24h) is the first transcription factor expressed exclusively in this region.
Fig.2A shows the sequential activation of a series of genes all expressed in the oral ectoderm (Materna et al., 2010). Stomodeal genes, expression of which is localized within the oral ectoderm, are activated at an even later time point. It is interesting to note that the transcription profiles for ets4 and sip1 are remarkably parallel, displaying a simultaneous transcriptional “burst” (Fig.2B), though ets4 transcript is present maternally while sip1 transcript is not. Zygotic expression of both sip1 and ets4 starts about 9 hrs whereupon their transcript levels peak between 11 and 12 hrs, and then abruptly fall.
GRN governing animal ectoderm specification
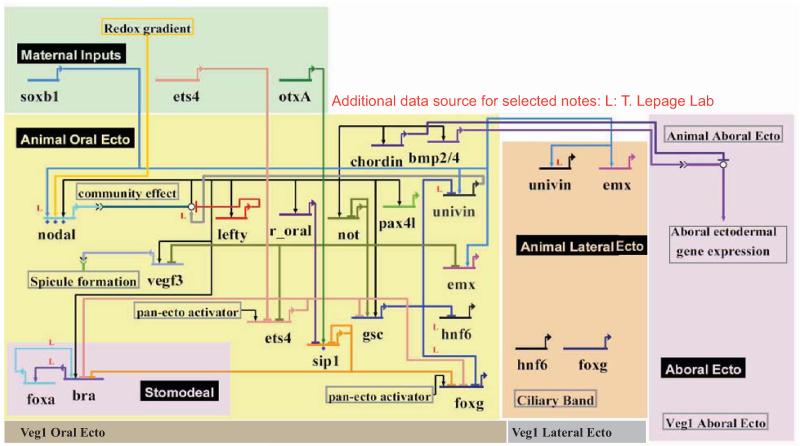
In Fig.3 we present an updated BioTapestry model of the GRN underlying development of the animal oral ectoderm up to 24 hrs. This model is based on the previous work cited above plus the new results presented in this paper (Fig.S1). These results are discussed linkage by linkage in the following sections, while their global interrelationships can be perceived a priori in Fig.3.
Figure 3.
The gene regulatory network (GRN) model of the animal ectoderm up to mesenchyme blastula stage. This GRN model includes features relevant to the step-wise establishment of regulatory states. The circuitry shows direct and indirect Nodal signaling effects involved in ectodermal gene expression, and the double negative gate logic mediated by ets4 and sip1 clearance, which provides both spatial and temporal restriction of oral ectodermal and stomodeal gene expression. The targets of these double negative gates include gsc, foxg and bra.
Direct targets of Nodal signaling are indicated as outputs from the Smad transcription factor activated by reception of the Nodal signal (blue line to open circle) and these outputs are traced to their respective targets by the black lines in the BioTapestry diagram. Many of the direct as opposed to indirect targets of Nodal signaling were distinguished from one another earlier (Li et al., 2012; Su et al., 2009). Here we have added another direct target, the newly identified pax4l gene. Though this gene is activated in the oral ectoderm very early (Fig.1), its targets have so far remained elusive.
Fig.3 shows that the Nodal signaling pathway contributes to the stepwise organization of the oral ectoderm by an indirect derepression mechanism. Two genes encoding repressors, ets4 and sip1, are blocked from expression in the oral ectoderm by two other genes encoding repressors, which are activated as direct Nodal targets. One of these genes is not, and the other yet unknown (r-oral). Prior to the transcriptional clearance mediated by not and r-oral, ets4 and sip1 products selectively prevent foxg, gsc, and bra expression, though they spare other early nodal targets such as nodal itself and not. Since repression is dominant, these double negative gates account for the delayed timing of expression of the Nodal target genes bra, and gsc. In addition, sip1 provides spatial as well as temporal restriction of foxg expression, which is not spatially activated by Nodal signaling. Thus foxg continues to be repressed in the aboral ectoderm by sip1, while after sip1 expression is blocked in the animal oral ectoderm, foxg transcription is allowed there.
Formation of the animal lateral ectoderm domain occurs after oral ectoderm and aboral ectoderm acquire their identities. Fig.3 shows that restriction of the lateral ciliary band expression of the emx and univin genes depends on repression in the animal oral ectoderm respectively by not and gsc gene products. Due to the subtle difference in timing of their expression, not represses early animal lateral genes, while gsc represses later animal lateral and CB genes. Together both genes contribute to define of the boundary between animal oral ectoderm and CB/animal lateral ectoderm.
Evidence that pax41 is a direct target of Nodal signaling
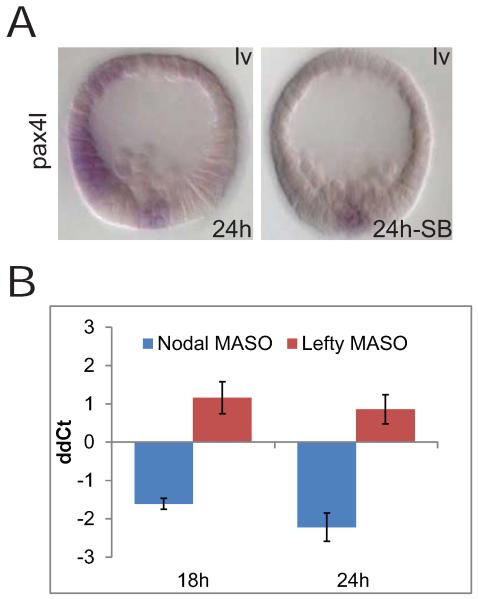
The early expression of pax41 at the same time as bona fide Nodal target genes such as not (Fig.2A; Li et al, 2012), combined with the spatial coincidence of nodal and pax41 expression (Fig.1) indicated that pax41 could also be a direct target of Nodal signaling. This possibility is strongly supported by the experiments of Fig.4. Embryos treated with the nodal-pathway inhibitor SB431542 lost the ability to express pax4l in the oral ectoderm, while its mesodermal expression was unaffected (Fig.4A). Direct Nodal targets should respond to nodal morpholino by loss of expression and to lefty morpholino by gain of expression (Li et al, 2012), and this is demonstrated in the QPCR measurements of Fig.4B. This brings to 8 the number of genes for which there is either good evidence or a likely argument that Nodal signaling provides a direct positive input, including the nodal gene itself as shown earlier (Fig.3).
Figure 4.
pax4l is an oral ectodermal gene controlled by the nodal pathway. A) WMISH observations on pax4l. This experiment shows that ectodermal, but not mesodermal, expression of pax4l is completely lost if the Nodal signaling pathway is inhibited with SB-431542. The embryos were shown with the oral ectoderm facing left. B) Quantitative perturbation results. pax4l transcript levels are reduced in response to the nodal MASO, and increased by lefty MASO. Changes in expression levels of ectodermal genes were quantified by QPCR relative to poly-ubiquitin. Results shown as arithmetic mean ± standard deviation (ddCt:ΔΔCt, i.e., QPCR cycle number normalized to control Ct and to polyubiqitin Ct; 1 ddCt = 1.9 fold difference).
Cis-regulatory analysis of inputs contributing to early sip1 expression
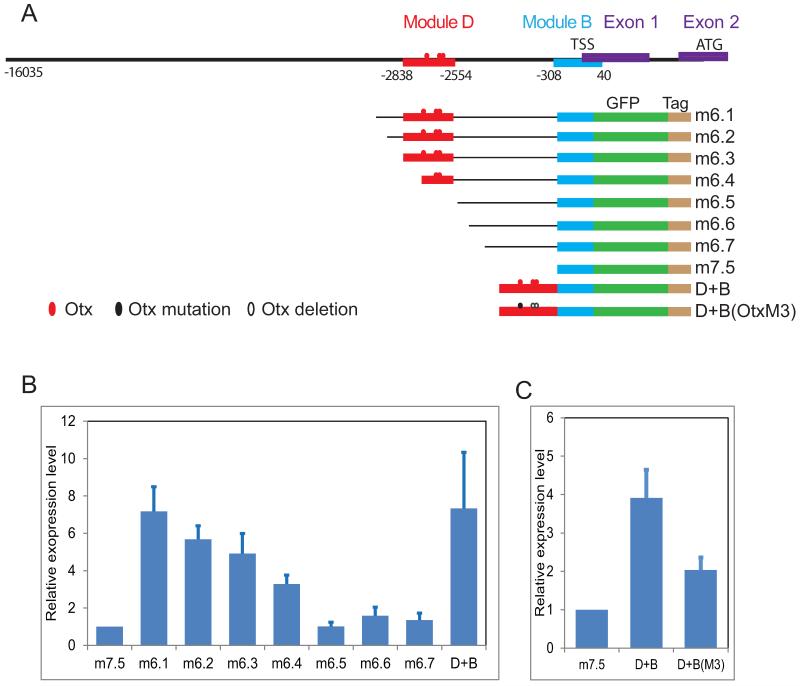
A previous study revealed two active sip1 cis-regulatory modules (Nam et al., 2010). The transcription start site was mapped by 5′ RACE, which located both regions upstream of the first exon. As shown in Figs.5A, B, both modules are included in a construct containing 16KB of upstream sequence, which drives accurate oral ectoderm expression (Fig.S2). A series of truncations provided a functional map of these regulatory regions, the activity of which was assayed quantitatively and simultaneously using the tag system (Nam et al., 2010). The proximal module “B” (−300 to +40) harbors the basal promoter, while the distal module “D” (−2854 to −2500) provides most of the transcriptional activity: constructs lacking module D, such as m6.5, m6.6, and m6.7, possessed low activities similar to that of the basal module B (Fig.5B). Combing both modules (construct “D+B”) produced spatially and quantitatively accurate transcriptional activity similar to that of the starting 16KB construct (Fig.S2B, C, D). Since most of the driver activity is located in the distal module we focused on this to uncover the factor contributing to the initial zygotic activation of the sip1 gene. The sequence of module D was examined for binding sites of regulatory factors known to be expressed earlier than sip1 (i.e., maternally encoded or cleavage-stage zygotic transcription factors; Fig.S3). This analysis revealed three Otx sites (IUPAC sequence CYAATY; (Wei et al., 1995), which we tested functionally by site-specific mutation (Fig.5C). This experiment showed that these three Otx sites alone contribute half of the wild type construct activity beyond that of the minimal wild-type promoter.
Figure 5.
Cis-regulatory analysis to uncover the regulatory inputs driving early sip1 expression. A) Diagram of the 16 kb region upstream of sip1 and reporter constructs shown earlier to have cis-regulatory activity. All constructs include a GFP reporter and sequence tag for expression analysis (Nam et al., 2010). B) Identification of active modules driving sip1 expression through a series of deletion constructs. C) Mutation of otx-binding sites, resulting in reduced expression level.
Clearance of ets4 and sip1 from the oral ectoderm
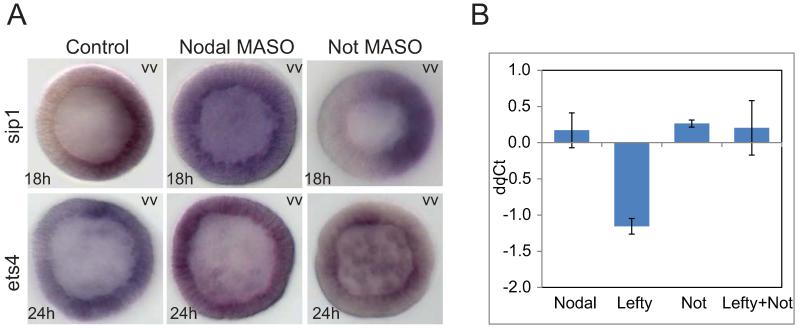
As can be seen in Fig.2B and Fig.6A, zygotic expression of both ets4 and sip1 is shut down abruptly after about 12 hr, and for this event to occur nodal expression is required. Introduction of nodal MASO radializes the embryo and causes oral clearance of transcription of both genes to fail. Thus in treated embryos at 18 and 24 hr respectively sip1 and ets4 transcripts remain present in both oral and aboral ectoderm. Since as we found earlier (Li et al., 2012) not, a direct Nodal target, acts to repress several other oral ectoderm genes, we examined whether this gene could also be the immediate agent of repression of ets4 and sip1. This indeed appears to be the case for ets4. Thus embryos bearing not MASO continue to express ets4 in oral as well as aboral ectoderm (Fig.6A). Additional perturbation experiments shown in Fig.6B confirm this conclusion: lefty MASO causes a sharp decrease in ets4 transcripts due to expansion of the Nodal signaling domain, but this effect is cancelled if not MASO is also present, since not expression is the effector of the Nodal dependent repression of ets4 transcription.
Figure 6.
Clearance of sip1 and ets4 from oral ectoderm in response to nodal or not perturbation. A) Spatial effects of nodal and not MASOs. In nodal MASO treated embryos ets4 and sip1 transcription was detected in both oral and aboral ectoderm up to 24h. In not-MASO treated embryos, ets4 continues to be transcribed in the oral ectoderm, but oral clearance of sip1proceeded as in controls. All embryos were shown with the oral ectoderm facing left. B) Quantitative analysis of ets4 transcript levels. Increased Nodal signaling through knockdown of lefty led to a moderate reduction of ets4 abundance. This reduction was abolished by co-injection of not MASO.
In contrast, not MASO had no effect on oral ectoderm clearance of sip1 (Fig.6A). Additional tests of gsc and pax4l MASOs showed that neither gene is responsible; nor is any combination of not, gsc and pax4l genes (data not shown). Since all known and authenticated direct effects of Nodal signaling in the oral ectoderm are positive, a yet unknown repressor which we term “R-oral” is predicted to exist, which mediates the negative effect of nodal gene expression on oral sip1 transcription.
ets4 and sip1 selectively repress transcription of oral ectodermal genes
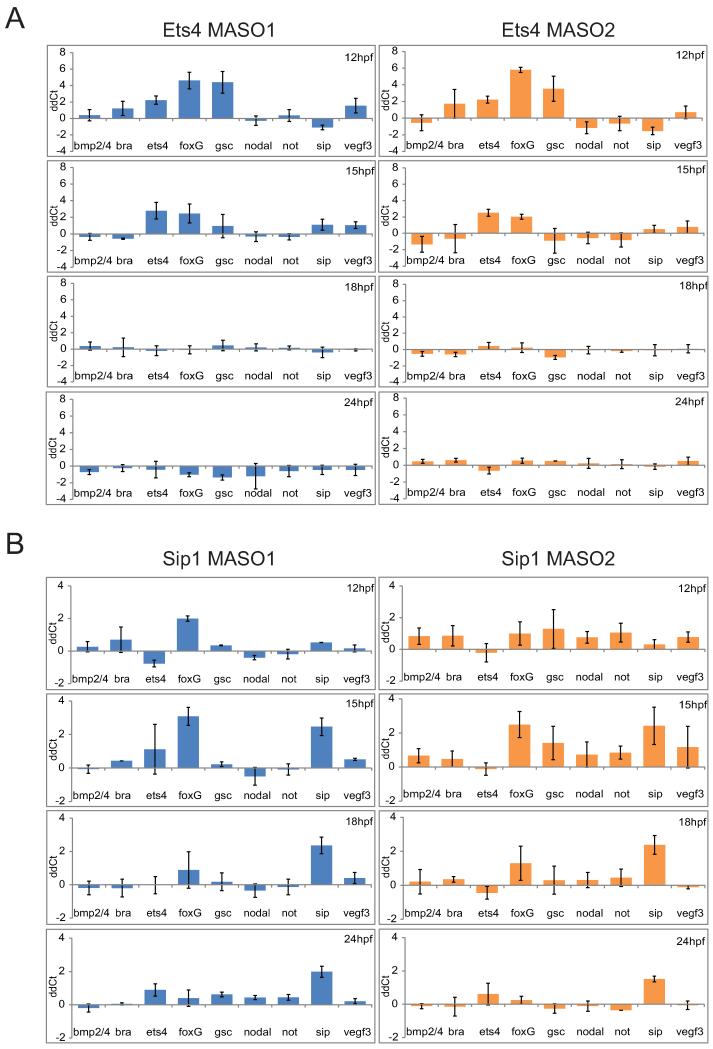
To obtain a comprehensive indication of the functions of the sip1 and ets4 genes in the overall GRN, we carried out perturbation assays as a means of identifying their targets. Two translation blocking MASOs were designed for each gene for knock-down assays. Following MASO injection, the resultant expression changes were measured using QPCR. Ten previously-identified ectodermal regulatory genes were included in this investigation, and their expression changes were analyzed throughout the blastular stage including 12, 15, 18, and 24 hr (Fig.7A). Experimental embryos were also assayed with the NanoString nCounter system in which every regulatory gene known to be expressed during S. purpuratus embryogenesis was included in the analysis.
Figure 7.
Selective repression of oral ectoderm genes ets4 and sip1. Expression of both genes was inhibited using two different MASOs for each gene, in at least three batches of embryos. A) ets4 MASO; B) sip1 MASO. Results are shown in ddCt (cf Fig.4.) as arithmetic mean ± standard deviation.
The two ets4-MASOs resulted in a consistent pattern of gene expression changes (Fig. 7A). Only certain specific oral ectoderm genes were affected by interference with ets4 expression. Thus foxg expression significantly increased at 12 hr, displaying 16- and 20-fold increases over control levels of expression. Expression of gsc was affected to almost the same extent. Both genes appeared less up-regulated by ets4 MASO treatment when assayed at 15 hr, and these effects had disappeared entirely by 18 hr. Expression of the early oral ectoderm genes nodal and not was impervious to the perturbation. The confined period of Ets4 repression of foxg and gsc is perfectly consistent with the ets4 expression dynamics shown in Fig.2B, as the repression is observed 3 hr after the transcriptional activation of ets4, but has disappeared by a few hrs after ets4 transcription ceases or dramatically declines and its transcript is cleared from the oral ectoderm.
Experiments with sip1-MASOs produced similar results (Figs.7B and S4). Both foxg expression and that of sip1 itself were significantly and reproducibly elevated, about 6- to 8-fold at 15 hr, with similar results for the two MASO’s (Fig.7B). A similar result was obtained in the NanoString experiment (Fig.S4), where it can also be observed that no other gene in the whole 190 gene probe set was significantly affected at these developmental times. Again the effect on foxg transcript level dwindled away by the hatching blastula stage, after sip1 is cleared from the oral ectoderm. The sip1 gene appears in these experiments to be negatively auto-regulating itself and the same is likely true of ets4 (Fig.7A), though as monitored by QPCR the effect relative to control is less striking because of the residual pool of maternal ets4 transcript. The onset of auto-repression after the transcript levels have accumulated to a certain level would account for the peak-like expression profiles of both genes (Fig.2B). This behavior is commonly observed in the sea urchin embryo GRNs, e.g., in the blimp1 gene (Smith et al., 2007), the alx1 gene (Damle and Davidson, 2011; see this study for a mechanistic explanation), and the hox11/13 gene (Peter and Davidson, 2011). Evidently no cross regulatory interaction occurs between the sip1 and ets4 genes, which thus act in parallel.
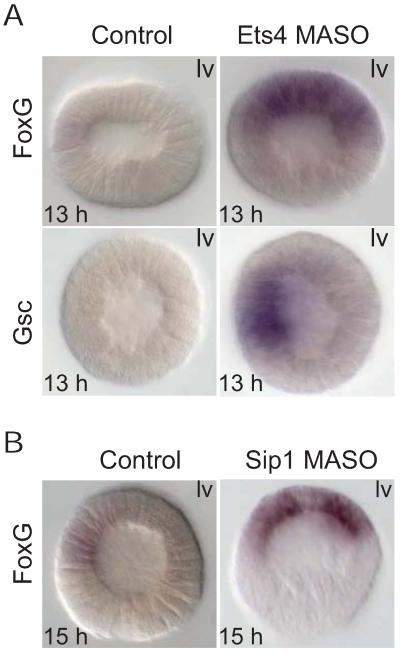
The effects of sip1 and ets4 MASOs on their downstream targets were further examined spatially, by WMISH (Fig. 8). Consistent with the prior expression profiles and QPCR results, no transcripts of foxg or gsc could be detected in early blastula stage control embryos (13 hr). But, in contrast, ets4 MASO produced significant levels of gsc and foxg transcription at this stage. The spatial disposition of the “premature” foxg and gsc transcripts differ from one another, although their normal endogenous expression patterns are nearly identical during the blastula stage (Figs.8A, S5). Thus gsc expression was localized in the ets4 MASO embryos to its normal domain, the oral ectoderm, while foxg gene was seen in the whole animal half ectoderm, oral and aboral, including strong expression in the apical region. A similar foxg expression pattern was seen in sip1 MASO embryos (Fig.8B). Again a significant level of foxg transcript could be detected in the ectoderm of the sip1 morphant at 15 hr, while foxg transcription is barely initiated at this time in the control. The localization of the ectopic premature foxg transcripts in these experiments indicate that the (unknown) driver of this gene is a pan-ectodermal regulatory factor, while those of gsc are already established to be Not and Nodal signaling (Li et al, 2012).
Figure 8.
Spatial effects of ets4 and sip1 MASOs. A) ets4 MASO. Transcripts of foxg and gsc were detected at early blastula stage (13 h) in embryos bearing ets4 MASO, but not in control embryos. Expression of gsc is still restricted to the oral ectoderm in ets4 morphants, but expression of foxg covers the whole ectoderm. B) sip1 MASO. Expression of foxg in sip1 morphants covers the oral and aboral ectoderm at the mid-blastula stage (15 hpf), similar to (A). lv—lateral view; av—apical view. All embryos were shown with the oral ectoderm facing left.
Control of stomodeal genes
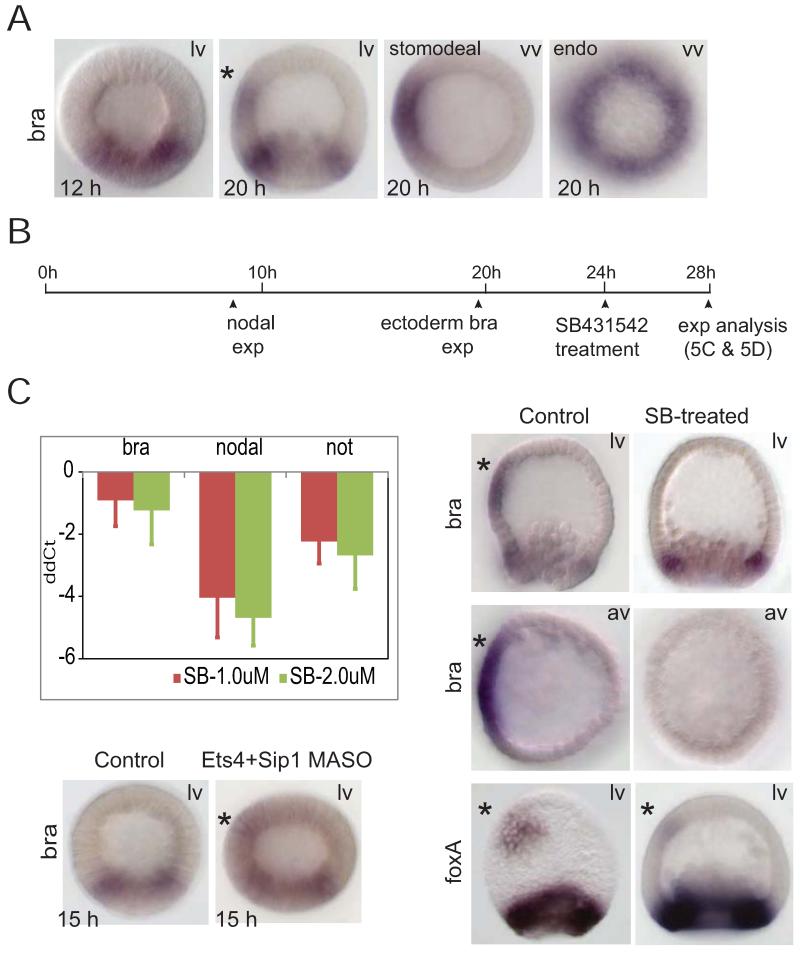
The stomodeal regulatory state domain of the pregastrular sea urchin embryo is located within the animal oral ectoderm (Fig.1B, 24 hr image; Li et al., 2012). bra is the first stomodeal gene activated (Croce et al., 2001). In addition to its ectodermal expression, bra is of course also expressed in the endoderm, where it is activated at early blastula stage (Peter and Davidson, 2010; Fig.9A). Previous reports had shown that stomodeal bra expression is controlled by the Nodal signaling pathway, directly or indirectly (Duboc et al., 2004; Saudemont et al., 2010). Blocking the Nodal signaling pathway with the receptor-kinase inhibitor SB431542 resulted in the loss of stomodeal bra expression, but not of endodermal bra expression (Fig.S6). Consistent with a role as driver of stomodeal bra expression, elevated levels of Nodal signaling due to lefty knockdown cause panectodermal bra expression, as shown previously (Duboc et al., 2004).
Figure 9.
Transcriptional control of stomodeal bra expression. A) Endodermal and stomodeal expression of bra during blastula stage. While endodermal bra can be seen at early blastula, stomodeal bra expression (marked by “*”) starts later and can be observed at 20h early mesenchyme blastula stage. B) Diagram of assay protocol testing for direct nodal targets by temporarily blocking Nodal signaling. Nodal signaling pathway inhibitor SB-431542 (SB) was added to cultures of sea urchin embryos at 24h, and gene expression was analyzed at 28h. C, QPCR assessment of effects of temporary SB treatment at indicated concentrations. This treatment significantly reduced the expression levels of nodal and not, but had small effects on bra levels. D, WMISH observations of effects of treatment with SB. Stomodeal bra expression is wiped out by 4h SB treatment, but endodermal bra expression is not affected; foxa stomodeal expression is diminished and endodermal expression is not affected. E) Effect of ets4 plus sip1 MASO on early bra expression. WMISH shows that ets4 and sip1 are required for proper timing expression of stomodeal bra expression; ets4/sip1 MASOs resulted in abnormal ectodermal bra expression during the early blastula stage. lv—lateral view; av— apical view. * marks stomodeal bra or foxa. All embryos in lateral or vegetal views were shown with the oral ectoderm facing left.
Because there is a long interval between initiation of nodal transcription at 8 hr and stomodeal bra expression at about 20 hr, we wished to determine whether stomodeal bra transcription is directly activated by Nodal signaling. To test this we used SB431542 to block Nodal signaling in a specific temporal window and analyzed the consequential expression changes (Fig.9B). The inhibitor was added at 24 hr to a sea urchin embryo culture which was harvested at 28 hr for quantification of gene expression levels. Treatment of embryos for 4 hours with the inhibitor at a concentration of 1uM or 2uM significantly reduced accumulation of nodal mRNA, to about 8% and 5% of control respectively. This is due to the feedback response of the nodal gene to Nodal signaling, which accounts for 95% of the rate of nodal gene expression (Bolouri and Davidson, 2010; Nam et al., 2007). Likewise, not expression underwent a reduction of 4-6 folds (Fig.9C).
Spatial expression of bra was investigated following the same SB15432 treatment protocol (Fig. 9D). Stomodeal bra expression was completely erased by blocking Nodal signaling; in contrast, endodermal bra expression was unaffected. Considering the kinetics of successive gene activation in sea urchin embryos (Bolouri and Davidson, 2003; Peter et al., 2012), complete loss of stomodeal bra expression within a 4-hour window is most unlikely to be mediated by another gene intervening between the Nodal pathway and bra. Therefore, stomodeal bra expression is likely to be activated directly by Nodal signaling, even though the onset of bra expression is significantly later than that of initial nodal expression. The expression of another stomodeal gene, foxa, was investigated using the same assay (Fig.9D), and we observed some loss of stomodeal expression, though less complete. The linkage between nodal and foxa, however, might be at least partially indirect, as bra and foxa are reported to operate in a stomodeal feedback loop (Saudemont et al., 2010).
To address the long delay between the onset of Nodal signaling and activation of bra, we asked whether ets4 or sip1 are involved in temporal repression of stomodeal bra expression. Thus stomodeal bra expression was studied in embryos injected with both ets4- and sip1-MASOs (Fig.9E). The double-MASO perturbation did not alter endodermal bra expression. However, a large amount of ectodermal bra expression was detected at 15 hr in the treated embryos, while no bra expression is seen in the ectoderm of control embryos during the same stage. Premature ectodermal bra expression was only seen when both repressors were knocked down simultaneously, suggesting a synergetic repression mechanism. Additionally, ectodermal bra expression in the sip1/ets4 morphant was localized to one side of the embryo, consistent with the observation that Nodal signaling is responsible for the spatial restriction of ectopic bra expression to the oral ectoderm.
Restriction of animal lateral/ciliary band gene expression by Not and Gsc repressors
As in the stomodeal territory, regulatory specification in the animal lateral ectoderm begins at mesenchyme blastula stage. Genes expressed exclusively in the animal lateral domain include the homeobox gene emx (Fig.1) and signaling genes such as univin (Saudemont et al., 2010). Ciliary band genes such as one-cut (hnf6) (Fig.1A) overlap with this region, but such genes are expressed in trapezoidal patterns that include additional apical and veg1as well as lateral expression territories.
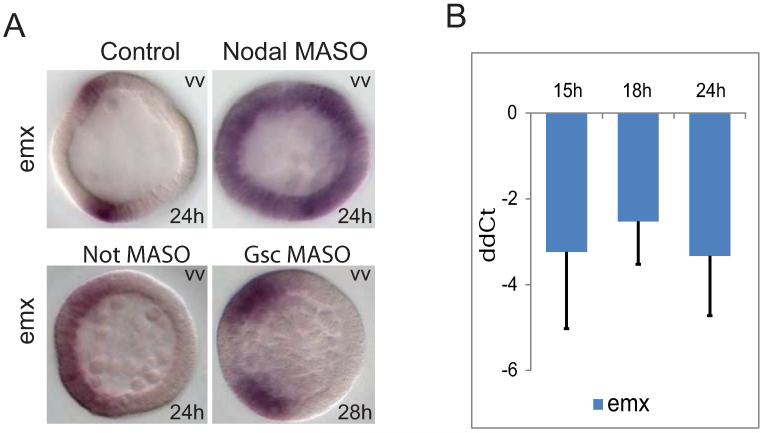
The lateral/CB genes are expressed in unique, dynamically changing patterns. Like emx, univin is initially expressed in the entire blastula stage ectoderm. Transcription of the univin gene is extinguished on the aboral side during the mesenchyme blastula stage, while its central oral ectodermal expression fades only during the gastrula stage leaving it to be transcribed in the lateral CB domains (Saudemont et al., 2010). The CB gene one-cut is expressed both zygotically and maternally; its zygotic expression briefly includes the entire oral ectoderm during the early mesenchyme blastula stage, but then is sharply restricted to the ciliary band. In embryos treated with nodal MASO, expression of both emx and one-cut expands to the whole ectoderm (Figs.10A and S7). The control and the nodal MASO expression patterns of these lateral and CB genes suggested that their transcription is spatially controlled by pan-ectodermal activator(s), and nodal-dependent repressor(s).
Figure 10.
Transcriptional regulation of the emx gene. A) Spatial emx expression changes in response to nodal, not, or gsc MASOs. B) soxb1 input to ectodermal emx expression. Expression levels of emx were measured by QPCR relative to poly-ubiquitin. Results are shown in ddCt (cf Fig.4) as arithmetic mean ± standard deviation. vv: vegetal view. All embryos were shown with the oral ectoderm facing left.
We focused on the newly-identified animal lateral ectoderm gene emx. Treatment with not MASO resulted in expansion of emx expression into the central oral ectoderm at the late mesenchyme blastula stage (Fig.10A). Thus not, which is transcribed in the cells of the central oral ectoderm (Li et al, 2012), functions as a negative regulator restricting emx expression to the lateral regions. The activator for emx was identified by screening maternal and early blastula regulatory genes. Among them we found that soxb1 expression is essential for emx expression. The level of emx transcription dropped by almost 90% when soxb1 gene expression was blocked (Fig.10B).
Saudemont et al. had previously shown that gsc functions as a repressor responsible for restricting expression of target genes univin to the lateral ectoderm and foxg, and one-cut to the CB (Saudemont et al., 2010). However, gsc is not involved in restriction of emx expression, since oral clearance of emx remained the same after treatment with gsc MASO (Fig.10A). This agrees with the temporal expression profile of gsc, which in S. purpuratus has barely begun when oral clearance of emx takes place at the mid-blastula stage. The repressive role of gsc with respect to CB genes is consistent with their mutually exclusive expression territories, as seen in the gsc/one-cut double in situ in Fig.S5. The not gene could not execute this function because its expression overlaps that of one-cut in the vegetal domain of the ciliary band (Li et al., 2012). Thus the slightly different spatial and temporal expression domains of the two oral ectoderm repressors gsc and not, account for their distinct targets among CB and lateral ectoderm genes.
Discussion
Here we introduce several new genes into the oral ectoderm GRN model, and augment its power to explain both the spatial and temporal dynamism of gene expression as the pregastrular subdomains of the oral ectoderm are formulated. Many of the linkages in the current GRN model are the same as those published earlier (Saudemont et al 2010; Li et al 2012; Su et al, 2009), but the additional circuitry we have discovered has changed our awareness of the mechanisms of spatial subdivision, and of the means by which the temporal sequence of regulatory state development is controlled in the oral ectoderm. This work concerns only the upper portions of the oral and lateral ectoderm, viz. the animal oral ectoderm, the stomodeum, and the flanking lateral ectoderm domains which are also the lateral portions of the ciliary band; that is, approximately the portions of the ectoderm on the oral and lateral flanks which derive from the an1 and an2 blastomere tiers (Cameron et al., 1987).
Roles of ets4 and sip1 in the spatial and temporal control of oral ectoderm gene expression
A particularly interesting feature revealed by this work is the double negative gate regulatory logic which the sip1 and ets4 subcircuits execute. This logic is formally similar to that of the double negative gate initiating skeletogenic lineage specification discovered earlier (Oliveri et al., 2008). There the first repressor in the gate was encoded by the pmar1 gene and the second by the hesc gene; here the first in the ets4 gate is encoded by the not gene and the second by ets4; and the first in the sip1 gate is encoded by the predicted Nodal target gene “R-oral”, the second by sip1. As we have pointed out, double negative gates act as X/1-X spatial logic processors (Peter and Davidson, 2009): X is where the first repressor and the target genes of the double negative gate are allowed to be expressed, and 1-X is everywhere else that the second repressor is expressed and that the same target genes are specifically forbidden to be expressed even if their activators are present. Thus in the pmar1 double negative gate X is the skeletogenic lineage and 1-X is all the rest of the embryo; here X is the animal oral ectoderm and for the sip1 gate 1-X is the aboral ectoderm, the endomesoderm, and the aboral portion of the apical plate (Fig1, 24h); for the ets4 gate 1-X is the aboral and lateral ectoderm and the aboral edge of the apical plate (Fig.1, 24 hr). Thus, for example, ets4 and sip1 expression are both required to keep foxg expression out of the aboral animal ectoderm and the apical plate (Fig.8). For other target genes such as bra and gsc this repression mechanism is superfluous, since their activation depends directly on Nodal signaling which is itself confined by other mechanisms to the oral ectoderm (Nam et al., 2007; Range et al., 2007).
The auto-repression to which both ets4 and sip1 are subject (Fig.7) adds a sharp temporal character to the operation of the double negative gate. The gates open, allowing target gene expression in the animal oral ectoderm, only when sip1 and ets4 expression clears away from the oral ectoderm. For both genes autorepression looks to be triggered as the gene products attain higher concentration (other cases of autorepression including blimp, hox11/13b, and alx were described earlier in text (Smith et al., 2007; Damle and Davidson, 2011; Peter and Davidson, 2011)). For ets4, the first repressor of the subcircuit is known to be encoded by the not gene. Close perusal of the kinetics of expression in Fig.2 shows that cessation of ets4 transcript accumulation and autorepression at 10-11h precedes any possible repression by not, which has barely become active by then, and which cannot affect transcription downstream for perhaps 3 more hours. Yet by 24h, clearance of ets4 transcript from the oral ectoderm is entirely dependent on not expression (Fig.6). That is, the kinetics of clearance depend initially on autorepression, and this dependence shifts in several more hours to permanent trans-repression, which does not require the high gene expression levels that autorepression does. The similarity of autorepression kinetics for ets4 and sip1 suggest that the same argument is true for both and thus “R-oral” need not be active for several more hours. Another way to consider this, suggested by evidence from the other cases of autorepression cited above, is that autorepression brings the rate of transcription down to where trans-repression can effectively and permanently eliminate expression.
The temporal parameters of the ets4 and sip1 double negative gates, i.e., the point at which they open, are used for an interesting purpose. The target gene gsc executes a key role in extinguishing oral ectoderm expression of genes which are allowed to run in the CB, viz. foxg, univin, and one-cut (Fig.3; Saudemont et al., 2010). Thus this spatial control function is unlocked by the double negative gates which thereby set the timing of establishment of the lateral ectoderm/CB regulatory state. This event follows by some hours those initiated with the activation of non-repressed, direct Nodal signaling targets such as nodal itself, lefty, pax41, not, etc. We have been unable to discover any targets for the foxg gene in the oral ectoderm while it is transiently expressed there, and this gene is not only repressed by gsc in the oral ectoderm but is also the target there of incoherent feed forward repression from sip1 and ets4. Its transience is further related to the fact that it has neither a direct nor indirect positive feed downstream of Nodal signaling, but instead uses a general pan-ectodermal regulator. Thus its function is to be sought in the CB where it continues to be permanently expressed (Fig.S5), after its transcription is silenced in the oral ectoderm. It could be speculated that it is particularly important to prevent the further expression of foxg in oral ectoderm because it might be used specifically to keep oral ectoderm genes silent in the CB.
Current GRN model directing the progressive process of animal oral ectoderm specification
Formation of the oral ectoderm is a progressive and complicated process. The model shown in Fig.3 illustrates the sequential steps that establish the regulatory states of the cells of this domain. It is likely to include most of the zygotically expressed regulatory genes transcribed specifically in this domain before gastrulation; thereafter the regulatory complexity further increases. The network can be divided into tiers; genes of various tiers are wired in distinct subcircuits that implement the specification process.
The GRN is initially powered by maternally transcribed regulatory genes, of which only a few examples have known roles, or are even identified. The GRNs with which we are concerned are zygotic transcriptional networks, and in general maternal initial inputs are not included explicitly because they lack spatial import. However, occasionally it is useful to identify the drivers of early activated genes. Two examples of such initial inputs are included in the network of Fig.3. These are Soxb1 and α-Otx. Soxb1 is a common activator of many pan-ectodermal genes and also of nodal (Kenny et al., 2003; Range et al., 2007). Similarly, maternal Otx is identified in this work as the driver of early blastula sip1 expression (Fig.5). Otx has been known for its role in controlling ectodermal gene expression for many years (Wei et al., 1995; Yuh et al., 2001). Though a maternal factor, zygotic Otx begins to function during cleavage as it is transported into the embryo nuclei (Chuang et al., 1996).
The first zygotic tier of the GRN model in Fig.3 consists of the nodal gene and genes activated as immediate targets of Nodal signaling, which are transcribed only on the future oral side because of known cis-regulatory mechanisms, rooted in the response of a nodal driver factor to a differential oral/aboral redox gradient which affects its activity (Coffman et al., 2009; Coffman and Davidson, 2001; Coffman et al., 2004; Nam et al., 2007; Range et al., 2007). Expression of nodal and its target genes is a key early step in establishing the regulatory polarity of the embryo, not only by initiating specification of the oral ectoderm per se, but also for other domains of the embryo. For example the not target gene provides an early spatial input necessary for specification of the oral mesoderm (Materna et al., 2012); and an additional nodal target gene encoding the signaling ligand bmp2/4, is required for maintenance and enhancement of the aboral ectoderm regulatory program during the late blastula stage (Ben-Tabou de-Leon et al., 2013).
Spatial complexity soon emerges in the oral ectoderm regulatory state (Fig.1B), driven by the next tier of spatial regulatory gene expressions. At this stage, spatial subdivision functions come into play. gsc and foxg are activated during mid-blastula stage after the repressors encoded by ets4 and sip1 are cleared from the oral ectoderm. The double negative gate confines foxg expression to the oral ectoderm. Subsequently, stomodeal genes are activated within a subdomain of the animal oral ectoderm, through the regulatory repressions underlying the boundaries of this subdomain are not yet known. Additionally, the not and gsc genes are major players in the system that spatially separates the CB/lateral regulatory state from the oral ectoderm regulatory state, as we have seen.
The current GRN model is beginning to explain the developmental spatial subdivision process in terms of its sequence of regulatory gene expressions. The oral ectoderm progressively generates distinct regulatory states arranged in a bilateral oral/aboral pattern, and in a sequential animal/vegetal pattern. When the GRN models of all its subdomains are similarly resolved, this surprisingly complex developmental patterning process will be encompassed in a representation of the underlying causal genomic regulatory code.
Material and Methods
Gene cloning and constructs
The gsc gene was PCR-cloned from a 24 hr cDNA library using the following primers: 5′ CTCATCTAAGTACATCTCGCTGG and 3′ TGTGACATACAATCCACTGC. The full length cDNA was inserted into the pGEM-T Easy vector. To clone the sip1 gene, a RACE reaction was first performed to determine the 5′ end of cDNA sequence using FirstChoice RLM RACE kit (Ambion). Gene-specific primers for sip1 RACE reaction were AGCTGGGACTTGTAGGCAAA and AAACTTGCGATTCCCAGATG. The full length sip1 gene was cloned by PCR using the following primers: 5′ TCCCTGAAACATTTCGTGTG and 3′ CTTAGACCCCAGCGATCTGC. The following primer pair were used to clone ets4, emx, and pax4l genes: ets4: 5′ TCGCTTTGGTGAACAACTCA and 3′ GTCTCTTCGGGCAAGAATGA, emx: 5′ TTGCATACCCGTGTCTCTCA and 3′ CGAATGGTGGAGTAGCCAAT, pax4l: 5′ TCCAAGGATAGACAGGCAGAA and 3′ ATTTGAGGTAGAGATGCATAATCA.
MASO perturbation
Approximately 4 pl MASO solution in 120 mM KCl solution was injected to fertilized eggs for knockdown analysis. The sequences of MASOs used in this research: ets4-MASO1 5′ AGAAACAGAGAGCTGACCACTATGA, ets4-MASO2 5′ GGTTAAAAATACACCTGTAGAGGCA, sip1-MASO1 5′ GGTAATGATACTTCATCACCATACC, sip1-MASO2 5′ GTGCCGACAAGCGTCTCCAAAGTCA. The MASO sequences of nodal, lefty, and not were describe previously. The concentrations for MASO used for micro-injection were 150 uM, 300 uM, 100 uM, 300uM, and 300uM for ets4, sip1, nodal, lefty, and not. Half of the concentrations were used for double MASO injection, except for ets4 (150 uM)/sip1 (200 uM) double injection.
Whole mount in situ hybridization (WMISH)
WMISH was performed as previously reported (Ransick et al., 1993), with some minor modifications. DIG labeled antisense RNA probe was prepared by in vitro transcription, and DNP-labeled probe was prepared using Label-IT nucleic acid labeling kit (Mirus). Genes cloned into pGEM T easy were amplified by PCR using T7 (5′) and SPORT reverse primers (5′), and PCR product was used as template. Labeled RNA probes were purified with G50 columns, and 1 ng/ul probe was used in the hybridization reaction, which was carried out at 65 °C overnight. Post hybridization washes were 2× SSCT for 15 min twice, followed by 0.2× and 0.1× SSCT wash for 20 min each. Antibody incubations were carried out at 4 °C overnight with 1:1000 diluted anti-DIG Fab (Roche). The embryos were extensively washed 6 times with MABT buffer (0.1M maleic acid, 0.15 M NaCl, and 0.1% tween-20), twice with AP buffer (100mM Tris·Cl (pH9.5), 100 mM NaCl, 50mM MgCl2, and 1mM Levamisole) before staining with NBT/BCIP. Double in situ was performed using the same procedure except that the fixed embryos were incubated with both DIG-labeled and DNP-labeled probes. After the first color reaction, embryos were treated with glycine stop solution, and followed by a second antibody incubation with anti-DNP antibody (Mirus). The color reaction was performed using INT/BCIP.
QPCR and nCounter analysis of gene expression
Total RNA was prepared from 200-300 sea urchin embryos using Qiagen RNeasy Micro Kit. For QPCR analysis, reverse transcription was carried out using iScript (BioRad), and reverse transcribed cDNA was used in QPCR reactions (BioRad Cyber Green). For Nanostring analysis of gene expression 200-300 ng total RNA was mixed with reaction buffer, code set, and capture probe. For a description of the codeset see Materna et al. 2010. Following an overnight incubation at 65 °C, the reaction products were processed with the nCounter analysis system. Gene-specific counts were adjusted for differences in hybridization efficiencies by normalizing with the sum of all counts. The probe specific background was subtracted. The cut off for QPCR significance was set at ddCt = 1.6, while that for nCounter was 2-fold.
Cis regulatory analysis using 13-tag system
Tagged reporter constructs were used to identify the cis regulatory modules of the sip1 gene. Various constructs covering the sip1 upstream regions were PCR-amplified using the primers shown in Table S2. The PCR products were fused with the coding frame of the GFP gene, and a tag for QPCR analysis to measure the expression level. Fusion PCR was also used to construct the minimum promoter combining both the distal and the proximate modules, and the mutated minimum promoter with three otx sites removed. The primers set for fusion PCR are listed in Table S2. Mixed constructs were injected into the fertilized sea urchin eggs using a recipe described previously. Embryos injected with tagged constructs were collected at various developmental stages. Genomic DNA and total RNA were prepared to measure the amount of the integrated DNA, and the abundance of the transcripts.
Supplementary Material
Highlights.
sip1 and ets4 selectively repress expression of oral ectodermal genes.
Clearance of repressors sip1 and ets4 downstream of Nodal signaling provides a derepression mechanism controlling oral ectodermal gene expression.
Repressors gsc and not function as domain-specific repressors which define the boundary of the animal oral ectoderm.
Acknowledgement
This work was supported by the NIH grant HD37105 and by the Lucille P. Markey Charitable Trust.
Footnotes
Publisher's Disclaimer: This is a PDF file of an unedited manuscript that has been accepted for publication. As a service to our customers we are providing this early version of the manuscript. The manuscript will undergo copyediting, typesetting, and review of the resulting proof before it is published in its final citable form. Please note that during the production process errors may be discovered which could affect the content, and all legal disclaimers that apply to the journal pertain.
References
- Ben-Tabou de-Leon S, Su YH, Lin KT, Li E, Davidson EH. Gene regulatory control in the sea urchin aboral ectoderm: Spatial initiation, signaling inputs, and cell fate lockdown. Developmental biology. 2013;374:245–254. doi: 10.1016/j.ydbio.2012.11.013. [DOI] [PMC free article] [PubMed] [Google Scholar]
- Bolouri H, Davidson EH. Transcriptional regulatory cascades in development: initial rates, not steady state, determine network kinetics. Proceedings of the National Academy of Sciences of the United States of America. 2003;100:9371–9376. doi: 10.1073/pnas.1533293100. [DOI] [PMC free article] [PubMed] [Google Scholar]
- Bolouri H, Davidson EH. The gene regulatory network basis of the “community effect,” and analysis of a sea urchin embryo example. Developmental biology. 2010;340:170–178. doi: 10.1016/j.ydbio.2009.06.007. [DOI] [PMC free article] [PubMed] [Google Scholar]
- Cameron RA, Hough-Evans BR, Britten RJ, Davidson EH. Lineage and fate of each blastomere of the eight-cell sea urchin embryo. Genes & development. 1987;1:75–85. doi: 10.1101/gad.1.1.75. [DOI] [PubMed] [Google Scholar]
- Chuang CK, Wikramanayake AH, Mao CA, Li X, Klein WH. Transient appearance of Strongylocentrotus purpuratus Otx in micromere nuclei: cytoplasmic retention of SpOtx possibly mediated through an alpha-actinin interaction. Developmental genetics. 1996;19:231–237. doi: 10.1002/(SICI)1520-6408(1996)19:3<231::AID-DVG6>3.0.CO;2-A. [DOI] [PubMed] [Google Scholar]
- Coffman JA, Coluccio A, Planchart A, Robertson AJ. Oral-aboral axis specification in the sea urchin embryo III. Role of mitochondrial redox signaling via H2O2. Developmental biology. 2009;330:123–130. doi: 10.1016/j.ydbio.2009.03.017. [DOI] [PMC free article] [PubMed] [Google Scholar]
- Coffman JA, Davidson EH. Oral-aboral axis specification in the sea urchin embryo. I. Axis entrainment by respiratory asymmetry. Developmental biology. 2001;230:18–28. doi: 10.1006/dbio.2000.9996. [DOI] [PubMed] [Google Scholar]
- Coffman JA, McCarthy JJ, Dickey-Sims C, Robertson AJ. Oral-aboral axis specification in the sea urchin embryo II. Mitochondrial distribution and redox state contribute to establishing polarity in Strongylocentrotus purpuratus. Developmental biology. 2004;273:160–171. doi: 10.1016/j.ydbio.2004.06.005. [DOI] [PubMed] [Google Scholar]
- Croce J, Lhomond G, Gache C. Expression pattern of Brachyury in the embryo of the sea urchin Paracentrotus lividus. Development genes and evolution. 2001;211:617–619. doi: 10.1007/s00427-001-0200-5. [DOI] [PubMed] [Google Scholar]
- Damle S, Davidson EH. Precise cis-regulatory control of spatial and temporal expression of the alx-1 gene in the skeletogenic lineage of s. purpuratus. Developmental biology. 2011;357:505–517. doi: 10.1016/j.ydbio.2011.06.016. [DOI] [PMC free article] [PubMed] [Google Scholar]
- Duboc V, Rottinger E, Besnardeau L, Lepage T. Nodal and BMP2/4 signaling organizes the oral-aboral axis of the sea urchin embryo. Developmental cell. 2004;6:397–410. doi: 10.1016/s1534-5807(04)00056-5. [DOI] [PubMed] [Google Scholar]
- Howard-Ashby M, Materna SC, Brown CT, Chen L, Cameron RA, Davidson EH. Identification and characterization of homeobox transcription factor genes in Strongylocentrotus purpuratus, and their expression in embryonic development. Dev Biol. 2006;300:74–89. doi: 10.1016/j.ydbio.2006.08.039. [DOI] [PubMed] [Google Scholar]
- Kenny AP, Oleksyn DW, Newman LA, Angerer RC, Angerer LM. Tight regulation of SpSoxB factors is required for patterning and morphogenesis in sea urchin embryos. Developmental biology. 2003;261:412–425. doi: 10.1016/s0012-1606(03)00331-2. [DOI] [PubMed] [Google Scholar]
- Li E, Materna SC, Davidson EH. Direct and indirect control of oral ectoderm regulatory gene expression by Nodal signaling in the sea urchin embryo. Developmental biology. 2012;369:377–385. doi: 10.1016/j.ydbio.2012.06.022. [DOI] [PMC free article] [PubMed] [Google Scholar]
- Materna SC, Howard-Ashby M, Gray RF, Davidson EH. The C2H2 zinc finger genes of Strongylocentrotus purpuratus and their expression in embryonic development. Dev Biol. 2006;300:108–120. doi: 10.1016/j.ydbio.2006.08.032. [DOI] [PubMed] [Google Scholar]
- Materna SC, Nam J, Davidson EH. High accuracy, high-resolution prevalence measurement for the majority of locally expressed regulatory genes in early sea urchin development. Gene expression patterns: GEP. 2010;10:177–184. doi: 10.1016/j.gep.2010.04.002. [DOI] [PMC free article] [PubMed] [Google Scholar]
- Materna SC, Ransick A, Li E, Davidson EH. Diversification of oral and aboral mesodermal regulatory states in pregastrular sea urchin embryos. Developmental biology. 2012 doi: 10.1016/j.ydbio.2012.11.033. [DOI] [PMC free article] [PubMed] [Google Scholar]
- Nam J, Dong P, Tarpine R, Istrail S, Davidson EH. Functional cis-regulatory genomics for systems biology. Proceedings of the National Academy of Sciences of the United States of America. 2010;107:3930–3935. doi: 10.1073/pnas.1000147107. [DOI] [PMC free article] [PubMed] [Google Scholar]
- Nam J, Su YH, Lee PY, Robertson AJ, Coffman JA, Davidson EH. Cis-regulatory control of the nodal gene, initiator of the sea urchin oral ectoderm gene network. Dev Biol. 2007;306:860–869. doi: 10.1016/j.ydbio.2007.03.033. [DOI] [PMC free article] [PubMed] [Google Scholar]
- Oliveri P, Tu Q, Davidson EH. Global regulatory logic for specification of an embryonic cell lineage. Proceedings of the National Academy of Sciences of the United States of America. 2008;105:5955–5962. doi: 10.1073/pnas.0711220105. [DOI] [PMC free article] [PubMed] [Google Scholar]
- Peter IS, Davidson EH. Modularity and design principles in the sea urchin embryo gene regulatory network. FEBS letters. 2009;583:3948–3958. doi: 10.1016/j.febslet.2009.11.060. [DOI] [PMC free article] [PubMed] [Google Scholar]
- Peter IS, Davidson EH. The endoderm gene regulatory network in sea urchin embryos up to mid-blastula stage. Dev. Biol. 2010;340:188–199. doi: 10.1016/j.ydbio.2009.10.037. [DOI] [PMC free article] [PubMed] [Google Scholar]
- Peter IS, Davidson EH. A gene regulatory network controlling the embryonic specification of endoderm. Nature. 2011;474:635–639. doi: 10.1038/nature10100. [DOI] [PMC free article] [PubMed] [Google Scholar]
- Peter IS, Faure E, Davidson EH. Predictive computation of genomic logic processing functions in embryonic development. Proceedings of the National Academy of Sciences of the United States of America. 2012;109:16434–16442. doi: 10.1073/pnas.1207852109. [DOI] [PMC free article] [PubMed] [Google Scholar]
- Range R, Lapraz F, Quirin M, Marro S, Besnardeau L, Lepage T. Cis-regulatory analysis of nodal and maternal control of dorsal-ventral axis formation by Univin, a TGF-beta related to Vg1. Development. 2007;134:3649–3664. doi: 10.1242/dev.007799. [DOI] [PubMed] [Google Scholar]
- Ransick A, Ernst S, Britten RJ, Davidson EH. Whole mount in situ hybridization shows Endo 16 to be a marker for the vegetal plate territory in sea urchin embryos. Mech Dev. 1993;42:117–124. doi: 10.1016/0925-4773(93)90001-e. [DOI] [PubMed] [Google Scholar]
- Rizzo F, Fernandez-Serra M, Squarzoni P, Archimandritis A, Arnone MI. Identification and developmental expression of the ets gene family in the sea urchin (Strongylocentrotus purpuratus) Developmental biology. 2006;300:35–48. doi: 10.1016/j.ydbio.2006.08.012. [DOI] [PubMed] [Google Scholar]
- Saudemont A, Haillot E, Mekpoh F, Bessodes N, Quirin M, Lapraz F, Duboc V, Röttinger E, Range R, Oisel A, Besnardeau L, Wincker P, Lepage T. Ancestral regulatory circuits governing ectoderm patterning downstream of nodal and BMP2/4 revealed by gene regulatory network analysis in an echinoderm. PLoS Genetics. 2010;6:1–31. doi: 10.1371/journal.pgen.1001259. [DOI] [PMC free article] [PubMed] [Google Scholar]
- Smith J, Theodoris C, Davidson EH. A gene regulatory network subcircuit drives a dynamic pattern of gene expression. Science. 2007;318:794–797. doi: 10.1126/science.1146524. [DOI] [PubMed] [Google Scholar]
- Su YH, Li E, Geiss GK, Longabaugh WJ, Kramer A, Davidson EH. A perturbation model of the gene regulatory network for oral and aboral ectoderm specification in the sea urchin embryo. Developmental biology. 2009;329:410–421. doi: 10.1016/j.ydbio.2009.02.029. [DOI] [PMC free article] [PubMed] [Google Scholar]
- Wei Z, Angerer LM, Angerer RC. Spatially regulated SpEts4 transcription factor activity along the sea urchin embryo animal-vegetal axis. Development. 1999a;126:1729–1737. doi: 10.1242/dev.126.8.1729. [DOI] [PubMed] [Google Scholar]
- Wei Z, Angerer LM, Gagnon ML, Angerer RC. Characterization of the SpHE promoter that is spatially regulated along the animal-vegetal axis of the sea urchin embryo. Developmental biology. 1995;171:195–211. doi: 10.1006/dbio.1995.1271. [DOI] [PubMed] [Google Scholar]
- Wei Z, Angerer RC, Angerer LM. Identification of a new sea urchin ets protein, SpEts4, by yeast one-hybrid screening with the hatching enzyme promoter. Mol Cell Biol. 1999b;19:1271–1278. doi: 10.1128/mcb.19.2.1271. [DOI] [PMC free article] [PubMed] [Google Scholar]
- Yaguchi J, Angerer LM, Inaba K, Yaguchi S. Zinc finger homeobox is required for the differentiation of serotonergic neurons in the sea urchin embryo. Developmental biology. 2012;363:74–83. doi: 10.1016/j.ydbio.2011.12.024. [DOI] [PMC free article] [PubMed] [Google Scholar]
- Yaguchi S, Yaguchi J, Burke RD. Sp-Smad2/3 mediates patterning of neurogenic ectoderm by nodal in the sea urchin embryo. Developmental biology. 2007;302:494–503. doi: 10.1016/j.ydbio.2006.10.010. [DOI] [PubMed] [Google Scholar]
- Yuh CH, Li X, Davidson EH, Klein WH. Correct Expression of spec2a in the sea urchin embryo requires both Otx and other cis-regulatory elements. Developmental biology. 2001;232:424–438. doi: 10.1006/dbio.2001.0207. [DOI] [PubMed] [Google Scholar]
Associated Data
This section collects any data citations, data availability statements, or supplementary materials included in this article.


