

Abstract
Recently we showed that pharmacological blockade or genetic deficiency of arginase-2 confers kidney protection in diabetic mouse models. Here we tested whether the protective effect of arginase inhibition is nitric oxide synthase-3 (eNOS)-dependent in diabetic nephropathy. Experiments were conducted in eNOS knockout and their wild type littermate mice using multiple low doses of vehicle or streptozotocin and treated with continuous subcutaneous infusion of vehicle or the arginase inhibitor S-(2-Boronoethyl)-L-cysteine by an osmotic pump. Inhibition of arginases for 6 weeks in diabetic wild type mice significantly attenuated albuminuria, the increase in plasma creatinine and blood urea nitrogen, histopathological changes, kidney fibronectin and TNF-α expression, kidney macrophage recruitment, and oxidative stress compared to vehicle-treated diabetic wild type mice. Arginase inhibition in diabetic eNOS knockout mice failed to affect any of these parameters but reduced kidney macrophage recruitment and kidney TNF-α expression compared to vehicle-treated diabetic eNOS knockout mice. Furthermore, diabetic wild type and eNOS knockout mice exhibited increased kidney arginase-2 protein, arginase activity and ornithine levels. Thus, arginase inhibition mediates renal tissue protection in diabetic nephropathy by an eNOS-dependent mechanism and has an eNOS-independent effect on kidney macrophage recruitment.
Introduction
Diabetic nephropathy (DN) is the leading cause of end stage kidney disease, responsible for over 40% of all cases in the US and this number is likely to increase unabated.1 Thus it is important to identify the mechanisms involved in the development of diabetic kidney disease. Early alterations in diabetic kidneys include the development of glomerular hyperfiltration and hypertrophy, followed by thickening of the glomerular basement membrane (GBM), mesangial matrix accumulation, increased urinary albumin excretion (UAE) rate and ultimately progression to glomerular sclerosis and end-stage renal failure.
Endothelial cell dysfunction is a central pathophysiological mechanism that contributes to diabetes and DN. Endothelial dysfunction, characterized by reduced bioavailability of nitric oxide (NO) and increased oxidative stress, is a hallmark characteristic in diabetes2 and DN.3 NO is produced from L-arginine by NO synthases (NOS). Under conditions of low arginine level or hyperglycemia, eNOS is uncoupled, producing reactive oxygen species in lieu of NO.4,5 Recently, low or lack of eNOS has been shown to exacerbate DN;6,7 thus, elucidating the basis for vascular dysfunction in DN is critical.8
The metabolism of L-arginine is of great interest because it involves a wide range of physiological and pathophysiological conditions and plays important roles in many different kind of diseases.9 Dramatic alterations in arginine metabolism occur in endothelial injury10–12 due to changes in the activity and/or expression of arginases. Arginase-2 is constitutively expressed and also inducible in endothelial cells10–12 as well as in kidney cells13,14 and, when elevated, can inhibit NOS activity/expression and induce endothelial NOS uncoupling, thus reducing NO bioavailability and inhibiting the NO/cGMP pathway. In contrast, arginase-1 is not normally expressed in the kidney.15,16 In vivo inhibition of arginases improved vascular function and high blood pressure,17 allergen-induced airway obstruction,18,19 liver ischemia/reperfusion injury,20,21 autoimmune encephalitis,22 erectile function23 and DN.16
Our recent publication16 showed that pharmacological blockade of arginases or genetic deficiency of arginase-2 confers kidney protection in diabetic kidney disease. However, its mechanism(s) of action was not clear at that time. Because arginases can modulate NO production by catabolizing arginine, we hypothesized that the protective effect of arginase inhibition is eNOS-dependent in DN. In the current study, we found that arginase inhibition mediates renal tissue protection in DN via an eNOS-dependent mechanism. In contrast, arginase inhibition has an eNOS-independent effect on kidney macrophage recruitment.
Results
Arginase inhibition reduces characteristics of DN in eNOS+/+ but not eNOS−/− mice
To assess the possible role of endothelial NOS in the mechanism(s) of arginase effects in diabetic mice kidney, we infused continuously the arginase inhibitor BEC or vehicle into diabetic eNOS−/− mice and their wild-type eNOS+/+ for 6 weeks. As shown in Table 1, vehicle-treated diabetic eNOS+/+ mice had increased blood glucose levels, decreased body weight, increased kidney weight/body weight ratio and reduced fluid composition compared to normal eNOS+/+ mice. Arginase inhibition of diabetic eNOS+/+ mice significantly increased body weight and reduced kidney weight/body weight ratio without affecting other measurements. In contrast, arginase inhibition of diabetic eNOS−/− mice failed to affect any measurements. As expected, blood pressure was significantly elevated in eNOS−/− groups compared to eNOS+/+ groups.
Table 1.
General characteristics of eNOS+/+ and eNOS−/− mice
| Treatment | Week 6
|
|||||
|---|---|---|---|---|---|---|
| eNOS+/+ | eNOS−/− | |||||
|
| ||||||
| Normal | Diabetes+vehicle | Diabetes+BEC | Normal | Diabetes+vehicle | Diabetes+BEC | |
| Animal # | 5 | 6 | 8 | 4 | 8 | 8 |
|
| ||||||
| Body Weight (g) | 25±1 | 20±1 a | 25±1 | 28±1 | 21±1 b | 23±1 |
| Blood Glucose (mg/dL) | 149±2 c | 499±17 | 434±27 | 198±14 d | 483.±12 | 473±23 |
| SBP (mmHg) | 136±3 | 130±4 | 135±7 | 148±4.227 e | 150±4 | 147±5 |
| Kidney/Body Weight (mg/g) | 0.59±0.02 | 0.97±0.09 f | 0.66±0.06 | 0.58±0.05 g | 0.82±0.07 | 0.72±0.05 |
| % Fluid | 7.04±0.02 | 5.95±0.17 | 6.69±0.80 | 6.63±0.19 | 5.56±0.271 | 5.54±0.22 |
| Plasma BUN (mg/dL) | 23±3.02 | 33.83±4.74 h | 26±1.08 | 30.25±1.65 i | 43.22±4.51 | 41.25±3.83 |
| Plasma Creatinine (mg/dL) | 0.14±0.02 | 0.29±0.02 j | 0.12±0.021 | 0.17±0.09 k | 0.35±0.04 | 0.41±0.11 |
Data are mean±SEM; SBP: Systolic blood pressure; BUN: Blood urea nitrogen
P<0.01 compared to eNOS+/+ normal and diabetes+BEC groups.
P<0.01 compared to eNOS−/− normal group.
P<0.01 compared to eNOS+/+ diabetes+vehicle and diabetes+BEC groups.
P<0.01 compared to eNOS−/− diabetes+vehicle and diabetes+BEC groups.
P<0.05 compared to eNOS+/+ normal group.
P<0.05 compared to eNOS+/+ normal and diabetes+BEC groups.
P<0.05 compared to eNOS−/− diabetes+vehicle and diabetes+BEC groups.
P<0.05 compared to eNOS+/+ normal and diabetes+BEC groups.
P<0.05 compared to eNOS−/− normal and diabetes+BEC groups.
P<0.05 compared to eNOS+/+ normal and diabetes+BEC groups.
P<0.05 compared to eNOS−/− normal and diabetes+BEC groups.
Inhibition of arginases reduces albuminuria, plasma creatinine and blood urea nitrogen in diabetic eNOS+/+ but not eNOS−/− mice
We next measured 24-hr UAE, plasma creatinine and blood urea nitrogen (BUN) as indicators of renal injury in diabetic eNOS+/+ and eNOS−/− mice with and without BEC treatment. BEC-treated diabetic eNOS+/+ mice significantly reduced the increase in UAE (Fig. 1A), albumin/creatinine ratio (Fig. 1B), plasma creatinine and BUN (Table 1) compared to vehicle-treated diabetic eNOS+/+ mice following 6 weeks of STZ- induced diabetes. These parameters were increased also in diabetic eNOS−/− mice but, in marked contrast to the effects of BEC in diabetic eNOS+/+ mice, BEC treatment of diabetic eNOS−/− mice failed to reduce the increases in any of these parameters.
Figure 1. Arginase inhibition reduces increases in urinary albuminuria in diabetic eNOS+/+; but not eNOS−/− mice.

eNOS−/− and their wild type littermate mice were treated with BEC or vehicle via osmotic minipump for 6 weeks. Urine was collected for measurement of UAE (A) or albumin/creatinine ratio (B). Open bar, normal group; black-filled bar, vehicle-treated diabetic groups; grey-filled bar, BEC-treated groups. Results are means ± SEM.
Inhibition of arginases decreases renal histopathological changes and fibronectin expression in diabetic eNOS+/+ but not eNOS−/− mice
Periodic acid-Schiff (PAS) staining of kidney sections showed increased glomerular cellularity and mesangial expansion in vehicle-treated diabetic vs. normal eNOS+/+ mice (score: 0.99±0.09 vs. 0.19±0.01, p<0.01) after 6 weeks of diabetes (Fig. 2). Inhibition of arginases in diabetic eNOS+/+ mice resulted in significantly reduced glomerular changes (scores: 0.6±0.06; p<0.01) compared to vehicle-treated eNOS+/+ mice. In contrast, inhibition of arginases in diabetic eNOS−/− mice failed to reduce glomerular changes, which remained similar to those in vehicle-treated eNOS−/− mice (score: 1.3±0.08 vs. 1.1±0.06); respectively (Fig. 2). Similar results were obtained using RT-PCR for kidney fibronectin expression as a fibrotic marker. As shown in Fig. 3A, vehicle-treated eNOS+/+ mice showed a 3.5-fold increase in fibronectin mRNA (p<0.001) compared with normal eNOS+/+ mice, an effect attenuated by BEC treatment (p<0.05 to vehicle-treated diabetic mice). In contrast, inhibition of arginases in diabetic eNOS−/− mice failed to reduce fibronectin mRNA expression.
Figure 2. Arginase inhibition reduces histological changes in diabetic eNOS+/+; but not eNOS−/− mice.
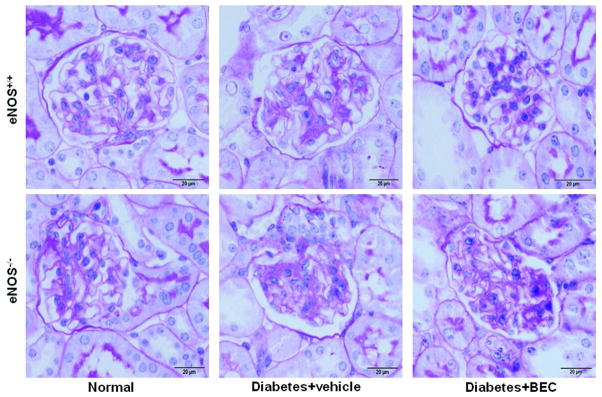
Sections were stained with PAS and images were taken with 100x (oil) objective with a total magnification of 1000x. Images are representative of 4–8 mice in each group. Semiquantitative scores (0–4+) were assigned based on the masked readings, where 0 represents no lesion, and 1, 2, 3, and 4+ represent mesangial matrix expansion or sclerosis, involving ≤25, 25 to 50, 50 to 75, or >75% of the glomerular tuft area, respectively.
Figure 3. Effect of arginase inhibition on kidney fibronectin and TNF-α expression in diabetic eNOS+/+ and eNOS−/− mice.

RT-PCR was performed on whole mouse kidney total RNA after 6 weeks following diabetes. Fibronectin (A) and TNF-α (B) mRNA expression were normalized with GAPDH mRNA. Open bar, normal group; black-filled bar, vehicle-treated diabetic groups; grey-filled bar, BEC-treated groups. Results are means ± SEM.
Inhibition of arginases decreases macrophage recruitment and TNF-α expression in diabetic eNOS+/+ and eNOS−/− mice
To determine whether arginase is critical for macrophage infiltration in DN and whether that effect is dependent on endothelial NOS, we show the distribution and quantitation of macrophages in kidneys by immunohistochemistry (Mac-2 positive macrophages) (Fig. 4). As expected, vehicle-treated eNOS+/+ mice showed significant increases in glomerular macrophages (2.4±0.2 macrophages/glomerulus; p<0.01) compared with normal eNOS+/+ mice (0.9±0.1 macrophages/glomerulus). Inhibition of arginases in diabetic eNOS+/+ mice resulted in significantly reduced glomerular macrophage recruitment (1.2±0.03 macrophages/glomerulus; p<0.01) compared to vehicle-treated eNOS+/+ mice following 6 weeks of diabetes. Similarly, vehicle-treated eNOS−/− mice showed significant increases in glomerular macrophages (2.4±0.2 macrophages/glomerulus; p<0.01) compared with normal eNOS−/− mice (0.9±0.06 macrophages/glomerulus). Interestingly, inhibition of arginases in diabetic eNOS−/− mice still reduced glomerular macrophage recruitment (1.3±0.08 macrophages/glomerulus; p<0.01) compared to vehicle-treated eNOS−/− mice following 6 weeks of diabetes. Similar results were obtained using RT-PCR for kidney TNF-α expression as an inflammatory marker. As shown in Fig. 3B, vehicle-treated eNOS+/+ mice showed a 2.5-fold increase in TNF-α mRNA (p<0.001) compared with normal eNOS+/+ mice, an effect completely reduced by BEC treatment (p<0.005) compared to vehicle-treated diabetic mice. Interestingly, inhibition of arginases in diabetic eNOS−/− mice still reduced TNF-α mRNA (p<0.05) compared to vehicle-treated eNOS−/− mice following 6 weeks of diabetes.
Figure 4. Arginase inhibition reduces macrophage infiltration in diabetic eNOS+/+ and eNOS−/− mice.

Mac-2-positive macrophages in glomeruli were identified by immunohistochemical staining after 6 weeks following diabetes. Images are representative of 40 fields from 4–8 mice in each group.
Inhibition of arginases increases eNOS protein expression in diabetic eNOS+/+ mice
To determine whether arginase inhibition has an effect on kidney eNOS protein expression, we used western blot analysis for total kidney homogenates of eNOS in eNOS+/+ mice. Our data show significant increase in eNOS expression using arginase inhibitor compared to normal and vehicle-treated diabetic kidneys (Fig. 5A).
Figure 5. Effect of arginase inhibition on kidney eNOS protein expression and urinary TBARS in diabetic mice.
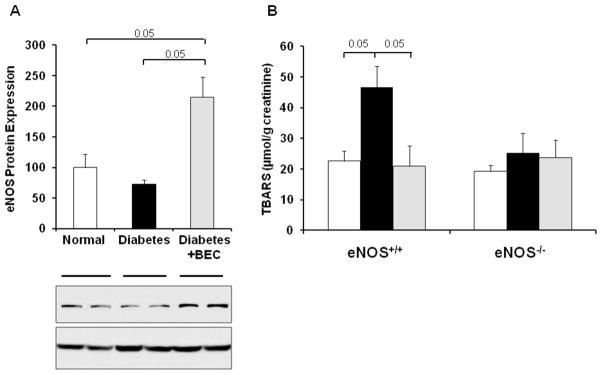
A) Western-blot was performed to evaluate eNOS expression in kidney lysates at 6 weeks following diabetes in eNOS+/+ mice. β-actin was used as a loading control. Quantification of eNOS expression was performed by densitometry followed by normalization to β-actin B) Urine was collected for measurement of TBARS levels. Open bar, normal group; black-filled bar, vehicle-treated diabetic groups; grey-filled bar, BEC-treated groups. Results are means ± SEM.
Inhibition of arginases decreases urinary TBARS in diabetic eNOS+/+ but not eNOS−/− mice
We next assessed urinary TBARS as an indicator for oxidative stress. Urinary TBARS levels were significantly elevated in diabetic eNOS+/+ mice, but BEC-treatment completely prevented this increase in urinary TBARS (Fig. 5B). In contrast, urinary TBARS levels were not significantly different between all groups in eNOS−/− mice and also did not differ from TBARS levels in normal eNOS+/+ mice.
Inhibition of arginases decreases kidney ornithine levels in diabetic eNOS+/+ and eNOS−/− mice
To determine whether arginase inhibition was effective in both diabetic eNOS+/+ and eNOS−/− mice, we measured kidney ornithine levels (Fig. 6) as an index of arginase activity. Kidney ornithine levels were significantly increased in both vehicle-treated diabetic eNOS+/+ and eNOS−/− mice. BEC-treated diabetic eNOS+/+ and eNOS−/− mice had significantly reduced kidney ornithine levels following 6 weeks of STZ-induced diabetes.
Figure 6. Arginase inhibition reduces kidney ornithine levels in diabetic eNOS+/+ and eNOS−/− mice.

Kidney ornithine levels were assayed in kidney lysates prepared at 6 weeks following STZ-induced diabetes using a LC-MS system. Open bar, normal group; black-filled bar, vehicle-treated diabetic groups; grey-filled bar, BEC-treated groups. Results are means ± SEM.
Arginase-2 expression in diabetic eNOS+/+ and eNOS−/− mice
Our previous study16 showed increased arginase-2 expression in diabetic kidneys. Whether inhibition of arginase has an effect on kidney arginase-2 expression in diabetic mice was not clear at that time. Here we confirm increased arginase-2 protein expression in both diabetic eNOS+/+ and eNOS−/− mice (Fig. 7). Interestingly, inhibition of arginase was associated with a further increase in arginase-2 protein expression in diabetic eNOS+/+ mice but not in diabetic eNOS−/− mice.
Figure 7. Arginase-2 expression is induced in diabetic eNOS+/+ and eNOS−/− mice.

Western-blot was performed to evaluate arginase-2 expression in kidney lysates from indicated groups of mice at 6 weeks following STZ-induced diabetes. β-actin was used as a loading control (A). Quantification of arginase-2 expression was performed by densitometry followed by normalization to β-actin (B). Open bar, normal group; black-filled bar, vehicle-treated diabetic groups; grey-filled bar, BEC-treated groups. Results are means ± SEM.
Kidney arginase activity in diabetic eNOS+/+ and eNOS−/− mice
Similar to kidney arginase-2 protein expression measured by Western blot (Fig. 7), kidney arginase activity measured in vitro was significantly increased in both diabetic eNOS+/+ and eNOS−/− mice (Fig. 8). Inhibition of arginase was associated with a further increase in kidney arginase activity in diabetic eNOS+/+ mice but not in diabetic eNOS−/− mice. It is important to emphasize that in vitro measurements of arginase activity only demonstrate that levels of arginase-2 protein correlate with levels of enzymatically competent arginase-2. Owing to the 40-fold dilution of kidney protein and metabolites during tissue extraction and in the activity assay, plus the very high concentration of arginine in the assay (50 mM), the in vivo inhibition of arginase activity in animals that are receiving the competitive arginase inhibitor BEC will not be apparent in the in vitro assay.
Figure 8. Kidney arginase activity is induced in diabetic eNOS+/+ and eNOS−/− mice.
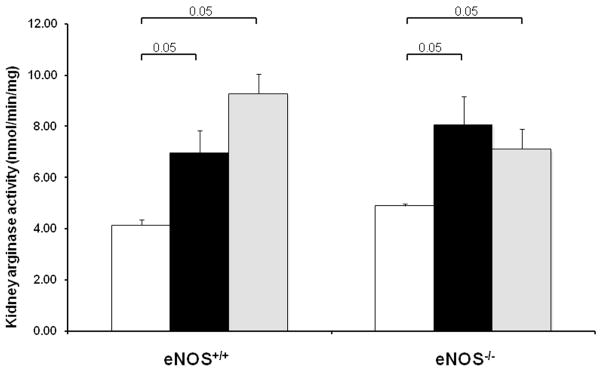
Arginase activities were assayed in kidney lysates prepared at 6 weeks following STZ-induced diabetes. Open bar, normal group; black-filled bar, vehicle-treated diabetic groups; grey-filled bar, BEC-treated groups. Results are means ± SEM.
Discussion
Our previous publication demonstrated that pharmacological blockade or genetic deficiency of arginase-2 confers kidney protection in diabetic mouse models.16 However the exact mechanism by which the inhibition of arginase mediates these effects was not clear. The current study shows that arginase inhibition mediates renal tissue protection in DN indirectly via eNOS. In addition, arginase inhibition has an eNOS-independent effect on kidney macrophage recruitment. Whether the effect of arginase inhibition is mediated strictly via eNOS expressed in endothelial cells or via eNOS expressed in non-endothelial cells such as mesangial and tubular cells cannot be determined from the present study. Additional studies using mice with cell-specific knockouts of eNOS expression are needed to explore this.
Alteration in endothelial function is a common underlying event for vascular abnormalities observed in patients with diabetes, insulin resistance, glucose intolerance, hypertension, and peripheral vascular disease. The role of endothelial cell dysfunction in DN is well established (for review;24) and is mainly due to alteration of NO bioavailability and/or action. NO is produced from arginine by NOS. Recently, low or lack of eNOS has been shown to exacerbate DN;6,7 thus, elucidating the basis for vascular dysfunction in DN is critical.8 Arginase catalyzes hydrolysis of L-arginine to L-ornithine and urea and thus can compete with NOS for the common substrate L-arginine.25 Depending on stimulus, either or both arginases may be expressed and induced in macrophages, endothelial cells, and other cell types.9,26
To examine the mechanism of arginase inhibition in DN, we investigated the effects of inhibiting arginases on kidney dysfunction, glomerular histopathological changes and macrophage recruitment using BEC in eNOS−/− and their wild type littermate diabetic mouse model. BEC significantly ameliorated diabetic albuminuria and was associated with reduced glomerular pathology and kidney fibronectin expression in diabetic eNOS+/+ mice, confirming our previous finding.16 In contrast to the above findings, BEC treatment failed to affect renal functional, histological changes or kidney fibronectin expression in diabetic eNOS−/− mice. Increased expression of fibronectin is an early event in the pathogenesis of diabetic renal disease and its accumulation in the kidney is thought to lead to the development of glomerulosclerosis. 27,28 In diabetes, both TGF-β and fibronectin stimulate matrix production and block matrix degradation.29,30 Taken together, our results indicate a direct interaction between arginase blockade and eNOS-derived NO and support the concept that arginase inhibition mediates renal tissue protection through its effect on eNOS.
We further investigated the effect of arginase inhibition on kidney macrophage recruitment and TNF-α expression. Macrophages/monocytes are a heterogeneous population that plays a pivotal role in different stages of inflammation in multiple organs. For instance, macrophages play an important role in inducing renal injuries through potent cytokines such as MCP-1,31–33 TNFα,34 and IL-1.35 Our data show that the renal protective effect of BEC correlates with a significant reduction of kidney macrophage infiltration and TNF-α expression in diabetic eNOS+/+ mice. Interestingly, BEC treatment still correlates with a significant reduction of kidney macrophage infiltration and TNF-α expression in diabetic eNOS−/− mice despite absence of effect on renal functional and histological changes, indicating an effect of arginase inhibition on macrophage recruitment that is independent of endothelial NOS. TNF-α is mainly produced by monocytes/macrophages and has been associated with increased vascular endothelial permeability in diabetes. A recent report 36 supports our data and indicates that targeted disruption of arginase-2 in mice directly suppresses macrophage proinflammatory responses through mitochondrial ROS production, reduction of monocyte/macrophage adhesion activity to endothelial cells, and reduction of TNF-α mRNA and protein expression.
We have shown previously that renal interstitial fluid of NO is significantly reduced in diabetic rats.37 The reduction in NO during diabetes could be due to NO quenching,38 inhibition of both Ca2+-dependent and -independent NOS activities,39 ROS production,5,40,41 a decrease in NOS activity,42 NO capture by glucose,43 and/or reduction in angiotensin AT2 receptor.44 An increase in arginase activity could be another reason for reduced NO during diabetes. Therefore, we questioned if arginase inhibition regulates eNOS expression in DN. Our data show increased renal eNOS protein expression using arginase inhibitor in diabetic eNOS+/+ mice. The effects of arginase activity and arginase inhibition on NO production were evaluated by measuring kidney nitric oxide end products (nitrate + nitrite) in nondiabetic and in BEC- and vehicle-treated diabetic mice. STZ treatment resulted in a significant reduction in kidney nitrate + nitrite, but this reduction was largely prevented by arginase inhibition (Supplemental Fig. 1). Moreover, a recent report provided evidence for eNOS uncoupling and increased ROS and oxidative stress in kidneys of diabetic spontaneously hypertensive (SHR) rats.41 Whether arginase inhibition has an effect on eNOS uncoupling is not completely clear. However, our urinary TBARS data suggests that arginase inhibition reduces oxidative stress in DN via an eNOS-dependent mechanism. This conclusion is consistent with published data indicating that L-NAME has no significant effect on TBARS levels in endothelial cells derived from eNOS−/− mice.45
Our previous publication showed that arginase-2 but not arginase-1 is expressed and induced in diabetic mouse kidney.16 In addition, we and others have shown that overall arginase activity in the kidney is due almost entirely to arginase-2.16,46 Our data demonstrate increased kidney arginase-2 expression and kidney arginase activity in both diabetic eNOS+/+ and eNOS−/− mice. BEC treatment in both diabetic eNOS+/+ and eNOS−/− mice did not reduce arginase-2 expression as measured by Western blot or in vitro activity assay. This result was not unexpected because BEC is a competitive inhibitor of arginase activity, not an inhibitor of arginase expression or an irreversible inhibitor of arginase activity. However, the fact that BEC treatment in diabetic eNOS+/+ but not in eNOS−/− mice was associated with further increases in arginase-2 expression suggests a possible regulatory role of eNOS-derived NO “either directly or indirectly” on kidney arginase-2 expression. We speculate that eNOS activity can affect kidney arginase activity and protein expression in diabetes. Importantly, the fact that BEC reduced kidney ornithine levels in both in both diabetic eNOS+/+ and diabetic eNOS−/− mice is consistent with inhibition of renal arginase activity in vivo. However, because kidney is the primary site for the first step of creatine synthesis, which also produces ornithine, we cannot conclusively rule out the possibility that changes in creatine synthesis rate also may contribute to the observed changes in kidney ornithine levels.
In conclusion, our study demonstrates the mechanism of renal tissue protection using an arginase inhibitor as well as its important interaction with NO in DN. This conclusion is based on two novel observations: First, we demonstrated that the protective effect of arginase inhibition in DN is mediated via endothelial NOS. Second, we showed that arginase inhibition has an eNOS-independent effect on kidney macrophage recruitment.
Materials and Methods
Diabetic mouse model
All the animal experiments were approved by the Penn State University College of Medicine Institutional Animal Care and Use Committee. Endothelial NOS deficient (eNOS−/−, stock # 2684 on C57BL/6J background) and wild type (eNOS+/+) mice (6–8 weeks old) were purchased from Jackson laboratory (Bar Harbor, MN, USA). Diabetes was induced by streptozotocin (STZ, Sigma, St. Louis, MO) injection intraperitoneally (50mg/kg body weight) for 5 consecutive days. S-(2-Boronoethyl)-L-cysteine (BEC) was administered by continuous subcutaneous infusion via a mini-osmotic pump (Alzet, Durect Corporation, Cupertino, CA) after confirming high blood glucose levels in diabetic mice (5 days after the last dose of STZ injection) as described previously.16 After 6 weeks of diabetes, the mice were sacrificed, kidneys were removed and plasma was collected for further studies.
Blood pressure measurement
Systolic blood pressure was measured using Coda blood pressure system (Kent Scientific Corp, Torrington, Connecticut) as previously described.16,27 Mice were habituated to the blood pressure measurement for 5 days before the day of the experiment and then were allowed to rest quietly for 15 minutes at room temperature. All measurements were performed at the same time for all groups to prevent any diurnal variations.
Histology and immunohistochemistry
Mouse kidneys were fixed in 4% paraformaldehyde, embedded in paraffin, and 3-μm sections were cut. Sections were stained with periodic acid Schiff (PAS). All glomeruli within the section (between 50–107 glomeruli) were scored individually at 40× in a blinded manner and then averaged (n=4–8 mouse in each group; Table 1). All images were taken with an Olympus BX51 microscope and DP71 digital camera using cellSens Standard 1.6 imaging software (Olympus America, Center Valley, PA). Images were obtained with 100× (oil) objective with a total magnification of 1000×. Semiquantitative scores (0–4+) were assigned based on the masked readings. The mesangial matrix expansion or sclerosis scoring was performed as described previously.16,27 Briefly, each glomerulus on a single section was graded from 0 to 4+, where 0 represents no lesion, and 1, 2, 3, and 4+ represent mesangial matrix expansion or sclerosis, involving ≤25, 25 to 50, 50 to 75, or >75% of the glomerular tuft area, respectively. Immunohistochemistry for macrophages was performed using rat anti-mouse Mac-2 antibody (clone M3/38; Cedarlane, Burlington, NC) on paraffin sections as described previously.16,27
Quantitative real-time PCR
Total RNA was extracted from mouse kidneys using Tri reagent (Molecular research center, Inc, Cincinnati, OH) per manufacturer’s instructions. Single-strand cDNA was synthesized using iScript cDNA Synthesis Kits (Bio-Rad, Hercules, CA) for two-step real-time RT-PCR. Quantitative PCR assays were performed using an ABI-Prism 7900HT PCR system, TaqMan Fast Universal PCR master mixture (Applied Biosystems, Foster City, CA), and a TaqMan Gene Expression Assay Mix comprising Fn1 (Mm01256744_m1) and Tnf (Mm00443260_g1). A mouse Gapdh (Mm99999915_g1) assay mix served as an endogenous control. Data was analyzed using SDS Software 2.2.2.
Determination of kidney ornithine levels
Kidney tissues were weighed, homogenized in 300 μl 3M perchloric acid (Fisher Scientific, Fair Lawn, NJ), and supernatants were transferred to a fresh tube after centrifugation at 14000rpm at 4°C for ornithine assay. Kidney tissue extracts were spiked with isotope-labeled internal ornithine standard (Cambridge Isotope Laboratories, INC, Andover, MA) and purified with solid phase extraction column. The purified sample was then analyzed by a LC-MS system (Waters, Milford, MA) in the MS core facility at Penn State College of Medicine. UPLC was performed at a flow rate of 0.4 mL/min. The injection volume was 3 μL. The standard curve ranged from 1 μM to 200 μM for ornithine (Sigma Aldrich, St. Louis, MO). The Synapt Q-TOF mass spectrometer was operated with an electrospray ionization positive mode. Ornithine and its isotope-labeled internal standard were detected by daughter scan parent compound and the most abundant daughter fragment was used for quantification (Supplemental Fig. 2).
Analytical methodology
Urine albumin concentration was measured by ELISA using an Albuwell M kit (Exocell, Philadelphia, PA) as described elsewhere.16,27 Creatinine was determined using a Creatinine Liquid Reagens Assay kit (Diazyme Laboratories, Poway, CA) as described previously.16,27 Blood urea nitrogen (BUN) was determined using Vitros DT6011 chemistry slides (Ortho-Clinical Diagnostics, Rochester, NY) as previously described.16,27 Body composition was measured using LF90 Minispec Time Domain Nuclear Magnetic Resonance Spectrometer (Burker Optics, Billerica, MA) as described previously.16,27 Urinary thiobarbituric acid reactive substance (TBARS) levels, which are recommended by the AMDCC (http://www.amdcc.org/shared/showFile.aspx?doctypeid=3&docid=33) as an index of oxidative stress in DN, were determined as described previously.47
Western blot
Fifteen [g of kidney lysates were electrophoresed on SDS-polyacrylamide gels (12% Mini-PROTEAN® TGX™ Precast Gel; Bio-Rad, Hercules, CA) and electroblotted onto PVDF membranes (Millipore, Billerica, MA). Membranes were probed with antibodies for arginase-2 (Santa Cruz Biotechnology, Cat #: Sc-20151), eNOS (Abcam, Cat #: ab76198) and beta-actin (Sigma-Aldrich, Cat #: A5441), and immunoblots were developed with appropriate secondary antibodies and enhanced chemiluminescence. Densitometric analysis of autoradiograms was performed using Image J software (NIH, http://rsbweb.nih.gov/ij/index.html).
Arginase activity assay
Kidney lysates were prepared by homogenization in lysis buffer (50 mM Tris-HCl, pH 7.5, 0.1 mM EDTA and protease inhibitors) at 4°C, followed by centrifugation for 20 min at 14,000 × g at 4°C. The supernatants of kidney lysates were assayed for arginase activity as previously described.16,48
Statistic analysis
Comparisons between groups were examined by using the SPSS version 19.0 software for Windows (SPSS, Chicago, IL) program. Data are expressed as mean ± SEM. One-way ANOVA was used when more than two groups were compared, and significance of observed differences among the groups was evaluated with a least significant difference post hoc test. Statistical significance was identified at p< 0.05.
Supplementary Material
Acknowledgments
This study was supported by NIH Grants DK077444 and DK094930 (ASA), GM57384 (SMM), and the Pennsylvania Department of Health using Tobacco CURE Funds (ASA). The authors gratefully acknowledge Dr. WB Reeves (Penn State College of Medicine) for helpful discussion, Diane Kepka-Lenhart (University of Pittsburgh) for technical assistance and the MS Core Facility at Penn State College of Medicine.
Footnotes
Disclosure
SMM has received consulting fees from Corridor Pharmaceuticals for advisory board participation. All other authors have nothing to disclose.
References
- 1.Boyle JP, Thompson TJ, Gregg EW, et al. Projection of the year 2050 burden of diabetes in the US adult population: dynamic modeling of incidence, mortality, and prediabetes prevalence. Popul Health Metr. 8:29. doi: 10.1186/1478-7954-8-29. [DOI] [PMC free article] [PubMed] [Google Scholar]
- 2.Creager MA, Luscher TF, Cosentino F, et al. Diabetes and vascular disease: pathophysiology, clinical consequences, and medical therapy: Part I. Circulation. 2003;108:1527–1532. doi: 10.1161/01.CIR.0000091257.27563.32. [DOI] [PubMed] [Google Scholar]
- 3.Goligorsky MS, Chen J, Brodsky S. Workshop: endothelial cell dysfunction leading to diabetic nephropathy: focus on nitric oxide. Hypertension. 2001;37:744–748. doi: 10.1161/01.hyp.37.2.744. [DOI] [PubMed] [Google Scholar]
- 4.Xia Y, Dawson VL, Dawson TM, et al. Nitric oxide synthase generates superoxide and nitric oxide in arginine-depleted cells leading to peroxynitrite-mediated cellular injury. Proc Natl Acad Sci U S A. 1996;93:6770–6774. doi: 10.1073/pnas.93.13.6770. [DOI] [PMC free article] [PubMed] [Google Scholar]
- 5.Brodsky SV, Gao S, Li H, et al. Hyperglycemic switch from mitochondrial nitric oxide to superoxide production in endothelial cells. Am J Physiol Heart Circ Physiol. 2002;283:H2130–2139. doi: 10.1152/ajpheart.00196.2002. [DOI] [PubMed] [Google Scholar]
- 6.Wang CH, Li F, Hiller S, et al. A modest decrease in endothelial NOS in mice comparable to that associated with human NOS3 variants exacerbates diabetic nephropathy. Proc Natl Acad Sci U S A. 2011;108:2070–2075. doi: 10.1073/pnas.1018766108. [DOI] [PMC free article] [PubMed] [Google Scholar]
- 7.Zhao HJ, Wang S, Cheng H, et al. Endothelial nitric oxide synthase deficiency produces accelerated nephropathy in diabetic mice. J Am Soc Nephrol. 2006;17:2664–2669. doi: 10.1681/ASN.2006070798. [DOI] [PMC free article] [PubMed] [Google Scholar]
- 8.Balakumar P, Chakkarwar VA, Krishan P, et al. Vascular endothelial dysfunction: a tug of war in diabetic nephropathy? Biomed Pharmacother. 2009;63:171–179. doi: 10.1016/j.biopha.2008.08.008. [DOI] [PubMed] [Google Scholar]
- 9.Morris SM., Jr Recent advances in arginine metabolism: roles and regulation of the arginases. Br J Pharmacol. 2009;157:922–930. doi: 10.1111/j.1476-5381.2009.00278.x. [DOI] [PMC free article] [PubMed] [Google Scholar]
- 10.Zhang C, Hein TW, Wang W, et al. Constitutive expression of arginase in microvascular endothelial cells counteracts nitric oxide-mediated vasodilatory function. FASEB J. 2001;15:1264–1266. doi: 10.1096/fj.00-0681fje. [DOI] [PubMed] [Google Scholar]
- 11.Berkowitz DE, White R, Li D, et al. Arginase reciprocally regulates nitric oxide synthase activity and contributes to endothelial dysfunction in aging blood vessels. Circulation. 2003;108:2000–2006. doi: 10.1161/01.CIR.0000092948.04444.C7. [DOI] [PubMed] [Google Scholar]
- 12.Lim HK, Ryoo S, Benjo A, et al. Mitochondrial arginase II constrains endothelial NOS-3 activity. Am J Physiol Heart Circ Physiol. 2007;293:H3317–3324. doi: 10.1152/ajpheart.00700.2007. [DOI] [PubMed] [Google Scholar]
- 13.Levillain O, Balvay S, Peyrol S. Localization and differential expression of arginase II in the kidney of male and female mice. Pflugers Arch. 2005;449:491–503. doi: 10.1007/s00424-004-1336-8. [DOI] [PubMed] [Google Scholar]
- 14.Levillain O, Balvay S, Peyrol S. Mitochondrial expression of arginase II in male and female rat inner medullary collecting ducts. J Histochem Cytochem. 2005;53:533–541. doi: 10.1369/jhc.4A6489.2005. [DOI] [PubMed] [Google Scholar]
- 15.Morris SM, Jr, Bhamidipati D, Kepka-Lenhart D. Human type II arginase: sequence analysis and tissue-specific expression. Gene. 1997;193:157–161. doi: 10.1016/s0378-1119(97)00099-1. [DOI] [PubMed] [Google Scholar]
- 16.Morris SM, Jr, Gao T, Cooper TK, et al. Arginase-2 mediates diabetic renal injury. Diabetes. 2011;60:3015–3022. doi: 10.2337/db11-0901. [DOI] [PMC free article] [PubMed] [Google Scholar]
- 17.Bagnost T, Berthelot A, Bouhaddi M, et al. Treatment with the arginase inhibitor N(omega)-hydroxy-nor-L-arginine improves vascular function and lowers blood pressure in adult spontaneously hypertensive rat. J Hypertens. 2008;26:1110–1118. doi: 10.1097/HJH.0b013e3282fcc357. [DOI] [PubMed] [Google Scholar]
- 18.Ckless K, Lampert A, Reiss J, et al. Inhibition of arginase activity enhances inflammation in mice with allergic airway disease, in association with increases in protein S-nitrosylation and tyrosine nitration. J Immunol. 2008;181:4255–4264. doi: 10.4049/jimmunol.181.6.4255. [DOI] [PMC free article] [PubMed] [Google Scholar]
- 19.Maarsingh H, Zuidhof AB, Bos IS, et al. Arginase inhibition protects against allergen-induced airway obstruction, hyperresponsiveness, and inflammation. Am J Respir Crit Care Med. 2008;178:565–573. doi: 10.1164/rccm.200710-1588OC. [DOI] [PubMed] [Google Scholar]
- 20.Reid KM, Tsung A, Kaizu T, et al. Liver I/R injury is improved by the arginase inhibitor, N(omega)-hydroxy-nor-L-arginine (nor-NOHA) Am J Physiol Gastrointest Liver Physiol. 2007;292:G512–517. doi: 10.1152/ajpgi.00227.2006. [DOI] [PubMed] [Google Scholar]
- 21.Jeyabalan G, Klune JR, Nakao A, et al. Arginase blockade protects against hepatic damage in warm ischemia-reperfusion. Nitric Oxide. 2008;19:29–35. doi: 10.1016/j.niox.2008.04.002. [DOI] [PMC free article] [PubMed] [Google Scholar]
- 22.Xu L, Hilliard B, Carmody RJ, et al. Arginase and autoimmune inflammation in the central nervous system. Immunology. 2003;110:141–148. doi: 10.1046/j.1365-2567.2003.01713.x. [DOI] [PMC free article] [PubMed] [Google Scholar]
- 23.Bivalacqua TJ, Burnett AL, Hellstrom WJ, et al. Overexpression of arginase in the aged mouse penis impairs erectile function and decreases eNOS activity: influence of in vivo gene therapy of anti-arginase. Am J Physiol Heart Circ Physiol. 2007;292:H1340–1351. doi: 10.1152/ajpheart.00121.2005. [DOI] [PubMed] [Google Scholar]
- 24.Nakagawa T, Tanabe K, Croker BP, et al. Endothelial dysfunction as a potential contributor in diabetic nephropathy. Nat Rev Nephrol. 2010 doi: 10.1038/nrneph.2010.152. [DOI] [PMC free article] [PubMed] [Google Scholar]
- 25.Wu G, Morris SM., Jr Arginine metabolism: nitric oxide and beyond. Biochem J. 1998;336 (Pt 1):1–17. doi: 10.1042/bj3360001. [DOI] [PMC free article] [PubMed] [Google Scholar]
- 26.Morris SM, Jr, Kepka-Lenhart D, Chen LC. Differential regulation of arginases and inducible nitric oxide synthase in murine macrophage cells. Am J Physiol. 1998;275:E740–747. doi: 10.1152/ajpendo.1998.275.5.E740. [DOI] [PubMed] [Google Scholar]
- 27.Awad AS, Kinsey GR, Khutsishvili K, et al. Monocyte/Macrophage Chemokine Receptor CCR2 Mediates Diabetic Renal Injury. Am J Physiol Renal Physiol. 2011 doi: 10.1152/ajprenal.00332.2011. [DOI] [PMC free article] [PubMed] [Google Scholar]
- 28.Awad AS, Huang L, Ye H, et al. Adenosine A2A receptor activation attenuates inflammation and injury in diabetic nephropathy. Am J Physiol Renal Physiol. 2006;290:F828–837. doi: 10.1152/ajprenal.00310.2005. [DOI] [PubMed] [Google Scholar]
- 29.Benigni A, Zoja C, Corna D, et al. Add-on anti-TGF-beta antibody to ACE inhibitor arrests progressive diabetic nephropathy in the rat. J Am Soc Nephrol. 2003;14:1816–1824. doi: 10.1097/01.asn.0000074238.61967.b7. [DOI] [PubMed] [Google Scholar]
- 30.Gilbert RE, Cooper ME. The tubulointerstitium in progressive diabetic kidney disease: more than an aftermath of glomerular injury? Kidney Int. 1999;56:1627–1637. doi: 10.1046/j.1523-1755.1999.00721.x. [DOI] [PubMed] [Google Scholar]
- 31.Tang WW, Qi M, Warren JS. Monocyte chemoattractant protein 1 mediates glomerular macrophage infiltration in anti-GBM Ab GN. Kidney Int. 1996;50:665–671. doi: 10.1038/ki.1996.363. [DOI] [PubMed] [Google Scholar]
- 32.Wada T, Furuichi K, Sakai N, et al. Up-regulation of monocyte chemoattractant protein-1 in tubulointerstitial lesions of human diabetic nephropathy. Kidney Int. 2000;58:1492–1499. doi: 10.1046/j.1523-1755.2000.00311.x. [DOI] [PubMed] [Google Scholar]
- 33.Giunti S, Barutta F, Perin PC, et al. Targeting the MCP-1/CCR2 System in diabetic kidney disease. Curr Vasc Pharmacol. 8:849–860. doi: 10.2174/157016110793563816. [DOI] [PubMed] [Google Scholar]
- 34.Tipping PG, Leong TW, Holdsworth SR. Tumor necrosis factor production by glomerular macrophages in anti-glomerular basement membrane glomerulonephritis in rabbits. Lab Invest. 1991;65:272–279. [PubMed] [Google Scholar]
- 35.Tipping PG, Lowe MG, Holdsworth SR. Glomerular interleukin 1 production is dependent on macrophage infiltration in anti-GBM glomerulonephritis. Kidney Int. 1991;39:103–110. doi: 10.1038/ki.1991.13. [DOI] [PubMed] [Google Scholar]
- 36.Ming XF, Rajapakse AG, Yepuri G, et al. Arginase II Promotes Macrophage Inflammatory Responses Through Mitochondrial Reactive Oxygen Species, Contributing to Insulin Resistance and Atherogenesis. J Am Heart Assoc. 2012;1:e000992. doi: 10.1161/JAHA.112.000992. [DOI] [PMC free article] [PubMed] [Google Scholar]
- 37.Awad AS, Webb RL, Carey RM, et al. Renal nitric oxide production is decreased in diabetic rats and improved by AT1 receptor blockade. J Hypertens. 2004;22:1571–1577. doi: 10.1097/01.hjh.0000133718.86451.6a. [DOI] [PubMed] [Google Scholar]
- 38.Bucala R, Tracey KJ, Cerami A. Advanced glycosylation products quench nitric oxide and mediate defective endothelium-dependent vasodilatation in experimental diabetes. J Clin Invest. 1991;87:432–438. doi: 10.1172/JCI115014. [DOI] [PMC free article] [PubMed] [Google Scholar]
- 39.Du XL, Edelstein D, Dimmeler S, et al. Hyperglycemia inhibits endothelial nitric oxide synthase activity by posttranslational modification at the Akt site. J Clin Invest. 2001;108:1341–1348. doi: 10.1172/JCI11235. [DOI] [PMC free article] [PubMed] [Google Scholar]
- 40.Hink U, Li H, Mollnau H, et al. Mechanisms underlying endothelial dysfunction in diabetes mellitus. Circ Res. 2001;88:E14–22. doi: 10.1161/01.res.88.2.e14. [DOI] [PubMed] [Google Scholar]
- 41.Faria AM, Papadimitriou A, Silva KC, et al. Uncoupling endothelial nitric oxide synthase is ameliorated by green tea in experimental diabetes by reestablishing tetrahydrobiopterin levels. Diabetes. 2012;61:1838–1847. doi: 10.2337/db11-1241. [DOI] [PMC free article] [PubMed] [Google Scholar]
- 42.Yagihashi N, Nishida N, Seo HG, et al. Expression of nitric oxide synthase in macula densa in streptozotocin diabetic rats. Diabetologia. 1996;39:793–799. doi: 10.1007/s001250050512. [DOI] [PubMed] [Google Scholar]
- 43.Brodsky SV, Morrishow AM, Dharia N, et al. Glucose scavenging of nitric oxide. Am J Physiol Renal Physiol. 2001;280:F480–486. doi: 10.1152/ajprenal.2001.280.3.F480. [DOI] [PubMed] [Google Scholar]
- 44.Wehbi GJ, Zimpelmann J, Carey RM, et al. Early streptozotocin-diabetes mellitus downregulates rat kidney AT2 receptors. Am J Physiol Renal Physiol. 2001;280:F254–265. doi: 10.1152/ajprenal.2001.280.2.F254. [DOI] [PubMed] [Google Scholar]
- 45.Shi W, Wang X, Shih DM, et al. Paradoxical reduction of fatty streak formation in mice lacking endothelial nitric oxide synthase. Circulation. 2002;105:2078–2082. doi: 10.1161/01.cir.0000015853.59427.32. [DOI] [PubMed] [Google Scholar]
- 46.Shi O, Morris SM, Jr, Zoghbi H, et al. Generation of a mouse model for arginase II deficiency by targeted disruption of the arginase II gene. Mol Cell Biol. 2001;21:811–813. doi: 10.1128/MCB.21.3.811-813.2001. [DOI] [PMC free article] [PubMed] [Google Scholar]
- 47.Lapenna D, Ciofani G, Pierdomenico SD, et al. Reaction conditions affecting the relationship between thiobarbituric acid reactivity and lipid peroxides in human plasma. Free Radic Biol Med. 2001;31:331–335. doi: 10.1016/s0891-5849(01)00584-6. [DOI] [PubMed] [Google Scholar]
- 48.Kepka-Lenhart D, Ash DE, Morris SM. Determination of mammalian arginase activity. Methods Enzymol. 2008;440:221–230. doi: 10.1016/S0076-6879(07)00813-0. [DOI] [PubMed] [Google Scholar]
Associated Data
This section collects any data citations, data availability statements, or supplementary materials included in this article.