

Abstract
The BTBR T+ tf/J (BTBR) mouse strain is indifferent to exemplars of sweet, Polycose, umami, bitter, and calcium tastes, which share in common transduction by G protein-coupled receptors (GPCRs). To investigate the genetic basis for this taste dysfunction, we screened 610 BTBR × NZW/LacJ F2 hybrids, identified a potent QTL on chromosome 17, and isolated this in a congenic strain. Mice carrying the BTBR/BTBR haplotype in the 0.8-Mb (21-gene) congenic region were indifferent to sweet, Polycose, umami, bitter, and calcium tastes. To assess the contribution of a likely causative culprit, Itpr3, the inositol triphosphate receptor 3 gene, we produced and tested Itpr3 knockout mice. These were also indifferent to GPCR-mediated taste compounds. Sequencing the BTBR form of Itpr3 revealed a unique 12 bp deletion in Exon 23 (Chr 17: 27238069; Build 37). We conclude that a spontaneous mutation of Itpr3 in a progenitor of the BTBR strain produced a heretofore unrecognized dysfunction of GPCR-mediated taste transduction.
Keywords: NZW/LacJ, sweet, umami, bitter, QTL
the BTBR T+ tf/J (BTBR) mouse strain was initially developed to study embryogenesis and infertility because its “tufted” (tf) hair pattern identified animals carrying the lethal T-complex (reviews Refs. 50, 55).1 More recently, it has been used to investigate the physiological mechanisms underlying abdominal obesity and insulin-resistant diabetes (14, 22, 42) and as a model for low sociability, autism, and neurological abnormalities including the absence of a corpus callosum (31, 39, 59, 76)]. We became interested in the BTBR strain because it had unusually high taste preferences for calcium solutions (68); it ranked second out of 40 mouse strains in its avidity for calcium [after the PWK/PhJ strain (68, 70)]. Here, we report a series of experiments culminating in the identification of the gene underlying this phenotype. During the course of this work, we discovered that the taste phenotype was not specific to calcium but instead involved a wider taste dysfunction, which we describe below.
METHODS
All procedures involving animals were approved by the Animal Care and Use Committee of the Monell Chemical Senses Center. Taste compounds were purchased from Sigma Chemical (St. Louis, MO) except for calcium lactate (CaLa), which was purchased from Fisher Scientific, and trisodium pyrophosphate (Na3HP2O7), which was provided by SPF-DIANA (Elven, France). All were dissolved in deionized water except capsaicin, which was first dissolved in 1 ml of 95% ethanol, and this was then dissolved in deionized water to produce the appropriate concentration. For brevity, we use “taste solution” to refer to the fluids used in two-bottle choice and brief-access tests but recognize that their olfactory, trigeminal, and/or postingestive actions may influence intake and preference.
Subjects and Maintenance
All experiments, except those with transgenic mice (see below), involved mice bred in-house from stock purchased from The Jackson Laboratory (Bar Harbor, ME) [BTBR, stock no. 002282; NZW/LacJ (NZW), stock no. 001058]. We used the NZW strain as a control parental strain for comparisons with the BTBR strain primarily because it had lower calcium preferences (68) and higher sodium preferences (69), thus avoiding the possibility that the BTBR strain's avidity for calcium was due to a nonspecific appetite for all salts or all taste compounds. Additional considerations were the divergent phylogenetic origins of the two strains (40, 74), which presumably captures more genetic diversity, and a desire to avoid rediscovering the calcium preference quantitative trait loci (QTLs) found in earlier work with a C57BL/6J × PWK/PhJ cross (70).
Mice were maintained in a vivarium at 23°C with a 12:12 h light/dark cycle (lights off at 7 PM). They were housed in plastic “tub” cages (26.5 cm × 17 cm × 12 cm) with stainless steel wire lids and wood shavings scattered on the floor. The mice were transferred to clean cages with fresh bedding once every week while waiting to be tested and once every 9–10 days during two-bottle choice tests (so as not to disturb them during a test). The cage lids included space for pelleted food and a water bottle (see Ref. 66 for details). The food was AIN-76A, a nutritionally complete semisynthetic diet that contains by weight: 20% protein (casein), 65% carbohydrate (sucrose and cornstarch), 5% fat (corn oil), and 10% fiber (cellulose), minerals, and vitamins (no. 100000; Dyets, Bethlehem, PA). Minerals in this diet include 5.2 g/kg calcium, 0.51 g/kg magnesium, 3.6 g/kg potassium, and 1.02 g/kg sodium. When mice were not being tested, deionized water was available from an inverted 300 ml glass bottle with a neoprene stopper and a stainless steel drinking spout. A detailed description of mouse husbandry, housing conditions, and other procedures is available online (66).
Mice were weaned at 21–23 days old and housed in groups of up to six of the same sex. When they were aged 6–8 wk old they were transferred to individual cages for taste phenotyping. Tests began after the mice had adapted to their new housing for at least 7 days.
Phenotyping
For reasons described below, there were four series of mice that were tested at different times in separate experiments: 1) BTBR and NZW inbred strains, 2) BTBR × NZW F2 hybrids, 3) Chr 17 BTBR/NZW congenics and BTBR/BTBR littermate controls, and 4) Itpr3 knockout (KO) and wild-type (WT) littermates. Because of constraints due to breeding, vivarium space, and equipment, tests were made of cohorts of 16–129 mice. Each cohort was matched for the number of mice of each sex and included roughly equal numbers of littermates from each genetic group when this was pertinent (i.e., 50% congenics and 50% controls, or 50% KOs and 50% WTs). Group sizes and the constitution of each cohort are presented in Tables 1–4.
Table 1.
Analyses of parental strain two-bottle choice test preference scores
| Two-way ANOVA |
||||||
|---|---|---|---|---|---|---|
| Compound | Cohort and Order | Group Composition | Strain | Concentration | Strain × Concentration | Concentrations Supporting Strain Differences |
| Saccharin | 5b | 8 F | F(1,14) = 8.16, P = 0.0127 | F(5,70) = 8.90, P < 0.0001 | F(5,70) = 7.08, P < 0.0001 | 3.2, 10, 32 mM |
| Sucrose | 2d | 8 M | F(1,14) = 6.82, P = 0.0205 | F(7,98) = 35.8, P < 0.0001 | F(7,98) = 4.75, P = 0.0001 | 4, 8% |
| Maltose | 10b | 6 M, 4 F | F(1,18) = 17.3, P = 0.0006 | F(7,126) = 35.3, P < 0.0001 | F(7,126) = 1.21, P = 0.3013 | none |
| Polycose | 9a | 8 M | F(1,14) = 5.94, P = 0.0287 | F(7,98) = 61.6, P < 0.0001 | F(7,98) = 4.76, P = 0.0001 | 1, 2, 4, 8% |
| MSG | 10a | 6 M, 4 F | F(1,18) = 20.7, P = 0.0002 | F(6,108) = 20.3, P < 0.0001 | F(6,108) = 7.65, P < 0.0001 | 100, 178, 320, 562 mM |
| IMP | 4b | 8 F | F(1,14) = 9.19, P = 0.0090 | F(8,112) = 22.6, P < 0.0001 | F(8,112) = 6.32, P < 0.0001 | 3.2, 10, 32, 100 mM |
| Na3HP2O7 | 6a | 16 M, 16 F | F(1,30) = 27.9, P < 0.0001 | F(6,180) = 50.0, P < 0.0001 | F(6,180) = 6.30, P < 0.0001 | 3.2, 10, 32, 56 mM |
| HCl | 8a | 8 F | F(1,14) = 5.78, P = 0.0307 | F(5,70) = 13.0, P < 0.0001 | F(5,70) = 1.17, P = 0.3303 | none |
| Citric acid | 4d | 8 F | F(1,14) = 2.94, P = 0.1086 | F(5,70) = 6.01, P = 0.0001 | F(5,70) = 0.65, P = 0.6652 | none |
| Denatonium | 2a, 3a | 16 M | F(1,29) = 11.0, P = 0.0024 | F(6,174) = 18.4, P < 0.0001 | F(6,174) = 2.90, P = 0.0102 | 0.32, 1.0, 3.2 mM |
| QHCl | 2b | 8 M | F(1,14) = 6.46, P = 0.0235 | F(3,42) = 7.91, P = 0.0003 | F(3,42) = 3.67, P = 0.0195 | 0.032, 0.1 mM |
| Caffeine | 2c, 10a | 16 M | F(1,30) = 32.5, P = 0.0001 | F(4,120) = 56.4, P < 0.0001 | F(4,120) = 6.27, P = 0.0001 | 1, 3.2, 10 mM |
| ZnCl2 | 4a | 8 F | F(1,14) = 0.97, P = 0.3404 | F(3,42) = 33.0, P < 0.0001 | F(4,42) = 0.67, P = 0.5771 | none |
| Capsaicin | 3b | 8 M | F(1,13) = 0.02, P = 0.8840 | F(4,52) = 41.8, P < 0.0001 | F(4,52) = 2.25, P = 0.0758 | none |
| CaCl2 | 1a | 10 M, 10 F | F(1,38) = 107.4, P < 0.0001 | F(3,114) = 14.9, P < 0.0001 | F(3,114) = 51.1, P < 0.0001 | 7.5, 25, 75 mM |
| CaLa | 1b | 10 M, 10 F | F(1,38) = 17.9, P = 0.0001 | F(3,114) = 5.52, P = 0.0014 | F(3,114) = 7.99, P < 0.0001 | 7.5, 25, 75 mM |
| MgCl2 | 5a, 6c, 7d | 24 M, 32 F | F(1,54) = 0.60, P = 0.4400 | F(4,216) = 31.4, P < 0.0001 | F(4,216) = 0.60, P = 0.6599 | none |
| NaCl | 5c | 8 F | F(1,14) = 1.48, P = 0.2434 | F(5,70) = 6.26, P < 0.0001 | F(5,70) = 3.30, P = 0.0099 | 100, 178 mM |
| NaLa | 10c | 6 M, 4 F | F(1,18) = 1.81, P = 0.1942 | F(5,90) = 63.1, P < 0.0001 | F(5,90) = 2.93, P = 0.0170 | 320 mM |
| KCl | 7b | 8 M, 8 F | F(1,30) = 3.64, P = 0.0658 | F(5,150) = 11.8, P < 0.0001 | F(5,150) = 0.85, P = 0.5158 | none |
| NH4Cl | 7c | 8 M, 8 F | F(1,29) = 3.01, P = 0.0932 | F(5,145) = 18.3, P < 0.0001 | F(5,145) = 0.30, P = 0.9103 | none |
Compounds are listed in the order presented in Figs. 3–5. Cohort and order provides batch of mice (1–10) and compounds tested in alphabetical order (a–d), with “a” being tested first, “b” second, and so on. Group composition gives number of male (M) and female (F) mice of each strain tested (there were usually equal numbers of BTBR and NZW mice although a mouse was occasionally excluded from data analysis because it spilled fluid). Concentrations supporting strain differences = P < 0.05 according to post hoc Fisher least significant difference (LSD) tests. Saccharin, sodium saccharin; MSG, monosodium glutamate; IMP, inosine monophosphate (umami taste); Na3HP2O7, trisodium pyrophosphate; denatonium, denatonium benzoate; QHCl, quinine hydrochloride; CaLa, calcium lactate; NaLa, sodium lactate.
Table 4.
Analyses of brief-access test lick rates
| Two-way ANOVA |
||||||
|---|---|---|---|---|---|---|
| Compound | Cohort and Order | Group Composition | Strain | Concentration | Strain × Concentration | Concentrations Supporting Strain Differences |
| Parental strain (NZW vs. BTBR) | ||||||
| Sucrose | 1c | 8 F | F(1,14) = 19.1, P< 0.0001 | F(4,56) = 37.0, P< 0.0001 | F(4,56) = 11.5, P< 0.0001 | 320, 1,000 mM |
| Polycose | 2c | 4 M, 4 F | F(1,14) = 24.4, P< 0.0001 | F(4,56) = 1.23, P= 0.3084 | F(4,56) = 4.18, P= 0.0051 | 32, 68, 145, 320 mM |
| HCl | 1e, 2f | 4 M, 12 F | F(1,29) = 2.62, P= 0.1166 | F(4,116) = 36.1, P< 0.0001 | F(4,116) = 4.84, P= 0.0012 | 10, 32 mM |
| Citric acid | 2a | 4 M, 4 F | F(1,14) = 7.87, P= 0.1402 | F(4,56) = 73.9, P< 0.0001 | F(4,56) = 11.9, P< 0.0001 | 0, 10, 32, 100, 320 mM |
| Denatonium | 1e | 8 F | F(1,14) = 17.8, P< 0.0001 | F(4,56) = 48.9, P< 0.0001 | F(4,56) = 31.9, P< 0.0001 | 0, 0.32, 1.78, 10 mM |
| QHCl | 1a | 8 F | F(1,14) = 0.23, P= 0.6340 | F(4,56) = 14.7, P< 0.0001 | F(4,56) = 14.4, P< 0.0001 | 0,* 0.032,* 0.32, 1 mM |
| Caffeine | 2g | 4 M, 4 F | F(1,14) = 1.62, P= 0.2240 | F(4,56) = 39.3, P< 0.0001 | F(4,56) = 5.51, P= 0.0008 | 10, 32 mM |
| Capsaicin | 2b | 4 M, 4 F | F(1,13) = 0.12, P= 0.7385 | F(4,52) = 34.3, P< 0.0001 | F(4,52) = 1.06, P= 0.3814 | none |
| CaCl2 | 1d | 8 F | F(1,14) = 4.65, P= 0.0489 | F(4,56) = 24.7, P< 0.0001 | F(4,56) = 12.0, P< 0.0001 | 320 mM |
| MgCl2 | 2e | 4 M, 4 F | F(1,14) = 1.05, P= 0.3233 | F(4,56) = 52.3, P< 0.0001 | F(4,56) = 2.35, P= 0.0649 | none |
| NaCl | 1b | 8 F | F(1,14) = 3.25, P= 0.0929 | F(4,56) = 11.6, P< 0.0001 | F(4,56) = 5.10, P= 0.0014 | 600, 1,000 mM |
| KCl | 2d | 4 M, 4 F | F(1,13) = 4.15, P= 0.0623 | F(4,52) = 28.5, P< 0.0001 | F(4,52) = 2.66, P= 0.0424 | 150, 600 mM |
| Chr 17 BTBR/NZW congenic and BTBR/BTBR control mice | ||||||
| Sucrose | 1c | 5 M, 3 F | F(1,12) = 3.27, P= 0.0953 | F(4,48) = 12.7, P< 0.0001 | F(4,48) = 6.31, P= 0.0003 | 320, 1,000 mM |
| Polycose | 2c | 4 M, 5 F | F(1,12) = 6.98, P= 0.0215 | F(4,48) = 2.47, P= 0.0568 | F(4,48) = 3.30, P= 0.0182 | 145, 320 mM |
| HCl | 1e, 2f | 9 M, 8 F | F(1,29) = 0.74, P= 0.3980 | F(4,116) = 27.8, P< 0.0001 | F(4,116) = 1.62, P= 0.1737 | none |
| Citric acid | 2a | 4 M, 5 F | F(1,14) = 2.59, P= 0.1297 | F(4,56) = 26.2, P< 0.0001 | F(4,56) = 0.48, P= 0.7492 | none |
| Denatonium | 1e | 5 M, 3 F | F(1,11) = 11.1, P= 0.0066 | F(4,56) = 16.6, P< 0.0001 | F(4,56) = 4.55, P= 0.0125 | 0.32, 1.78, 10 mM |
| QHCl | 1a | 5 M, 3 F | F(1,14) = 6.00, P= 0.0280 | F(4,56) = 5.15, P= 0.0013 | F(4,56) = 1.57, P= 0.1949 | 0.1, 0.32, 1 mM* |
| Caffeine | 2e | 4 M, 5 F | F(1,14) = 0.06, P= 0.8146 | F(4,56) = 42.7, P< 0.0001 | F(4,56) = 0.65, P= 0.6280 | none |
| Capsaicin | 2b | 4 M, 5 F | F(1,13) = 0.04, P= 0.8435 | F(4,52) = 36.9, P< 0.0001 | F(4,52) = 0.93, P= 0.4550 | none |
| CaCl2 | 1d | 5 M, 3 F | F(1,13) = 6.80, P= 0.0217 | F(4,52) = 22.9, P< 0.0001 | F(4,52) = 4.38, P= 0.0040 | 100, 320 mM |
| MgCl2 | 2e | 4 M, 5 F | F(1,13) = 22.4, P= 0.0004 | F(4,52) = 54.0, P< 0.0001 | F(4,52) = 5.67, P= 0.0007 | 32, 100, 320 mM |
| NaCl | 1b | 5 M, 3 F | F(1,14) = 2.05, P= 0.1742 | F(4,56) = 15.5, P< 0.0001 | F(4,56) = 4.16, P= 0.0051 | 1,000 mM |
| KCl | 2d | 4 M, 5 F | F(1,13) = 17.0, P= 0.0012 | F(4,52) = 13.9, P< 0.0001 | F(4,52) = 3.12, P= 0.0224 | 150, 300, 600 mM |
These analyses are based on the means shown in Fig. 6. Cohort and order provides batch of mice (1st or 2nd) and compounds tested in alphabetical order (a–f), with “a” being tested first, “b” second, and so on. Group composition gives number of M and F mice of each strain; for cohort 2 there were 4 M + 4 F in the BTBR/BTBR group. Concentrations supporting strain differences = P < 0.05 according to post hoc Fisher LSD tests.
Post hoc tests are not strictly justified in this case because the interaction was not significant.
Two-bottle choice: 96 h screening tests.
All BTBR × NZW F2 hybrids and cohorts of each of the six other groups were tested using a screen involving 96 h two-bottle choice tests. We used 96 h tests, rather than the more usual 48 h tests, because they provide significantly more sensitivity (64), which is crucial for genetic analyses involving the phenotypes of individual animals. Each mouse was weighed (to the nearest 0.1 g), and then it received a series of 10 or 11 tests. During each test, its regular water bottle was replaced with two graduated drinking tubes. For the first test, the two drinking tubes contained deionized water. Subsequent tests involved one drinking tube of deionized water and one of the following solutions in the order listed: 50 mM CaCl2, 50 mM CaLa, 50 mM MgCl2, 100 mM KCl, 100 mM NH4Cl, 100 mM NaCl, 5 mM citric acid, 0.03 mM quinine hydrochloride (QHCl) and 2 mM sodium saccharin. An additional (11th) test solution, 0.1 mM QHCl was included at the end of the test series for the inbred, congenic, and knockout cohorts when it became clear that NZW controls did not avoid 0.03 mM QHCl. To reduce the possibility that consumption of a taste solution might influence consumption of the next in the series, there was a day with a single water bottle available after each test except the first one (which involved just water).
This series was used in a previous experiment (70) and was selected here for the following reasons: Our earlier strain surveys suggested that 50 mM CaCl2 was a representative calcium solution; it was well above the threshold of detection but not completely avoided by most strains (2, 68). To assess whether group differences involving this solution were specific to calcium, to divalent chlorides, or to all mineral salts in general we tested comparable concentrations of CaLa, MgCl2, NH4Cl, KCl, and NaCl. To provide a general assessment of taste preferences we also tested QHCl, citric acid, and saccharin as representative bitter, sour, and sweet compounds.
At the start of each 96 h test, two graduated drinking tubes were provided. The tube on the left (closest to the cage wall) contained water and the tube on the right (closest to the food hopper) contained taste solution (see Ref. 5 or 66 for illustrations and details of drinking tube construction). The position of the tubes was switched every 24 h (to control for side preferences). The volume of fluid remaining (to the nearest 0.1 ml) was recorded at 48 and 96 h.
Fluid spillage and evaporation were ignored. Previous work with identical procedures found they account for <0.5 ml over 48 h (65, 67). Intakes during the 96 h tests were divided by four to obtain average daily intakes. Preference scores were determined as the percentage of taste solution consumed relative to total fluid consumed (i.e., water intake + taste solution intake).
Two-bottle choice: 48 h tests with ascending concentrations.
The 96 h two-bottle screen was excellent for obtaining robust taste preference phenotypes from individual animals and small groups, but it was limited in that it provided information about single concentrations of only a small set of taste compounds. To obtain a more detailed characterization of the taste preferences of inbred, congenic, and Itpr3 KO mice, we used 48 h tests with 21 taste compounds presented in ascending concentrations, which is the standard procedure for testing groups of animals.
The compounds were chosen as examples of each basic taste modality or as members of classes that could be similar to calcium (for example, mineral salts). Each mouse was tested with two to six taste compounds. The order of tests was determined partly by our interests and partly to reduce carry-over effects [e.g., sucrose and Polycose were tested separately (79)]. Concentrations were chosen with the goal of covering the range from indifference to strong avoidance (or strong preference for the sweeteners and Polycose). In most cases, concentrations increased progressively in half-log steps (e.g., 0.316, 1, 3.16, 10 mM) but 1) for NaCl and Na3HP2O7, additional concentrations were tested to straddle the expected peak in preference (34, 69), and 2) for sucrose, maltose, and Polycose concentrations progressively doubled to be consistent with earlier work. Test series that produced results with high variability were repeated using additional cohorts of mice (see Tables 1–3).
Table 3.
Analyses of Itpr3 WT and KO mice two-bottle choice test preference scores
| Two-way ANOVA |
||||||
|---|---|---|---|---|---|---|
| Compound | Cohort and Order | Group Composition | Group | Concentration | Group × Concentration | Concentrations Supporting Strain Differences |
| Saccharin | 5b | 9 WT, 8 KO (M) | F(1,15) = 23.5, P = 0.0002 | F(6,90) = 5.09, P = 0.0002 | F(6,90) = 2.97, P = 0.0108 | 1, 3.2, 10, 32 mM |
| Sucrose | 1b | 11 WT, 11 KO (F) | F(1,20) = 15.7, P = 0.0007 | F(7,140) = 45.9, P < 0.0001 | F(7,140) = 3.50, P = 0.0017 | 1, 2, 4% |
| Maltose | 4b | 8 WT, 8 KO (F) | F(1,14) = 23.8, P = 0.0002 | F(7,98) = 29.2, P < 0.0001 | F(7,98) = 3.92, P = 0.0008 | 1, 2, 4, 8% |
| Polycose | 3b | 9 WT, 9 KO (M) | F(1,16) = 16.6, P = 0.0008 | F(7,112) = 27.6, P < 0.0001 | F(7,112) = 4.66, P = 0.0001 | 0.5, 1, 2, 4, 20% |
| MSG | 6a, 8a | 18 WT, 16 KO (F) | F(1,32) = 2.33, P = 0.1368 | F(6,192) = 32.70, P < 0.0001 | F(6,192) = 1.75, P = 0.1117 | 10, 32 mM* |
| IMP | 6b | 9 WT, 8 KO (F) | F(1,15) = 2.69, P = 0.1214 | F(8,120) = 16.4, P < 0.0001 | F(8,120) = 3.10, P = 0.0033 | 10, 32 mM |
| Na3HP2O7 | 7a | 8 WT, 8 KO (M) | F(1,14) = 19.9, P = 0.0008 | F(10,140) = 23.2, P < 0.0001 | F(10,140) = 6.05, P < 0.0001 | 5.6, 10, 18, 32, 56 mM |
| HCl | 2c | 9 WT, 10 KO (M) | F(1,17) = 353.6, P < 0.0001 | F(5,85)= 10.7, P < 0.0001 | F(5,85) = 1.16, P = 0.3360 | none |
| Citric acid | 1d | 11 WT, 11 KO (F) | F(1,19) = 4.33, P = 0.0512 | F(5,95) = 18.0, P < 0.0001 | F(5,95) = 0.63, P = 0.6744 | none |
| Denatonium | 1c, 7d | 8 WT, 9 KO(M) 11 WT, 10 KO (F) | F(1,36) = 14.6, P = 0.0005 | F(6,216) = 21.7, P < 0.0001 | F(6,216) = 3.98, P = 0.0009 | 0.032, 0.1, 0.32, 1 mM |
| QHCl | 2b | 9 WT, 10 KO (M) | F(1,17) = 34.6, P < 0.0001 | F(3,51) = 3.62, P = 0.0191 | F(3,51) = 1.33, P = 0.2760 | all* |
| Caffeine | 3c | 9 WT, 9 KO (M) | F(1,16) = 0.79, P = 0.3859 | F(4,64) = 27.0, P < 0.0001 | F(4,64) = 2.18, P = 0.0815 | none |
| ZnCl2 | 7c | 8 WT, 9 KO (F) | F(1,15) = 9.68, P = 0.0071 | F(4,60) = 49.8, P < 0.0001 | F(4,60) = 4.05, P = 0.0057 | 3.2, 10, 32 mM |
| Capsaicin | 2d | 9 WT, 10 KO (M) | F(1,17) = 5.77, P = 0.0280 | F(4,68) = 22.0, P < 0.0001 | F(4,68) = 0.80, P = 0.5280 | none |
| CaCl2 | 1a | 11 WT, 11 KO (F) | F(1,20) = 59.3, P < 0.0001 | F(4,80) = 18.6, P < 0.0001 | F(4,80) = 10.3, P < 0.0001 | 10, 32, 100 mM |
| CaLa | 2a | 9 WT, 10 KO (M) | F(1,17) = 53.6, P < 0.0002 | F(4,68) = 1.46, P = 0.2233 | F(4,68) = 3.81, P = 0.0075 | 1,3.2, 10, 32, 100 mM |
| MgCl2 | 3a, 8a | 18 WT, 18 KO (M) | F(1,34)= 23.2, P < 0.0001 | F(4,136) = 10.9, P < 0.0001 | F(4,136) = 1.27, P = 0.2861 | 10, 32 mM* |
| NaCl | 4a | 8 WT, 8 KO (F) | F(1,14) = 0.58, P = 0.4569 | F(5,70) = 22.8, P < 0.0001 | F(5,70) = 0.61, P = 0.6922 | none |
| NaLa | 5a | 9 WT, 8 KO (M) | F(1,15) = 0.70, P = 0.4150 | F(5,75) = 25.4, P < 0.0001 | F(5,75) = 1.20, P = 0.3162 | none |
| KCl | 4d, 5c | 9 WT, 8 KO (M) | F(1,31) = 7.95, P = 0.0083 | F(4,124) = 18.1, P < 0.0001 | F(4,124) = 3.03, P = 0.0201 | 100, 178 mM |
| 8 WT, 8 KO (F) | ||||||
| NH4Cl | 3d, 7b, 8b | 17 WT, 17 KO (M) | F(1,48) = 6.55, P = 0.0137 | F(5,240) = 26.9, P < 0.0001 | F(5,240) = 2.85, P = 0.0162 | 3.2, 32, 100 mM |
| 9 WT, 9 KO (F) | ||||||
Compounds are listed in the order presented in Figs. 3–5. Cohort and order provides batch of mice (1–8) and compounds tested in alphabetical order (a–d), with “a” being tested first, “b” second, and so on. Group composition gives number of wild-type (WT) and knockout (KO) mice tested; each cohort was either all M or all F. Concentrations supporting strain differences = P < 0.05 according to post hoc Fisher LSD tests.
Post hoc tests not strictly justified given the nonsignificant interaction (although a significant main effect of group). The analysis of KCl preferences omitted results of the test with 562 mM KCl because 18 of 33 mice spilled this concentration.
In each test series, the mice first received two drinking tubes containing deionized water for 48 h and then a choice between deionized water and ascending concentrations of the taste compound, with each test lasting 48 h. The positions of the two bottles were switched every 24 h. Body weights were measured at the beginning of each experiment. Daily water intakes were determined from the sum of intakes when the mice received two bottles of water at the start of each concentration series. A single value was obtained from each mouse by averaging across all water vs. water tests it received, and this was used in subsequent analyses of water intake.
We initially used analyses of variance (ANOVAs) with factors of strain and sex to compare parental strain body weights and consumption of fluids (with an additional factor of Concentration when appropriate) during two-bottle choice tests. Consistent with other results from our laboratory (e.g., Refs. 68–70), there were no sex differences in preferences for any of the taste compounds that were presented to both male and female mice. Consequently, we combined the results from both sexes for analyses of preference scores. Post hoc least significant difference (LSD) tests were used to assess differences between the groups in consumption of specific concentrations of a taste compound and to determine differences in response of each group to individual concentrations of each taste compound. One-sample t-tests were used to determine whether the preference scores of a group differed significantly from indifference (i.e., 50% preference). All analyses were conducted using a criterion for significance of P < 0.05 (Statistica 10; Stat Soft, Tulsa, OK).
Brief-access taste tests.
Long-term two-bottle choice tests provide a measure of taste solution preference, but this is not necessarily mediated by taste. To obtain a measure of taste solution acceptance that was less prone to “contamination” by postingestional effects, we used gustometers to measure licking responses during brief-exposure taste tests. The methods were modeled on those used by other groups (15, 24, 57) with differences described below. Two batches of inbred mice and two batches of congenic mice were tested, with at least eight mice in each group and the test order as specified in Table 4.
Each MS160-mouse gustometer consists of a 14.5 × 30 × 15 cm test chamber with a motorized shutter that controls access to a taste solution. Bottles of taste solution are mounted on a rack that is positioned so that any of eight different taste solutions can be presented to the mouse. The drinking spout of each bottle is part of a high-frequency alternating current contact circuit so that each lick the mouse makes is detected and recorded. Details of construction and other technical information are available elsewhere (24, 57). To avoid any undue influence of subtle differences between the gustometers we used, we ensured that each mouse was always tested in the same gustometer and that equal numbers of each group were tested in each gustometer.
The mice were weighed daily, immediately before being placed into a gustometer. To train a mouse to sample taste solutions, it was first water-deprived for 22.5 h and then placed in a gustometer with the shutter open, allowing access to the water spout. During this first training session, the mouse had continuous access to water for 25 min from the time it first licked the drinking spout. It was then returned to its home cage and given water for 1 h. On the following 2 days, this procedure was repeated, except the shutter allowing access to water was closed 5 s after each time the mouse began to lick, and it was reopened after a 7.5 s interval. Once again, after 25 min, the mouse was returned to its home cage and given water for 1 h. By the 2nd test using these procedures, all mice had learned to obtain water during the 5 s access periods.
The mice then began test sessions with various taste compounds (listed in Table 4). Only one taste compound was used during a session; it was presented in five different concentrations (including water). The deprivation regimen used to investigate the response to sucrose and Polycose differed from that used to investigate the response to the other taste compounds because the mice need less deprivation to consume the hedonically positive tastes (24). Prior to a session with sucrose or Polycose, each mouse received free access to food and water for 24 h. It then received 1 g of food and 2 ml of water, and the session began 24 h later. After these sessions, the mouse had a recovery day with free access to food and water for 24 h. Its water was then removed for 22.5 h to prepare it for the next session. After sessions with hedonically negative compounds, each mouse had ad libitum access to food but received water for only 1 h in its home cage; it was then water-deprived for ∼22.5 h in preparation for the next session.
When the two hedonically positive compounds were being investigated, the session began with a single test of the highest concentration available to kindle the mouse's interest in the drinking spout. After this, repeated series of five concentrations (including water) were presented in a quasirandom order such that a concentration could appear only once in a series of five tests. For each exposure, the shutter was open for 5 s, during which licks of the drinking spout were counted. This was followed by 7.5 s with the shutter closed, during which a new taste solution was positioned ready for the next presentation. For sessions with hedonically negative compounds, repeated series of five concentrations (including water) were presented in randomized order. Additional 1 s “washout” trials with water were interposed between each test trial. Thus, a mouse received access to a hedonically negative taste solution for 5 s followed by 7.5 s with the shutter closed, then access to water for 1 s followed by 7.5 s with the shutter closed, followed by the next taste solution for 5 s, and so on. We think the 1 s washout trials with water have the effect of cleansing the mouse's palate and help prevent it from quitting because it expects only bad-tasting solutions. All test sessions consisted of 180 spout presentations (90 of which were washout tests for the hedonically negative compounds) although all mice stopped drinking well before the session ended.
For statistical analyses, we obtained the mean number of licks made by each mouse in response to each concentration of each taste compound by averaging together the results from identical exposures. Mice that did not respond to any of the 18 presentations of a particular concentration of a taste compound were not included in statistical analyses of that compound. Analyses involved mixed-design two-way ANOVAs with factors of strain and concentration, followed by post hoc LSD tests to assess strain differences in lick rates for specific concentrations of taste solution and to assess differences in response of each strain to individual concentrations of each taste compound relative to water lick rates.
Generation and Testing of BTBR × NZW F2 Hybrids
Mating scheme.
Ten male and 10 female mice from the BTBR and NZW strains were bred in our facility to produce BTBR × NZW F1 mice, and these were mated brother-to-sister to produce F2 mice. A total of 610 F2 hybrids (309 male, 301 female) were bred and successfully tested.
Phenotyping.
Phenotyping was conducted using the 96 h two-bottle choice tests developed for screening (see above). All 610 F2 mice were tested (in 10 batches of 17–129 mice), but data from 26 out of 5,983 tests were lost due to spilled drinking tubes or other technical problems. Consequently, analyses were based on the results of 606–610 mice.
DNA extraction and genotyping.
Genomic DNA was extracted and purified from mouse tails by a sodium hydroxide method (73). Genotyping was conducted by The Center for Inherited Disease Research (CIDR, Johns Hopkins University). There were 626 informative (polymorphic) markers, with the average distance between markers of 4 Mb (2.8 cM). DNA samples purchased from The Jackson Laboratory as well as parental and F1 DNA from our laboratory were included as controls in the genotyping analysis. As a second quality control, blind duplicate DNA samples were genotyped. After the typing was completed, the code was broken and duplicate samples were matched and the data compared, with 99.996% agreement among duplicates (50,016 of 50,018 paired genotypes).
Linkage analysis.
Genome-wide screens of the F2 mice were conducted using markers from all autosomes. Linkage between individual traits and genotypes was assessed using algorithms implemented by the R/qtl 1.04–53 package of R (10). Genotype probabilities and genotyping errors were estimated using the “calc.genoprob” function. Interval mapping by maximum likelihood estimation was conducted to screen for main-effect QTLs using the “scanone” function (normal model, EM scan method). The significance of each marker regression result was established from 1,000 permutations of the observed data using the “n.perm” function.
Because several of the frequency distributions were skewed (see Frequency distributions, below), in initial analyses we compared the interval maps obtained with data that were untransformed to those obtained with data normalized by log or arcsin transformation. The transformations produced very little difference in the resulting interval maps so, for simplicity, we present the untransformed results here. We also looked for sex-related effects. We used R/qtl to calculate logarithm of odds (LOD) scores under Model_additive and Model_sex interaction (56) and the difference in LOD score was calculated using the “arithscan” function. To quantify sex-by-genotype interactions, we compared the fit of the two models using the difference in LOD scores as a metric (ΔLOD). With a ΔLOD ≥ 3.1 as a criterion (21), there were no sex-related effects in any analysis so sex was not included as a factor in the results reported here.
Breeding and Testing of BTBR.NZW-Drinksac6 Congenic Mice (BTBR/NZW) and BTBR/BTBR Controls
Our linkage analyses revealed a locus influencing taste preferences on Chr 17 (see below), so to isolate this we produced a congenic line. BTBR.NZW F1 mice were backcrossed to the BTBR strain. The offspring were phenotyped, starting when 6–8 wk old, with 1) a 96 h choice between two bottles of water, 2) a 96 h choice between water and 2 mM saccharin solution, and 3) a 96 h choice between water and 50 mM CaCl2 solution. The position of the bottles was switched every 24 h, and intakes were recorded every 48 h. Mice with felicitous recombinations and appropriate phenotypes were used as parents for subsequent generations, which were produced by backcrossing to BTBR mice. As backcrossing progressed, the panel of single nucleotide polymorphism (SNP) markers was extended to more precisely localize the regions where recombination occurred. Recombinations that narrowed the congenic interval occurred in the 4th, 6th, 8th, and 10th backcross generations, so these mice were used to start new lines, and once successful breeding was established, lines with larger congenic intervals were abandoned. In the 11th backcross generation, the congenic interval supporting the phenotypes involved a 0.8 Mb (max) region on Chr 17 bounded by a recombination between rs47196150 and rs33434357 (26.66–26.70 Mb) proximally, and rs33071006 and rs3656446 (27.26–27.48 Mb) distally. This region contains 14 known and seven unknown (predicted) genes (Table 5) The phenotypic values for these mice (n = 14) relative to littermates homozygous for BTBR in this region (n = 24) were as follows: total water intake, controls = 5.7 ± 0.2 ml/day, congenics = 4.7 ± 0.3 ml/day; 2 mM saccharin preference, controls = 45 ± 3%, congenics = 76 ± 4%; 50 mM CaCl2 preference, controls = 44 ± 2%, congenics = 20 ± 5%. Thus, the phenotypes were preserved.
Table 5.
List of known genes in the congenic interval between rs47196150 and rs3656446 on Chr 17
| Start | End | Gene | Name |
|---|---|---|---|
| 26698471 | 26792295 | Ergic1 | endoplasmic reticulum-golgi intermediate compartment 1 |
| 26813363 | 26836589 | Atp6v0e | ATPase, H+ transporting, lysosomal V0 subunit E |
| 26918024 | 26929510 | Bnip1 | BCL2/adenovirus E1B interacting protein 1 |
| 26975610 | 26978510 | Nkx2-5 | NK2 transcription factor related, locus 5 |
| 27054036 | 27069524 | Kifc1 | kinesin family member C1 |
| 27070072 | 27074835 | Phf1 | PHD finger protein 1 |
| 27074918 | 27076423 | Cuta | cutA divalent cation tolerance homolog |
| 27094363 | 27107590 | Syngap1 | synaptic Ras GTPase activating protein 1 |
| 27110112 | 27113150 | Zbtb9 | zinc finger and BTB domain containing 9 |
| 27156755 | 27165954 | Bak1 | BCL2-antagonist/killer 1 |
| 27110162 | 27173323 | Ggnbp1 | gametogenetin binding protein 1 |
| 27194249 | 27259168 | Itpr3 | inositol 1,4,5-triphosphate receptor 3 |
| 27280914 | 27304709 | Ip6k3 | inositol hexaphosphate kinase 3 |
| 27326702 | 27340693 | Lemd2 | LEM domain containing 2 |
Start and end refers to bp position on Chr 17 (NCBI build 37). Table does not include 7 predicted genes in the congenic interval.
According to standard nomenclature (29), this new congenic strain is described based on the captured QTL as BTBR.NZW-Drinksac6 or, based on the physical limits of the congenic interval as BTBR.NZW-(rs47196150-rs3656446)/Mon. Mice of the 11th generation were backcrossed to produce sufficient N12 mice to conduct a detailed investigation of the taste preferences associated with the congenic line (described above). For brevity, we refer to the mice as “BTBR/NZW congenics” and “BTBR/BTBR controls” here. Note that the “control” mice (carrying BTBR/BTBR alleles in the congenic interval) show the abnormal phenotype; the congenic mice (carrying BTBR/NZW alleles) have preferences akin to those of the NZW strain, which are similar to those observed in most other strains.
Production of Itpr3 KO Mice
Our studies with Chr 17 congenic mice led us to engineer mice with a KO of a gene, Itpr3, in the congenic interval. To do this, we purchased C57BL/6 ES cell clones from the North American Conditional Mouse Mutagenesis project (NorCOMM, ES cell line MFGC N01293P1_W239C5). The clones involve deletion of 300 bp spanning Exon 2 of Itpr3 (Chr 17: 27194249–272194548) and were verified and isolated by the University of Pennsylvania Gene Targeting Service (Dr. Tobias Raabe). They were injected into BALB/c blastocysts at the Transgenic and Chimeric Mouse Facility at the University of Pennsylvania (Dr. Jean Richa). The first batch of clones resulted in 12 male and six female offspring, which ranged between 10 and 95% chimeric (judged by coat color: white = BALB/c, black = B6). Males with the greatest chimerism (dark coat color) were mated with C57BL/6J females; the offspring with all black coats were mated brother-to-sister to produce homozygous KOs. Germ line transmission was verified by genotyping for the presence of Lac Z and Neo vectors (in-house and Transnetyx).
Sequencing the NZW and BTBR Forms of Itpr3
According to the reference sequence based on the C57BL/6NJ mouse strain, Itpr3 has 58 exons (http://www.ensembl.org/Mus_musculus/Transcript/Exons?db=core;g=ENSMUSG00000042644;r=17:27057304–27122223;t=ENSMUST00000049308). We sequenced all 58 exons of Itpr3 from BTBR, NZW, and C57BL/6J mice. Genomic DNA purchased from the Jackson Laboratory was diluted to 10 ng/μl, and primers flanking each exon were designed using Primer-BLAST (http://www.ncbi.nlm.nih.gov/tools/primer-blast/) or Primer3 (frodo.wi.mit.edu/). The DNA was amplified by PCR using HotMaster Taq DNA Polymerase (5 PRIME) under the recommended conditions, and PCR products were visualized on 1% agarose gels (90 V, 30 min). DNA bands of the appropriate sizes were excised from the gel and purified using the QIAquick Gel Extraction Kit (QIAGEN). Purified DNA and primers were analyzed using Sanger Sequencing (ABI 3730) by the University of Pennsylvania DNA Sequencing Facility. The resulting sequences were aligned and analyzed using Sequencher 5.0 software.
Exon 20 proved intransigent to sequencing (i.e., none of the purified DNA from this region returned sequences) so it was approached more intensively. We first selected eight primer pairs spanning the ∼2,000 bases of this exon. Sequencing of seven of these segments was successful. To sequence the remaining stubborn 200 bp region, a primer walk was conducted by taking 5 bp steps starting upstream of the closest working primer distal to exon 20. All of the primers used in the primer walk produced bands, which were purified and sequenced as described above.
The exonic sequences of NZW and C57BL/6J forms of Itpr3 were identical to the C57BL/6NJ reference sequence, except for five synonymous SNPs. The BTBR form of Itpr3 was also identical to the reference sequence except for a 12 bp deletion in Exon 23 (Chr 17: 27238069, National Center for Biotechnology Information Build 7), which codes for amino acids 983–986. To confirm the sequencing results, DNA from BTBR and NZW mice was amplified by PCR using primers that closely flanked the deletion. PCR products were then visualized on a 4% agarose gel (90 V, 90 min). This revealed bands that were 12 bp smaller in the BTBR than NZW DNA. The 12 bp deletion appeared to be unique to the BTBR strain in that it was not present in any of the 18 strains sequenced by the Sanger Mouse Genomes Project (http://www.sanger.ac.uk/resources/mouse/genomes).
A SNP (rs108851476) between B6 and BALB/c mice in the 335th amino acid of Itpr3 is responsible for a Pro-Leu polymorphism that influences receptor function and intracellular calcium signaling (30). However, this SNP is not polymorphic between the BTBR and NZW strains so cannot be responsible for the differences observed here.
RESULTS
Comparison of Parental Strains
Body weight.
Male BTBR mice were slightly but significantly heavier than were male NZW mice; there was no difference in the body weights of females of the two strains. For example, at the start of 96 h choice tests, when mice were aged 43–60 days (average 53 ± 0.8 days), the four sex-strain groups weighed (means ± SE, g): BTBR male = 28.5 ± 0.5, NZW male = 25.2 ± 0.7, BTBR female = 24.0 ± 0.6, NZW female = 23.0 ± 0.3 [strain × sex interaction, F(1,60) = 9.13, P = 0.0037].
Water intake.
The BTBR mice drank significantly more water than did the NZW mice [Fig. 1; F(1,174) = 8.87, P = 0.0033] with no difference between the sexes and no strain × sex interaction [means ± SE (n), ml/day; BTBR male = 4.9 ± 0.2 (45), NZW male = 4.1 ± 0.2 (46), BTBR female = 5.3 ± 0.2 (43), NZW female = 4.6 ± 0.2 (44)].
Fig. 1.

Daily water intakes of mice in 4 experiments. Inbred = NZW and BTBR parental strains; F2 = BTBR × NZW F2 hybrid mice categorized by alleles at rs3693494, a marker on chromosome 17; Chr 17 = chromosome 17 BTBR/NZW congenic mice and BTBR/BTBR controls; knockout (KO) = Itpr3 wild-type (WT) and KO mice (on a C57BL/6 background). Bars show means ± SE; values below the columns are the numbers of mice contributing to the mean. Water intake of each mouse was an average of 1–6 48 h 2-bottle choice tests that occurred at the beginning of each taste solution concentration series, or a single 96 h 2-bottle choice test (for the F2 experiment). Legend refers to alleles of Itpr3 each group possesses. *P < 0.005.
TWO-BOTTLE CHOICE TESTS.
In 96 h two-bottle choice tests, the BTBR mice had significantly higher preference scores than did the NZW mice for 50 mM CaCl2 and 50 mM CaLa; they had significantly lower preference scores for 2 mM saccharin and 5 mM citric acid. Preference scores of the NZW strain for all solutions were significantly different from 50% (i.e., indifference). In contrast, the BTBR strain's response to 50 mM CaCl2, 50 mM CaLa, 50 mM MgCl2, 100 mM KCl, 2 mM saccharin, and 0.1 mM QHCl did not differ from 50% (Fig. 2).
Fig. 2.
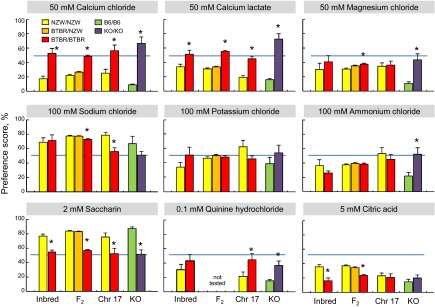
Results of 4 experiments yielding preference scores for 9 taste solutions in 4-day 2-bottle choice tests. Inbred = NZW and BTBR parental strains; F2 = BTBR × NZW F2 hybrid mice categorized by alleles at rs3693494, a marker on chromosome 17; Chr 17 = chromosome 17 BTBR/NZW congenic mice and BTBR/BTBR controls; KO = Itpr3 WT and KO mice (on a C57BL/6 background). Legend refers to alleles of Itpr3 each group possesses.
In 48 h choice tests, relative to NZW mice, BTBR mice had significantly higher preferences for all three concentrations of CaCl2 and CaLa, 0.32–3.2 mM denatonium, 0.032 mM QHCl, and 1–10 mM caffeine. The BTBR mice had significantly lower preferences for 100 and 178 mM NaCl, 3.2–56 mM Na3HP2O7, 3.2–32 mM inosine monophosphate (IMP), 3.2–32 mM saccharin, and 4 and 8% sucrose. The BTBR stain also had lower preferences for HCl overall and tended to have lower preferences for citric acid (Figs. 3–5 and Table 1).
Fig. 3.

Two-bottle choice preference scores of inbred (left), congenic (middle), and Itpr3 KO (right) mice. Horizontal dotted lines show indifference (50% preference). Results of statistical analyses are given in Table 1.
Fig. 4.

Sour, bitter, and other 2-bottle choice preference scores of inbred (left), congenic (middle), and Itpr3 KO (right) mice. Horizontal dotted lines show indifference (50% preference). Results of statistical analyses are given in Table 2.
Fig. 5.

Mineral salt 2-bottle choice preference scores of inbred (left), congenic (middle), and Itpr3 KO (right) mice. Horizontal dotted lines show indifference (50% preference). Results of statistical analyses are given in Table 3.
Relative to water, the NZW strain preferred at least one concentration of saccharin, sucrose, Polycose, IMP, and Na3HP2O7 (Table 6). The BTBR strain also preferred some concentrations of saccharin, sucrose, Polycose, and Na3HP2O7, and also denatonium, caffeine, and the two calcium salts. Relative to the NZW strain, the BTBR strain had lower thresholds for behavioral avoidance of Na3HP2O7, HCl, and NaCl; it had higher thresholds for denatonium, QHCl, caffeine, MgCl2, and KCl, and unlike the NZW strain, it did not avoid any concentration of CaCl2 or CaLa (Figs. 3–5, Table 6).
Table 6.
Concentrations of each taste compound that produced a significant change in preference scores relative to indifference (50%)
| Avidity (Significantly >50%) |
Avoidance (Significantly <50%) |
|||||||||||
|---|---|---|---|---|---|---|---|---|---|---|---|---|
| Taste Compound | NZW | BTBR | BTBR/NZW Congenic | BTBR/BTBR Control | Itpr3 WT | Itpr3 KO | NZW | BTBR | BTBR/NZW Congenic | BTBR/BTBR Control | Itpr3 WT | Itpr3 KO |
| Saccharin | 1+ | 10 | 1+ | − | 0.32+ | − | − | − | − | − | − | − |
| Sucrose | 4%+ | 8%+ | 1%+ | 16%+ | 1%+ | 8%+ | − | − | − | − | − | − |
| Maltose | 0.5%+ | 4%+ | 0.5%+ | 4%+ | 1%+ | 4%+ | − | − | − | − | − | − |
| Polycose | 1%+ | 2%+ | 0.5%+ | 16%+ | 0.5%+ | 4%+ | − | − | − | 0.5–2% | − | 1% |
| MSG | 10–178 | 32 | 10–320 | 10–100 | 10–178 | 100–178 | 562 | 178+ | 562 | 562 | 316+ | 316+ |
| IMP | 3.2–32 | − | 1–100 | 1–100 | 1–32 | − | 100 | 100 | 100+ | 100+ | 316 | 316 |
| Na3HP2O7 | 3.2–32 | 10 | 1–10 | 1,10 | 5.6–56 | − | 100 | 56+ | 56+ | 32+ | 100+ | 56+ |
| HCl | − | − | 0.32 | − | 0.1–3.2 | 0.32–3.2 | 3.2+ | 1+ | 3.2+ | 1+ | 10 | 10 |
| Citric acid | − | − | 0.32, 3.2 | 0.1–0.32 | 0.1–0.32 | 0.1–0.32 | 0.1, 3.2+ | 0.1+ | 10 | 10 | 10 | 10 |
| Denatonium | − | 0.01 | − | 0.01, 0.32–1 | − | 0.03–0.32 | 0.32+ | 3.16 | 0.32+ | − | 0.32+ | 3.2 |
| QHCl | − | − | − | − | − | 0.1 | 0.01+ | 0.1 | 0.032+ | − | 0.01+ | − |
| Caffeine | − | 1–3.2 | − | − | 3.16 | − | 10+ | 32 | 10 | 10 | 1, 10+ | 10+ |
| ZnCl2 | − | − | − | − | 3.2–10 | − | 3.2+ | 3.2+ | 10+ | 10+ | 100 | 32+ |
| Capsaicin | − | − | − | − | − | − | 0.001+ | 0.001+ | 0.001+ | 0.001+ | 0.001+ | 0.003+ |
| CaCl2 | − | 7.5–25 | − | 10–32 | − | 10–32 | 7.5+ | − | 32+ | 100 | 10+ | 100 |
| CaLa | − | 7.5–75 | − | 10–32 | − | 3.2+ | 7.5+ | − | 10+ | − | 3.2+ | − |
| MgCl2 | − | − | − | − | − | − | 10+ | 100 | 100 | 100 | 10+ | 100 |
| NaCl | − | − | 32–178 | 32–178 | − | − | 316+ | 178 | 316+ | 316+ | 316+ | 178+ |
| NaLa | 32–178 | 32–178 | 32–100 | − | 32–178 | 100–178 | 562 | 320+ | 320+ | 178+ | 562 | 562 |
| KCl | − | − | 32–178 | − | 32–178 | − | 10, 100+ | 316 | 316+ | 178+ | 316+ | 316+ |
| NH4Cl | − | − | 3.2–100 | 32 | − | 32 | 316 | 316 | 316 | 316 | 316 | 316 |
Values are determined from two-bottle choice experiments, according to one-sample t-tests. Values are concentrations in millimoles or percent (%). −, No concentration was preferred (left columns) or avoided (right columns); +, all higher concentrations tested also influenced preferences.
BRIEF-ACCESS TESTS.
The NZW and BTBR mice licked water at similar rates, with the exception of the test involving QHCl, where the NZWs licked more than did the BTBRs (Fig. 6), perhaps due to successive contrast effects in the NZWs (see Ref. 25). The NZW mice had lick rates that would be expected of members of a sweet “taster” strain (28, 43). Relative to licking water, they avidly licked high concentrations of sucrose and Polycose and reluctantly licked high concentrations of denatonium, QHCl, capsaicin, CaCl2, and NaCl [similar to C57BL6/J or various wild-type mice (15, 24, 26, 53)]. The BTBR mice showed a different response pattern: They licked all concentrations of sucrose, Polycose, QHCl, and NaCl at rates that were statistically similar to water. They also showed significantly less reduction of licking than did the NZW mice to high concentrations of citric acid, denatonium, and CaCl2. The two strains had similar capsaicin concentration-response functions (Fig. 6, Table 4).
Fig. 6.

Lick rates of NZW and BTBR inbred mice (left panel of each pair) and Chr 17 BTBR/NZW congenic and BTBR/BTBR control mice (right panel of each pair) given 5 s to drink various concentrations of 12 taste solutions. *P < 0.05 relative to other group according to Fisher LSD tests. Results of statistical analyses are given in Table 4. Polycose concentrations are in mM based on a molecular weight of 1,000 g.
F2 Segregating Hybrid Mice
Sex and reciprocal cross effects.
We investigated the contribution of sex and parentage to the body weight and taste phenotypes of BTBR × NZW F2 mice by three-way ANOVAs with factors of sex, strain of maternal grandmother (F0), and strain of paternal grandmother. For these tests, we used a criterion for significance of P < 0.01, to provide some protection from errors due to the multiple tests involved.
Males were significantly heavier than females [body weight (g) at start of testing males, 32.4 ± 0.2 g (n = 306), females = 25.5 ± 0.2 g (n = 296)]. However, females drank significantly more water than did males (males = 5.6 ± 0.1 ml/day, females = 6.7 ± 0.1 ml/day), and this was true also of intakes of most taste solutions (MgCl2, KCl, NaCl, citric acid, QHCl, and saccharin; see Table 7). In general, females drank more water than did males in two-bottle choice tests, so the net result was for males and females to have similar preferences. Preference scores for CaLa, NH4Cl, and QHCl were significantly higher in males than females, and preference scores for KCl were significantly higher in females than males. However, these effects were tiny (a difference of 3–4%) except for NH4Cl preference scores, where males had markedly higher values than did females [43 ± 0% vs. 34 ± 0%, Table 7, similar to results we obtained with a B6 × PWK F2 cross (70)].
Table 7.
Taste solution intakes and preferences of BTBR × NZW F2 mice, arranged by sex
| Taste Solution Intakes, ml/day |
Preference Scores, % |
|||
|---|---|---|---|---|
| Taste Compound | M | F | M | F |
| Water | 5.6 ± 0.1 | 6.7 ± 0.1‡ | ||
| 50 mM CaCl2 | 1.8 ± 0.1 | 2.1 ± 0.1 | 31 ± 1 | 28 ± 1 |
| 50 mM CaLa | 2.1 ± 0.1 | 2.3 ± 0.1 | 39 ± 1 | 35 ± 1† |
| 50 mM MgCl2 | 1.8 ± 0.1 | 2.1 ± 0.1† | 36 ± 1 | 32 ± 1 |
| 100 mM KCl | 2.6 ± 0.1 | 3.6 ± 0.1‡ | 47 ± 0 | 50 ± 0† |
| 100 mM NH4Cl | 2.2 ± 0.1 | 2.3 ± 0.1 | 43 ± 0 | 34 ± 0‡ |
| 100 mM NaCl | 4.7 ± 0.1 | 6.9 ± 0.2‡ | 76 ± 0 | 76 ± 0 |
| 5 mM citric acid | 1.6 ± 0.0 | 2.0 ± 0.1‡ | 34 ± 0 | 31 ± 1 |
| 30 μM QHCl | 1.5 ± 0.0 | 1.9 ± 0.1‡ | 36 ± 0 | 32 ± 1‡ |
| 2 mM saccharin | 4.5 ± 0.1 | 6.5 ± 0.2‡ | 76 ± 0 | 78 ± 0 |
M/F differences assessed from 3-way ANOVAs main effect, with 1 and approximately 595 df:
P < 0.005,
P < 0.001, Values are means ± SE, of 309 M and 301 F (slightly fewer if a mouse spilled). Body weights at start of testing were M = 32 ± 0.2 g, F = 26 ± 0.2 g.
There were some complex effects related to 1) the strain of paternal grandmother interacting with the strain of maternal grandmother influencing citric acid intake (Table 8), 2) the sex of a mouse interacting with the strain of its parental grandmother affecting KCl intake, saccharin intake, and saccharin preference (Table 9), and 3) the strain of the paternal grandmother affecting QHCl intake [BTBR paternal grandmother = 1.9 ± 0.1 ml/day (n = 208), NZW paternal grandmother = 1.6 ± 0.1 ml/day(n = 395), F(1,595) = 8.06, P = 0.0047].
Table 8.
Results of analyses of reciprocal cross (maternal and paternal strain effects) on taste solution intakes and preferences of BTBR × NZW F2 mice: influence of strain of maternal and paternal grandmother on citric acid intake
| Maternal Grandmother | Paternal Grandmother | Group Size, n | Citric Acid Intake, ml/day |
|---|---|---|---|
| BTBR | BTBR | 152 | 1.8 ± 0.1 |
| BTBR | NZW | 105 | 1.9 ± 0.1 |
| NZW | BTBR | 56 | 2.2 ± 0.1 |
| NZW | NZW | 288 | 1.6 ± 0.1 |
Interaction, F(1,593) = 7.89, P = 0.0051.
Table 9.
Results of analyses of reciprocal cross (maternal and paternal strain effects) on taste solution intakes and preferences of BTBR × NZW F2 mice: interactions of strain of paternal grandmother with sex
| Sex | Paternal Grandmother | Group Size, n | KCl Intake, ml/day | Saccharin Intake, ml/day | Saccharin Preference Score, % |
|---|---|---|---|---|---|
| F | BTBR | 91 | 4.2 ± 0.2 | 7.3 ± 0.3 | 82 ± 2 |
| F | NZW | 205 | 3.4 ± 0.1 | 6.0 ± 0.2 | 77 ± 1 |
| M | BTBR | 116 | 2.6 ± 0.2 | 4.5 ± 0.2 | 75 ± 2 |
| M | NZW | 191 | 2.6 ± 0.1 | 4.8 ± 0.2 | 79 ± 1 |
| Interaction | F(1,595) | 7.08, P= 0.0080 | 11.0, P= 0.0010 | 7.78, P= 0.0055 |
Frequency distributions.
To visualize the shape of the distribution and test for normality, the scores for each trait were assigned to 25 equal-sized bins of 4% preference each. Separate distributions for solution intake and preference for each sex were plotted, but, for brevity, only the combined preference distributions of both sexes are shown here (Fig. 7). Normality was assessed by Lilliefors tests. All distributions deviated significantly from normality, except for NH4Cl preferences (Fig. 7).
Fig. 7.
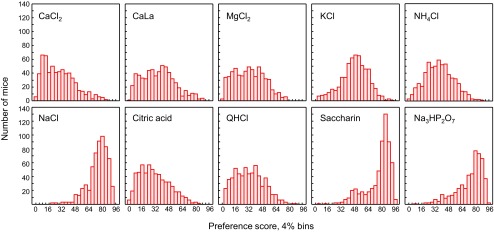
Distributions of preference scores of ∼610 BTBR × NZW F2 mice.
Interval Mapping
Locus on Chr 17.
The most remarkable results involved a set of 14 linkages to Chr 17 (Table 10, Fig. 8). Highly significant linkages were present with peaks at one of two adjacent markers (either rs3672065 or rs3693494 at Chr 17: 14.3 or 29.9 Mb). These included intakes of water and seven taste solutions and preferences for six taste solutions (Table 10). Extraordinarily strong linkages were present for saccharin preference (LOD = 100.8, accounting for 31% of the phenotypic variance) and the intake and preference of CaCl2 and CaLa (LODs > 34.0, accounting for >17% of the phenotypic variance; Table 10). In every case, mice with the NZW/NZW and BTBR/NZW genotypes at this locus had statistically identical phenotypes, which differed from mice with the BTBR/BTBR genotype, implying dominance of the NZW allele. The action of this allele was to decrease intake of water, CaCl2, CaLa, MgCl2, NH4Cl, and NaCl but increase intake of saccharin. It decreased preference scores for CaCl2 and CaLa but increased preference scores for NaCl, citric acid, saccharin, and Na3HP2O7. The apparent contradiction of the same allele decreasing NaCl intake but increasing NaCl preference can be explained by consideration of the effect of the NZW allele on water intakes (Fig. 9).
Table 10.
QTLs on Chr 17 influencing water and taste solution intake and preference, with means ± SEs for each genotype
| Intake, ml/day |
Preference Score, % |
||||||||||
|---|---|---|---|---|---|---|---|---|---|---|---|
| QTL ID | Fluid Ingested | LOD Score | % Variance | BTBR/BTBR (n = 134) | BTBR/NZW (n = 314) | NZW/NZW (n = 162) | LOD Score | % Variance | BTBR/BTBR (n = 134) | BTBR/NZW (n = 314) | NZW/NZW (n = 162) |
| Drinkwater2 | water | 15.9 | 9.2 | 7.4 ± 0.2 | 5.9 ± 0.1a | 5.5 ± 0.1a | |||||
| Drinkcacl25 | CaCl2 | 56.7 | 26.8 | 3.5 ± 0.1 | 1.6 ± 0.1a | 1.3 ± 0.1a | 44.6 | 22.6 | 48 ± 2 | 27 ± 1a | 22 ± 1a |
| Drinkcala4 | CaLa | 58.6 | 25.2 | 3.9 ± 0.1 | 1.8 ± 0.1a | 1.7 ± 0.1a | 34.3 | 17.2 | 55 ± 2 | 34 ± 1a | 31 ± 1a |
| Drinkmgcl26 | MgCl2 | 13.0 | 8.3 | 2.6 ± 01 | 1.9 ± 0.1a | 1.7 ± 0.1a | 2.5 | 1.8 | 38 ± 1 | 35 ± 1 | 31 ± 1a |
| Drinkkcl6 | KCl | 4.5 | 2.5 | 3.5 ± 0.1 | 3.1 ± 0.1a | 2.8 ± 0.1a | 1.0 | 0.2 | 48 ± 1 | 50 ± 1 | 47 ± 1 |
| Drinknh4cl3 | NH4Cl | 6.5 | 3.7 | 2.7 ± 0.1 | 2.2 ± 0.1a | 2.0 ± 0.1a | 0.1 | 0.1 | 39 ± 2 | 39 ± 1 | 38 ± 1 |
| Drinknacl3 | NaCl | 5.5 | 3.6 | 6.8 ± 0.3 | 5.7 ± 0.1a | 5.3 ± 0.2a | 3.8 | 1.6 | 73 ± 1 | 78 ± 1a | 78 ± 1a |
| Drinkcitric1 | citric acid | 1.5 | 1.1 | 1.6 ± 0.1 | 1.8 ± 0.1 | 1.9 ± 0.1 | 10.5 | 6.4 | 24 ± 1 | 34 ± 1a | 37 ± 1a |
| Drinkqhcl3 | QHCl | 1.8 | 1.2 | 1.9 ± 0.1 | 1.7 ± 0.1 | 1.6 ± 0.1 | 1.2 | 0.3 | 32 ± 1 | 36 ± 1 | 35 ± 1 |
| Drinksac6 | saccharin | 9.0 | 3.6 | 4.2 ± 0.2 | 5.9 ± 0.2a | 5.7 ± 0.2a | 100.8 | 31.4 | 57 ± 1 | 83 ± 1a | 84 ± 1a |
| Drinkpyro1 | Na3HP2O7 | 0.1 | 0.0 | 4.4 ± 0.2 | 4.5 ± 0.1 | 4.5 ± 0.2 | 33.2 | 19.4 | 60 ± 2 | 78 ± 1a | 81 ± 1a |
The peak of all quantitative trait loci (QTLs) was at rs3693494 (29.9 Mb), or the adjacent marker rs3672065 (14.3 Mb) for KCl intake, NH4Cl intake and preference, and NaCl preference. Logarithm of odds (LOD) scores in boldface are significant (P < 0.01). Group sizes (n) were slightly smaller for some tests because of measurement errors or missing genotypes.
P < 0.01 different from mice with BTBR/BTBR genotype. The percentage of phenotypic variance (% variance) by variation in the locus was calculated as r2 from the correlation of number of NZW alleles (0, 1, or 2) with phenotype value.
Fig. 8.

Interval maps for intake and preference of water and taste solutions by 610 BTBR × NZW F2 mice. Faint horizontal lines are genome-wide significance levels for P < 0.05 (lower line) and P < 0.01 (upper line) based on preference scores. Note that the y-axes for CaCl2, CaLa, saccharin, and trisodium pyrophosphate (Na3HP2O7) are broken to accommodate the very high peaks on Chr 17.
Fig. 9.
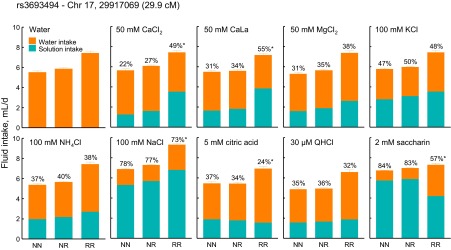
Stacked bar graphs showing contribution of taste solution and water to total daily fluid intake of BTBR × NZW F2 mice arranged by genotype at rs3693494 on Chr 17 (29.9 Mb). Percentages above bars give solution preference scores, which are plotted in Fig. 2. NN = NZW/NZW, NR = BTBR/NZW, RR = BTBR/BTBR.
Although they had marked differences in water intakes, there was no difference among mice with the three rs3672065 genotypes in body weight (e.g., at the end of behavioral tests, BTBR/BTBR = 29.9 ± 0.6 g, BTBR/NZW = 32.1 ± 0.5 g, NZW/NZW = 29.9 ± 0.6 g).
Other loci.
A cluster involving 13 linkages, with peaks at eight markers, was present on Chr 8. The most pronounced effects in this region were on preferences for CaCl2, CaLa, and MgCl2. The QTL peaks for these three taste solution preference scores did not coincide exactly, and there were two distinct QTL peaks for CaLa and three distinct peaks for MgCl2 (Fig. 8). On the other hand, confidence intervals of the QTLs (1.0 LOD drops from the peak) overlapped, and the mode of inheritance for each of these peaks was additive, with the NZW allele increasing preference scores. Thus, there may be a single locus influencing intake of calcium and magnesium salts or several closely spaced loci with similar functions. There was no evidence that this locus interacted with the major locus on Chr 17 (see Table 11). This region also had smaller, albeit significant, linkages to citric acid and QHCl preference, each with the same additive mode of inheritance as the more prominent linkages involving calcium and magnesium salts. This also supports the conclusion that there are several closely linked loci in this region.
Table 11.
Independent effects on 50 mM CaCl2 preference scores of loci on chromosome 8 and 17 in BTBR × NZW F2 cross
| Genotype on Chr 8, rs13479776 |
||||
|---|---|---|---|---|
| Genotype on Chr 17, rs3693494 | NZW/NZW | BTBR/NZW | BTBR/BTBR | Combined |
| NZW/NZW | 23 ± 2 (48) | 24 ± 1 (75) | 17 ± 2 (39) | 22 ± 1 (162)a |
| BTBR/NZW | 30 ± 1 (89) | 27 ± 1 (152) | 21 ± 2 (73) | 27 ± 1 (314)b |
| BTBR/BTBR | 57 ± 4 (34) | 46 ± 2 (76) | 45 ± 3 (23) | 49 ± 2 (133)c |
| Combined | 34 ± 2 (171)a | 31 ± 1 (303)a | 24 ± 1 (135)b | 30 ± 1 (609) |
Values are means ± SE (n) of CaCl2 preference scores, %. Similar differences were obtained with preferences for CaLa and MgCl2. Superscripts show differences between marginal means according to Fisher LSD post hoc tests. Effect of Chr 8: F(2,600) = 11.8, P < 0.0001. Effect of Chr 17: F(2,600) = 116.9, P < 0.0001; Chr 8 × Chr 17 interaction: F(4,600) = 1.94, P = 0.1016 (not significant).
Most of the remaining linkages had an LOD score of <5.0 and accounted for <3.5% of the phenotypic variance. The exceptions were linkages to saccharin intake on Chr 7 (at 64.8 Mb, LOD = 6.26), and both saccharin and water intake on distal Chr 11 (at ∼100 Mb; LOD = 6.17 and 5.50, respectively; Table 12). Of the 36 linkages in total, the NZW genotype provided the plus allele for 26, the BTBR was the plus allele for eight, and two displayed heterosis (i.e., the heterozygous mice did not fall between the two homozygous groups).
Table 12.
Other QTLs influencing water intake and taste solution intake and preference, with means ± SEs for each genotype
| QTL ID | Chr | Mb | Marker | Fluid | Measure | LOD Score | % Variance | BTBR/BTBR (n = 134) | BTBR/NZW (n = 314) | NZW/NZW (n = 162) |
|---|---|---|---|---|---|---|---|---|---|---|
| Drinkqhcl4 | 1 | 66.7 | rs13475902 | QHCl | intake | 3.76 | 2.2 | 1.6 ± 0.1 | 1.6 ± 0.1 | 1.9 ± 0.1ab |
| Drinkcitric2 | 1 | 118.5 | rs3695581 | citric acid | intake | 4.14 | 3.1 | 1.5 ± 0.1 | 1.8 ± 0.1 | 2.0 ± 0.1a |
| preference | 3.10 | 2.2 | 29 ± 1 | 33 ± 1a | 36 ± 1ab | |||||
| Drinkcacl26 | 2 | 73.2 | CEL-2_73370728 | CaCl2 | intake | 3.26 | 0.5 | 2.3 ± 0.1 | 1.8 ± 0.1a | 1.8 ± 0.1a |
| Drinkwater3 | 2 | 77.4 | gnf02.076.311* | water | intake | 4.06 | 2.9 | 6.6 ± 0.2 | 6.1 ± 0.1a | 5.6 ± 0.2ab |
| Drinkkcl7 | 2 | 77.4 | gnf02.076.311* | KCl | intake | 4.67 | 3.4 | 3.5 ± 0.1 | 3.1 ± 0.1a | 2.6 ± 0.1ab |
| Drinkwater4 | 6 | 132.1 | rs3722480 | water | intake | 3.32 | 0.2 | 5.6 ± 0.1 | 6.4 ± 0.1a | 5.9 ± 0.2b |
| Drinkqhcl5 | 7 | 31.3 | rs13479191 | QHCl | preference | 4.33 | 0.7 | 34 ± 1 | 37 ± 1a | 30 ± 1ab |
| Drinksac7 | 7 | 31.3 | rs13479191 | saccharin | intake | 4.31 | 2.8 | 5.0 ± 0.2 | 5.3 ± 0.2 | 6.3 ± 0.2ab |
| Drinksac8 | 7 | 51.8 | mCV23672419 | saccharin | intake | 6.26 | 3.8 | 5.0 ± 0.2 | 5.3 ± 0.1 | 6.5 ± 0.3ab |
| Drinkmgcl27 | 8 | 30.1 | rs4227096 | MgCl2 | preference | 6.09 | 4.4 | 30 ± 2 | 34 ± 1a | 40 ± 1ab |
| Drinkcala5 | 8 | 51.4 | CEL-8_51607005 | CaLa | preference | 7.76 | 5.1 | 29 ± 2 | 39 ± 1a | 42 ± 1a |
| Drinkcitric3 | 8 | 58.0 | rs3707439 | citric acid | preference | 3.30 | 2.3 | 29 ± 1 | 32 ± 1a | 37 ± 1ab |
| Drinkcacl27 | 8 | 60.3 | rs3672639* | CaCl2 | intake | 3.14 | 1.3 | 1.5 ± 0.1 | 2.1 ± 0.1a | 2.0 ± 0.1a |
| preference | 6.25 | 3.7 | 23 ± 1 | 32 ± 1a | 33 ± 1a | |||||
| Drinkmgcl28 | 8 | 84.3 | rs13479871 | MgCl2 | intake | 3.62 | 3.6 | 1.6 ± 0.1 | 2.0 ± 0.1a | 2.2 ± 0.1a |
| preference | 7.47 | 5.4 | 28 ± 2 | 35 ± 1a | 40 ± 1ab | |||||
| Drinkmgcl29 | 8 | 86.9 | rs13479884 | MgCl2 | intake | 5.02 | 3.4 | 1.6 ± 0.1 | 2.0 ± 0.1a | 2.2 ± 0.1a |
| preference | 7.31 | 5.2 | 28 ± 2 | 35 ± 1a | 39 ± 1ab | |||||
| Drinkcala6 | 8 | 96.7 | rs6287320 | CaLa | intake | 3.68 | 1.9 | 1.8 ± 0.1 | 2.3 ± 0.1a | 2.4 ± 0.1a |
| preference | 6.07 | 2.9 | 31 ± 2 | 39 ± 1a | 41 ± 1a | |||||
| Drinkqhcl6 | 8 | 101.6 | rs3669235 | QHCl | intake | 3.88 | 2.5 | 1.5 ± 0.1 | 1.6 ± 0.1 | 1.9 ± 0.1ab |
| preference | 3.22 | 2.2 | 31 ± 1 | 34 ± 1a | 38 ± 1ab | |||||
| Drinknacl4 | 9 | 103.6 | rs13480386 | NaCl | intake | 3.62 | 2.7 | 5.2 ± 0.2 | 5.9 ± 0.1a | 6.5 ± 0.2ab |
| Drinkcitric4 | 9 | 103.6 | rs13480386 | citric acid | preference | 3.66 | 2.4 | 37 ± 2 | 31 ± 1a | 30 ± 2a |
| Drinkkcl8 | 10 | 17.9 | rs3712394 | KCl | intake | 3.76 | 2.8 | 2.7 ± 0.1 | 3.1 ± 0.1a | 3.5 ± 0.1ab |
| Drinkcitric5 | 10 | 67.9 | rs13480630 | citric acid | intake | 4.60 | 3.3 | 2.0 ± 0.1 | 1.8 ± 0.1 | 1.5 ± 0.1ab |
| preference | 3.76 | 2.8 | 37 ± 1 | 33 ± 1a | 28 ± 1ab | |||||
| Drinkpyro2 | 10 | 69.5 | rs13480638* | Na3HP2O7 | preference | 4.36 | 3.3 | 78 ± 1 | 76 ± 1 | 70 ± 2ab |
| Drinksac9 | 11 | 96.4 | rs13481173 | saccharin | intake | 6.17 | 4.5 | 4.8 ± 0.2 | 5.4 ± 0.1a | 6.3 ± 0.2ab |
| Drinkwater5 | 11 | 103.4 | rs6393948* | water | intake | 5.50 | 4.0 | 5.5 ± 0.2 | 6.1 ± 0.1a | 6.7 ± 0.2ab |
| Drinkpyro3 | 11 | 103.4 | Na3HP2O7 | intake | 3.31 | 2.8 | 4.1 ± 0.1 | 4.6 ± 0.1a | 4.8 ± 0.1a | |
| Drinknacl5 | 12 | 50.7 | rs3700857 | NaCl | intake | 3.75 | 2.6 | 6.3 ± 0.2 | 5.9 ± 0.2a | 5.1 ± 0.2ab |
| Drinknh4cl4 | 12 | 101.8 | rs13481632 | NH4Cl | preference | 3.66 | 0.1 | 42 ± 1 | 36 ± 1a | 40 ± 1b |
| Drinkpyro4 | 13 | 87.3 | rs6288319 | Na3HP2O7 | preference | 3.52 | 3.0 | 72 ± 2 | 74 ± 1 | 80 ± 1ab |
| Drinknacl6 | 17 | 78.8 | gnf17.082.284 | NaCl | preference | 3.54 | 2.6 | 73 ± 1 | 77 ± 1a | 79 ± 1a |
All LOD scores are significant (P < 0.01). Group sizes (n) were slightly smaller for some tests because of measurement errors or missing genotypes. The peak of DrinkNaCl6 on Chr 17 is distinct from the rs3693494 peak (Table 10).
Adjacent to previous marker listed, suggesting there may be a common locus. Genetic coordinates are based on NCBI Build 35. Values are means ± SE, in ml/day for intakes or % for preference scores.
P < 0.01 different from mice with BTBR/BTBR genotype,
P < 0.01 different from mice with BTBR/NZW genotype. The percentage of phenotypic variance (% variance) accounted for by variation in the locus was calculated as r2 from the correlation of number of NZW alleles (0, 1, or 2) with phenotype value.
Comparison of Chr 17 BTBR/NZW Congenic Mice With BTBR/BTBR Littermates
Body weight.
There was no difference between the congenic mice and their controls in body weight. For example, at the start of the 96 h two-bottle choice test series, when the mice were 52–92 days old (average 65 ± 1 days) the four sex-strain groups weighed [means ± SE (g): BTBR/BTBR males, 30.9 ± 0.7, BTBR/NZW males = 31.7 ± 0.5, BTBR/BTBR females = 25.8 ± 0.4, BTBR/NZW females = 25.8 ± 0.4, main effect of strain, F(1,141) = 0.51, P = 0.4768; strain × sex interaction, F(1,141) = 0.74, P = 0.3899]. Males of both strains weighed more than did females: F(1,141) = 103.2, P < 0.0001.
Water intake.
Despite having similar body weights, the BTBR/NZW congenics and BTBR/BTBR controls differed significantly in daily water intakes [Fig. 1; means ± SE (n), ml/day; BTBR/BTBR males, 5.1 ± 0.2 (30), BTBR/NZW males = 4.0 ± 0.1 (38), BTBR/BTBR females = 6.3 ± 0.2 (53), BTBR/NZW females = 5.0 ± 0.1 (60), main effect of strain, F(1,177) = 52.9, P < 0.0001; strain × sex interaction, F(1,177) = 0.08, P = 0.7920]. Males of both strains drank more water than did females: F(1,177) = 45.1, P < 0.0001.
TWO-BOTTLE CHOICE TESTS.
In 96 h two-bottle choice tests, the BTBR/BTBR control mice had significantly higher preference scores than did the BTBR/NZW congenic mice for 50 mM CaCl2, 50 mM CaLa, and 0.1 mM QHCl; they had significantly lower preference scores for 100 mM NaCl, 2 mM saccharin, and 5 mM citric acid. Relative to water, the BTBR/NZW congenics preferred 100 mM NaCl, 100 mM KCl, and 2 mM saccharin; they avoided 50 mM CaCl2, 50 mM CaLa, 50 mM MgCl2, 0.1 mM QHCl, and 5 mM citric acid. In contrast, the BTBR/BTBR controls preferred none of the taste solutions more than water and avoided only 50 mM MgCl2 and 5 mM citric acid (Fig. 2).
In 48 h two-bottle choice tests, relative to BTBR/BTBR controls, the BTBR/NZW congenic mice had significantly lower preference scores for two of the three bitter compounds tested (0.01–3.2 mM denatonium and 0.032–0.1 mM QHCl, but not caffeine) and calcium (10–32 mM CaCl2 and CaLa). The congenics had significantly higher preference scores for at least one concentration of saccharin, all the carbohydrates tested (sucrose, maltose, and Polycose), IMP, citric acid, and KCl. The congenics also had higher preference scores for all the sodium salts tested (NaCl, NaLa, Na3HP2O7) and NH4Cl although in these cases, there were no differences between the groups at specific concentrations (i.e., no group × concentration interactions). The congenics did not differ from controls in response to ZnCl2, capsaicin, or MgCl2 (Figs. 3–5, Table 2).
Table 2.
Analyses of Chr 17 congenic mice two-bottle choice test preference scores
| Two-way ANOVA |
||||||
|---|---|---|---|---|---|---|
| Compound | Cohort and Order | Group Composition | Group | Concentration | Group × Concentration | Concentrations Supporting Strain Differences |
| Saccharin | 5b | 8 BB, 11 BN (F) | F(1,17) = 12.8, P = 0.0023 | F(6,102) = 15.3, P < 0.0001 | F(6,102) = 9.20, P < 0.0001 | 0.32, 1, 3.2, 10, 32 mM |
| Sucrose | 1b | 15 BB, 12 BN (F) | F(1,25) = 49.0, P < 0.0001 | F(7,175) = 51.6, P < 0.0001 | F(7,175) = 8.06, P < 0.0001 | 1, 2, 4, 8% |
| Maltose | 4b | 11 BB, 9 BN (F) | F(1,15) = 107.6, P < 0.0001 | F(7,105) = 32.8, P < 0.0001 | F(7,105) = 12.3, P < 0.0001 | 0.5, 1, 2, 4, 8% |
| Polycose | 3b | 9 BB, 17 BN (M) | F(1,24) = 36.8, P < 0.0001 | F(7,168) = 27.3, P < 0.0001 | F(7,168) = 9.67, P < 0.0001 | 0.5, 1, 2, 4, 8% |
| MSG | 3e, 6c | 16 BB, 26 BN (M) | F(1,39) = 21.3, P < 0.0001 | F(6,234) = 64.4, P < 0.0001 | F(6,234) = 1.92, P = 0.0775 | none |
| IMP | 1e | 15 BB, 12 BN (F) | F(1,25) = 30.2, P < 0.0001 | F(8,200) = 47.5, P < 0.0001 | F(8,200) = 3.12, P = 0.0024 | 1, 3.2, 10, 32, 100 mM |
| Na3HP2O7 | 4e | 11 BB, 9 BN (F) | F(1,17) = 7.31, P = 0.0150 | F(6,102) = 35.3, P < 0.0001 | F(6,102) = 1.99, P = 0.0737 | 3.2, 10 mM* |
| HCl | 7a | 7 BB, 9 BN (F) | F(1,14) = 10.2, P = 0.0065 | F(5,70) = 16.6, P < 0.0001 | F(5,70) = 3.72, P = 0.0048 | 0.32, 1, 3.2 mM |
| Citric acid | 1d | 15 BB, 12 BN (F) | F(1,25) = 0.89, P = 0.3543 | F(5,125) = 26.4, P < 0.0001 | F(5,125) = 1.53, P = 0.1851 | none |
| Denatonium | 1c | 15 BB, 12 BN (F) | F(1,25) = 60.3, P < 0.0001 | F(6,150) = 8.16, P < 0.0001 | F(6,150) = 10.9, P < 0.0001 | 0.01, 0.1,0.32, 1,3.2 mM |
| QHCl | 2c | 7 BB, 12 BN (F) | F(1,17) = 11.1, P = 0.0039 | F(3,51) = 6.33, P = 0.0085 | F(3,51) = 3.07, P = 0.0361 | 0.032, 0.1 mM |
| Caffeine | 3c | 9 BB, 17 BN (M) | F(1,24) = 0.66, P = 0.4260 | F(4,96) = 13.6, P < 0.0001 | F(4,96) = 0.57, P = 0.6873 | none |
| ZnCl2 | 4d | 11 BB, 9 BN (F) | F(1,17) = 1.80, P = 0.1974 | F(4,68) = 37.5, P < 0.0001 | F(4,68) = 0.71, P = 0.5865 | none |
| Capsaicin | 2e | 7 BB, 12 BN (F) | F(1,17) = 0.04, P = 0.8398 | F(4,68) = 49.8, P < 0.0001 | F(4,68) = 0.50, P = 0.7366 | none |
| CaCl2 | 1a | 15 BB, 12 BN (F) | F(1,25) = 13.0, P = 0.0014 | F(4,100) = 27.1, P = 0.0001 | F(4,100) = 11.4, P < 0.0001 | 10, 32, 100 mM |
| CaLa | 2a | 7 BB, 12 BN (F) | F(1,17) = 5.82, P = 0.0274 | F(4,68) = 5.12, P = 0.0011 | F(4,68) = 5.80, P = 0.0004 | 10, 32, 100 mM |
| MgCl2 | 3a | 9 BB, 17 BN (M) | F(1,17) = 2.00, P = 0.1715 | F(4,96) = 12.4, P < 0.0001 | F(4,96) = 0.34, P = 0.8497 | none |
| NaCl | 4a | 11 BB, 9 BN (F) | F(1,18) = 9.57, P = 0.0063 | F(5,90) = 55.9, P < 0.0001 | F(5,90) = 0.48, P = 0.7893 | none |
| NaLa | 5a | 8 BB, 11 BN (F) | F(1,17) = 8.55, P = 0.0095 | F(5,85) = 30.0, P < 0.0001 | F(5,85) = 0.56, P = 0.7298 | none |
| KCl | 5c, 6a | 15 BB, 20 BN (F) | F(1,28) = 12.1, P = 0.0017 | F(5,140) = 50.3, P < 0.0001 | F(5,140) = 3.32, P = 0.0072 | 32, 100, 178 mM |
| NH4Cl | 3d, 4f | 9 BB, 17 BN (M) 11 BB, 9 BN (F) | F(1,43) = 7.38, P = 0.0095 | F(5,215) = 25.7, P < 0.0001 | F(5,120) = 2.10, P = 0.0668 | none |
Compounds are listed in the order presented in Figs. 3–5. Cohort and order provides batch of mice (1–6) and compounds tested in alphabetical order (a–f), with “a” being tested first, “b” second, and so on. Group composition gives number of M and F mice of each strain tested (BB, BTBR/BTBR; BN, BTBR/NZW). Concentrations supporting strain differences = P < 0.05 according to post hoc Fisher LSD tests.
Post hoc tests were not strictly justified in this case given the nonsignificant interaction.
The concentrations at which the congenics and controls showed a response distinguishable from 50% preference differed considerably (Table 6). Relative to water, both the congenics and controls preferred at least one concentration of sucrose, maltose, Polycose, monosodium glutamate (MSG), IMP, Na3HP2O7, citric acid, NaCl, and NH4Cl. In addition, the BTBR/NZW congenics preferred at least one concentration of saccharin, NaLa, and KCl, and the BTBR/BTBR controls preferred at least one concentration of denatonium, CaCl2, and CaLa. Relative to the BTBR/NZW congenics, the BTBR/BTBR controls had lower thresholds for behavioral avoidance of Na3HP2O7, HCl, NaLa, and KCl; they had a higher threshold for CaCl2, and, unlike the BTBR/NZW controls, they did not avoid any concentration of denatonium, QHCl or CaLa (Table 6).
BRIEF-ACCESS TESTS.
The BTBR/NZW congenic mice and their BTBR/BTBR controls had lick responses to various taste compounds that closely recapitulated the pattern displayed by the NZW and BTBR inbred strains. The congenics and controls licked water at similar rates. The BTBR/NZW congenics avidly licked high concentrations of sucrose and Polycose and reluctantly licked high concentrations of the other 10 compounds tested. The BTBR/BTBR mice were indifferent to all concentrations of sucrose, Polycose, and QHCl, all but the highest concentration of CaCl2, and all but the highest two concentrations of denatonium and NaCl. Relative to the BTBR/NZW mice, they licked high concentrations of sucrose and Polycose significantly less, and high concentrations of QHCl, denatonium (except 56 mM), CaCl2, NaCl, and citric acid significantly more. The two lines did not differ in their response to any concentration of capsaicin (Fig. 6, Table 4).
Comparison of Itpr3 KO Mice With WT Littermates
Body weight.
There was no difference in body weight between Itpr3 KO and WT mice. For example, at the start of 96 h two-bottle choice tests there was no strain difference, F(1,14) = 0.48, P = 0.4981; males were heavier than females, F(1,14) = 39.1, P < 0.0001, and there was no interaction of sex with genotype [means ± SE (g); WT male = 25.0 ± 1.6, KO male = 22.8 ± 0.8, WT female = 17.4 ± 0.9, KO female = 18.1 ± 0.7; F(1,14) = 2.17, P = 0.1625].
Water intake.
Itpr3 KO mice drank significantly more water than did Itpr3 WT mice [Fig. 1; F(1,156) = 55.1, P < 0.0001]. Water intakes did not differ between the sexes and there was no interaction of sex with genotype [male WT = 3.9 ± 0.1 ml/day (n = 44), male KO = 4.8 ± 0.1 ml/day (n = 44), female WT = 3.7 ± 0.1 ml/day (n = 36), female KO = 4.7 ± 0.2 ml/day (n = 36); F(1,156) = 0.26, P = 0.6112].
TWO-BOTTLE CHOICE TESTS.
In 96 h two-bottle choice tests, relative to WT controls, the Itpr3 KO mice had significantly higher preference scores for 50 mM CaCl2, 50 mM CaLa, 50 mM MgCl2, 100 mM NH4Cl, and 0.1 mM QHCl; they had significantly lower preference scores for 2 mM saccharin. The WT mice preferred 100 mM NaCl and 2 mM saccharin to water and avoided the other seven solutions. In contrast, the Itpr3 KO mice preferred 50 mM CaCl2 and 50 mM CaLa to water and were indifferent to 50 mM MgCl2, 100 mM NaCl, 100 mM KCl, 100 mM NH4Cl, 2 mM saccharin, and 0.1 mM QHCl; the only solution they avoided was 5 mM citric acid (Fig. 2, Table 13).
Table 13.
Four-day two-bottle choice tests: statistical analyses underlying comparisons made in Fig. 2
| Type Tested Comparison | Inbred NZW vs. BTBR | BTBR × NZW F2 Alleles at rs3693494 | Chr 17 Congenics BTBR/NZW vs. BTBR/BTBR | Itpr3 KO WT vs. KO |
|---|---|---|---|---|
| Group composition | NZW = 4M + 4F | 309M, 301F | BTBR/NZW = 8F | WT = 2M + 5F |
| BTBR = 4M + 4F | BTBR/BTBR = 7F | KO = 4M + 7F | ||
| Statistical test | t-test | 1-way ANOVA | t-test | t-test |
| Degrees of freedom | t(14) | F(2,607)* | t(13) | t(16) |
| 50 mM CaCl2 | 4.33, P = 0.0005 | 121.2, P < 0.0001 | 3.33, P = 0.0054 | 3.35, P = 0.0048 |
| 50 mM CaLa | 2.64, P = 0.0193 | 89.7, P < 0.0001 | 5.99, P < 0.0001 | 5.91, P < 0.0001 |
| 50 mM MgCl2 | 0.86, P = 0.4017 | 5.82, P = 0.0031 | 0.23, P = 0.8220 | 2.98, P = 0.0088 |
| 100 mM NaCl | 0.33, P = 0.7426 | 7.52, P = 0.0006 | 3.00, P = 0.0102 | 1.52, P = 0.1472 |
| 100 mM KCl | 1.43, P = 0.1750 | 2.38, P = 0.0944 | 1.78, P = 0.0987 | 1.09, P = 0.2907 |
| 100 mM NH4Cl | 1.16, P = 0.2673 | 1.00, P = 0.3677 | 0.73, P = 0.4795 | 2.55, P = 0.0216 |
| 2 mM saccharin | 2.43, P = 0.0290 | 289.4, P < 0.0001 | 2.49, P = 0.0286 | 4.45, P = 0.0004 |
| 0.1 mM QHCl | 1.26, P = 0.2293 | not tested | 2.18, P = 0.0499 | 2.84, P = 0.0123 |
| 5 mM citric acid | 3.74, P = 0.0022 | 25.2, P < 0.0001 | 0.36, P = 0.7264 | 0.94, P = 0.3590 |
| 0.03 mM QHCl† | 2.11, P = 0.0537 | 2.69, P = 0.0685 | 0.24, P = 0.8144 | 0.04, P = 0.9647 |
Degrees of freedom slightly less for some tests. For the BTBR × NZW F2 cross, if a significant difference was present it always involved the BTBR/BTBR group.
Results not shown in figure.
In 48 h two-bottle choice tests, the Itpr3 KO mice had significantly higher preference scores than did the Itpr3 WT mice for several concentrations of denatonium, QHCl, CaCl2, CaLa, MgCl2, and NH4Cl (Figs. 3–5). They had significantly lower preference scores for various concentrations of saccharin, sucrose, maltose, Polycose, MSG, IMP, Na3HP2O7, ZnCl2, and KCl. The two groups did not differ in response to any concentration of HCl, citric acid, caffeine, capsaicin, NaCl, or NaLa.
DISCUSSION
We discovered that the BTBR mouse strain has absent or abnormal behavioral responses to several taste solutions. We used interval mapping of segregating BTBR × NZW F2 hybrid mice to link these dysfunctions to Chr 17 and developed a congenic line that isolated the linkage to a 0.8 Mb region of this chromosome. One of the 21 genes in the introgressed interval was Itpr3, the inositol triphosphate receptor type 3 gene, which has previously been implicated in taste perception (Refs. 7, 26, 35, 37; see below). To assess its role here, we produced Itpr3 KO mice and these had a phenotype similar to, although not identical with, BTBR inbred and BTBR/BTBR mice. We identified a 12 bp deletion in exon 23 of Itpr3 that appears to be unique to the BTBR strain. We have demonstrated elsewhere that the BTBR, BTBR/BTBR and Itpr3 KO mice do not express the ITPR3 protein (18). Consequently, we conclude that this “natural knockout” of Itpr3 accounts for the BTBR mouse's aberrant taste responses.
Itpr3 is expressed in type 2 taste cells, which harbor taste G protein-coupled receptors (GPCRs). According to current understanding, taste molecule-induced changes in conformation of GPCRs activate phospholipase C β-2 (PLCβ2), which increases cytosolic concentrations of inositol triphosphate (IP3). This triggers ITPR3 to release calcium from endoplasmic reticulum stores into the cytoplasm. The high calcium levels open membrane TRPM5 channels, allowing sodium to enter the taste cell. The resulting changes in ionic balance alter membrane electrical permeability in a manner that opens CALHM1 channels, which provide a conduit for ATP to leave the cell (61). ATP acts on P2X2 and P2X3 receptors of nearby type 3 taste cells. Type 3 cells harbor receptors for sour and salty tastes and also are in synaptic contact with the afferent nerve conveying taste information to the brain. There is complex feedback and interplay between type 2 and 3 taste cells. Thus, ITPR3 is a required component of the GPCR taste transduction pathway, and it may also contribute to other taste transduction pathways indirectly, by modulating ATP release and thus activity in type 3 cells or common afferent nerves.
Results obtained from the BTBR × NZW F2 cross identified a quantitative trait locus on Chr 17 with some truly remarkable LOD scores, the highest we have seen for a behavioral experiment. The strongest linkages involved the preferences for saccharin (LOD = 100.8) and calcium (LOD = 44.6), which are transduced by T1R3 (a GPCR; Refs. 4, 28, 43, 63, 71, 78, 79), and so this is consistent with the hypothesis that Itpr3 is involved in GPCR-mediated taste perception. However, there were two findings that do not fit the hypothesis cleanly. First, there was significant linkage, albeit less dramatic, to KCl, NH4Cl, NaCl, and citric acid responses. These taste compounds are not considered to be transduced by GPCRs, and they produced small-or-no differential responses in experiments with congenic and Itpr3 KO mice. Perhaps these are examples of an indirect action of ITPR3 on non-GPCR transduction. Alternatively, we suspect that some of these linkages are due to differences in general fluid intake between the parental strains. Supporting this, there was strong linkage of this region to water intake (LOD = 15.9) and linkage involving KCl, NH4Cl, and NaCl intakes but not preferences.
The second inconsistent finding was that in the BTBR × NZW F2 cross there was no linkage to QHCl preference or intake. This is contrary to the GPCR-mediated transduction hypothesis because quinine is undoubtedly detected by one or more GPCRs. The explanation appears to be simply that the NZW (control) mice are unusually insensitive to QHCl so they showed little avoidance of the 0.03 mM QHCl concentration we tested; it was not possible to observe a failure to detect quinine in mice with the BTBR/BTBR allele when preferences of the controls were close to 50%. The influence of the Chr 17 introgressed region on QHCl taste perception was clearly demonstrated in tests of the BTBR/BTBR and Itpr3 KO mice given higher QHCl concentrations (see below).
The focus here is on Chr 17, but the BTBR × NZW F2 cross revealed several linkages to other chromosomes. A cluster of QTLs located on mid-Chr 8 involved CaCl2, CaLa, and MgCl2, raising the possibility that this is a locus for calcium-magnesium taste (see below). Other loci were specific to particular taste compounds (see Table 12). All appear to be novel.
Below, we describe the implications of our results for each of the taste compounds we tested. To do this, we draw on several sets of comparisons. First, we compared the NZW and BTBR inbred strains, which differ at thousands of genetic loci, and so, perhaps not surprisingly, their preferences for several taste compounds differed. This was a principal reason for choosing them as founding strains for genetic mapping. Second, we compared the 610 mice of the BTBR × NZW F2 cross according to their alleles at a marker (rs3693494) near the linkage peak on Chr 17. Each of these F2 mice is a unique combination of the genetic material of the parental strains so phenotypic differences emerge only when the statistical power derived from the large sample size outweighs the noisy genetic background. Third, the Chr 17 congenic (BTBR/NZW) and control (BTBR/BTBR) mice were genetically identical except for alleles in the congenic interval. Thus, any differences in phenotype between the congenics and their controls could be attributed to the influence of the introgressed genes in this region. The BTBR/BTBR congenic control mice were the 12th generation of NZW.BTBR hybrids backcrossed to the BTBR strain, so according to random mating allele frequencies they should share 99.98% of genetic material in common with the parental BTBR strain. Thus it is reassuring that, despite being tested in different experiments and sometimes with different previous taste experiences, the behavioral responses of BTBR inbred and BTBR/BTBR congenic control mice were generally similar.
The congenic mice had an introgressed interval on Chr 17 that contained only 21 genes, and this led us to focus on Itpr3, but it is at least logically possible that other introgressed genes may underlie some of the taste abnormalities observed here. To pin down the contribution of Itpr3, the fourth comparison we used was between Itpr3 KO and WT mice. Technical considerations dictated that the KO was produced on a C57BL/6 background so comparison of BTBR/BTBR with Itpr3 KO mice confounds the potential contribution of the 20 non-Itpr3 genes in the congenic interval with genetic background. Fortunately, in most cases, the taste phenotypes of the BTBR/BTBR and Itpr3 KO mice were congruous, avoiding this interpretive problem.
Alterations in the Response to Specific Taste Qualities and Compounds
Sweet (saccharin, sucrose, and maltose) and “carbohydrate” (Polycose).
Of all the behavioral results, those involving sweet taste solutions were the clearest. The NZW, BTBR/NZW, and Itpr3 WT mice all had strong preferences for saccharin, sucrose, and maltose. In marked contrast, the BTBR, BTBR/BTBR, and Itpr3 KO mice (those with the homozygous BTBR or null form of Itpr3) all showed minimal interest in the sweeteners. They found all concentrations of saccharin and low concentrations of sucrose and maltose to be no more preferable than water. In the mouse, the primary determinant of sweet taste detection is the T1R3 receptor (4), and polymorphisms in Tas1r3, the gene encoding T1R3, can have marked effects on preference (43). The BTBR strain has “taster” (i.e., C57BL/6-like) alleles of Tas1r3 so it would be expected to avidly ingest saccharin and other sweeteners but it did not. Our results showing that the BTBR/NZW mice have strong preferences for sweeteners argues compellingly that the BTBR strain has a functional T1R3, but its dysfunctional ITPR3 prevents the transduced signal from being propagated.
One wrinkle was that the BTBR, BTBR/BTBR, and Itpr3 KO mice all preferred high concentrations of sucrose and maltose to water in two-bottle choice tests. Hisatsune et al. (26) elicited responses, albeit attenuated relative to controls, in the glossopharyngeal nerve of Itpr3 KO mice when the mice's tongues were exposed to high concentrations of several sweeteners. Thus, there may be a residual sweet taste that does not involve Itpr3. On the other hand, mice learn that licking results in reinforcing postingestive actions of concentrated sugars. Indeed, mice lacking T1R3 also show preferences for high concentrations of sugar in two-bottle choice tests (72, 79, 80). This “learning” interpretation is supported by our finding that the BTBR, BTBR/BTBR, and Itpr3 KO mice showed no preference for high concentrations of saccharin, and mice with the BTBR form of Itpr3 did not respond to any concentration of sucrose in brief-access tests, which minimize and control for postingestive factors.
Transduction of the taste of Polycose and, perhaps related, maltose (Ref. 52 but see Ref. 72) involves elements of the GPCR transduction cascade (53, 61), but for Polycose the receptor is not T1R3 (79). We found here that BTBR, BTBR/BTBR, and Itpr3 KO mice were indifferent to low concentrations and had reduced preferences for moderate concentrations of Polycose and maltose. The BTBR and BTBR/BTBR mice did not lick for Polycose any more rapidly than they did for water in brief-access tests. This consequently buttresses the conclusions that Polycose detection involves the GPCR-based transduction cascade and that a dysfunctional form of Itpr3 causes a GPCR-taste transduction failure in BTBR mice.
Umami (MSG and IMP).
NZW, BTBR/NZW, and Itpr3 WT controls displayed an inverted-U concentration-preference function in response to both umami compounds, with a peak at ∼32 mM. In contrast, the BTBR, BTBR/BTBR, and Itpr3 KO groups displayed little or no peak preference, responding indifferently to moderate concentrations of MSG and IMP. All groups avoided high concentrations similarly. This is consistent with a GPCR-mediated hedonically positive component of umami taste that predominates at moderate concentrations [perhaps T1R1+T1R3 or mGluR (13, 16, 46, 77)] and a non-GPCR mediated hedonically negative component that predominates at high concentrations (perhaps non-ENaC salt or trigeminal sensors).
Hisatsune et al. (26) found that Itpr3 KO completely eliminated MSG preferences and reduced chorda tympani responses to MSG relative to Itpr3 WT controls. The larger effect size they obtained can probably be explained by strain and methodological differences, particularly test order. Responses to MSG are highly susceptible to prior experience (1, 3).
Bitter (denatonium, quinine, and caffeine).
Similar to most mouse strains, the NZW, BTBR/NZW, and Itpr3 WT mice avoided high concentrations of denatonium, QHCl, and caffeine. In contrast, the BTBR, BTBR/BTBR, and Itpr3 KO mice were indifferent to these compounds or, at some concentrations, slightly preferred denatonium and QHCl to water. Similar results were obtained in brief-access tests; the BTBR and BTBR/BTBR groups avoided only extremely high concentrations of denatonium (10 or 56 mM) and no concentration of QHCl. Hisatsune et al. (26) found similar results using two-bottle choice tests of Itpr3 KO mice given cycloheximide, quinine sulfate, and denatonium. Thus, the detection of bitterness is compromised in mice carrying the homozygous BTBR or null form of Itpr3.
There are three qualifications to this conclusion. First, mice carrying two BTBR alleles of Itpr3 avoided high concentrations of bitter compounds, suggesting there may be residual taste sensitivity or contamination by postingestive actions. Second, there were no differences between any groups in 4-day preferences for 0.03 mM QHCl. This was most likely because this concentration of QHCl did not suppress intakes of controls very much, making it difficult to observe an absence of suppression in the dysfunctional mice. Third, there was no difference between BTBR/BTBR and BTBR/NZW mice or Itpr3 WT and KO mice in response to caffeine. This is consistent with findings that Itpr3 KO does not influence the chorda tympani or glossopharyngeal nerve responses to caffeine [despite attenuating responses to cycloheximide, denatonium, and quinine sulfate (26)]. Similarly, the responses of gustatory afferent nerves to oral caffeine are unaltered by KO of Trpm5 (15, 78), which is a component of the GPCR taste transduction cascade. Caffeine can be transduced by a novel cGMP-mediated mechanism (48) and thus may “bypass” GPCRs. If so, our results suggest that this involves activation of events downstream of ITPR3. Arguing against this, caffeine increases inositol phosphate concentrations in taste cells so a signal for ITPR3 activation is presumably present (Ref. 58, although see Discussion Ref. 75). Moreover, gustducin KO mice did not avoid caffeine in brief-access tests (23), but there is a strong possibility that this observation was confounded by the animals' prior experience with other bitter compounds. To add even more complexity, we found that NZW mice avoided caffeine more strongly than did BTBR mice in both two-bottle choice and brief-access tests. This is one of only two examples where the BTBR/BTBR mice did not recapitulate the phenotype of the BTBR inbred strain, suggesting polygenic control of caffeine taste perception. Clearly, this is an area for additional research.
Calcium/magnesium (CaCl2, CaLa, and MgCl2) and ZnCl2.
Like most mice (68), the NZW, BTBR/NZW, and Itpr3 WT mice avoided moderate and high concentrations of calcium. However, the BTBR, BTBR/BTBR, and Itpr3 KO mice preferred all except the highest concentrations. This exposes a rare dichotomy in the hedonic valence of a taste. It implies that mice possessing a defective Itpr3 gene have more than just a compromised ability to detect calcium. We previously found similar results with Tas1r3 KO mice, and, together with in vitro, genetic, and pharmacological evidence, this implicated T1R3 as a calcium taste receptor (63, 71). The simplest interpretation is that calcium is transduced by at least two mechanisms: One involves T1R3 and ITPR3, which imparts a negative hedonic valence; the other is not mediated by ITPR3 and provides a positive hedonic valence. When T1R3 or a component of its transduction cascade, including ITPR3, is eliminated by gene KO then only the hedonically positive signal persists.
The positive valence might be imparted by the locus we discovered on mid-Chr 8, which showed linkage to calcium and magnesium consumption. The identity of this locus remains to be determined, but an attractive possibility is CaCNa1a, which is a subunit of a voltage-dependent calcium channel that is located at 80.4 Mb on Chr 8 and is highly expressed in primate circumvallate and fungiform taste tissue (36). But despite the plausible candidate gene, our results argue against a significant contribution of this locus: Calcium was preferred more than water by BTBR inbred and BTBR/BTBR mice and by mice in the F2 cross carrying NZW/NZW alleles, but not BTBR/BTBR or BTBR/NZW alleles on Chr 8. By definition, the BTBR inbred and BTBR/BTBR strains carry BTBR/BTBR alleles on Chr 8, so their calcium preference cannot be explained by the action of the NZW allele(s) at this locus. Previously, we used genetic linkage results to implicate the calcium-sensing receptor, Casr, in calcium taste (62, 70, 71), and, indeed, this receptor has recently been found on the tongue (e.g., Refs. 11, 51). However, there was no evidence that this gene influenced calcium preferences here; Casr is located on Chr 16 so it cannot be responsible for the locus influencing calcium consumption on Chr 8. We now believe that there are at least three genes influencing calcium preference: Tas1r3, Casr, and the locus on Chr 8.
We addressed the specificity of the response to calcium by testing two calcium salts, chloride and lactate, and these elicited very similar behavioral results, which focuses attention on the cation rather than the anion as the effective taste stimulus. We also tested a closely related salt, MgCl2. In two-bottle choice tests with MgCl2, there was no difference in preference scores between BTBR and NZW mice or between BTBR/BTBR and BTBR/NZW mice, but Itpr3 KO mice avoided MgCl2 significantly less than did Itpr3 WT mice. This latter finding was similar to results obtained with Tas1r3 WT and KO mice (71). Perhaps the C57BL/6 background of the WT and KO strains is more conducive than is the BTBR background for exposing the mechanisms underlying magnesium taste. However, some contribution of ITPR3 to magnesium taste in BTBR mice could be gleaned from the results obtained from F2 hybrids with BTBR alleles near Itpr3 (Fig. 2) and by brief-access tests with MgCl2, where BTBR/BTBR mice reduced licking to MgCl2 less than did BTBR/NZW mice.
We tested ZnCl2 to provide information on a divalent chloride unrelated to calcium or magnesium. In contrast to the marked strain differences in calcium preference scores, there was no difference in ZnCl2 preference scores between BTBR and NZW mice or between BTBR/BTBR and BTBR/NZW mice. This was one result where the Itpr3 WT and KO mice comparison did not parallel the other comparisons: There were highly significant differences between Itpr3 WT and KO ZnCl2 preference scores. This appeared to be because the Itpr3 WT mice strongly preferred 3.2–32 mM ZnCl2 to water, whereas no concentration of ZnCl2 was preferred by Itpr3 KO mice or any of the other four strains. These results are remarkably similar to the ZnSO4 and FeSO4 preferences observed with Tas1r3 WT and KO mice and with Trpm5 WT and KO mice (45). It appears that the pleasant component of zinc and iron taste experienced by B6/WT mice involves a T1R3-TRPM5 molecular pathway (45), with ITPR3 as an intermediary. It remains to be determined why mice on the B6/WT background prefer some concentrations of ZnCl2 but those on the NZW background do not.
Salty (NaCl, NaLa, KCl, and NH4Cl).
NZW and BTBR/NZW mice showed the classic inverted U-shaped sodium concentration-preference function in two-bottle choice tests (6, 19, 20, 44) whereas BTBR and BTBR/BTBR mice had an attenuated peak. Consistent with this, Hisatsune et al. (26) reported that preference scores for 150 mM NaCl tended to be lower in Itpr3 KO than WT mice. We did not see this in our Itpr3 KO mice, but it would not be possible to observe an attenuation of peak preference because the Itpr3 WT mice did not prefer NaCl over water. We also did not replicate the observation of Hisatsune et al. (26) that Itpr3 KO mice avoided high concentrations of NaCl significantly less than did controls. However, we found that in brief-access tests, BTBR mice licked more 500 and 1,000 mM NaCl than did NZW mice and BTBR/BTBR mice licked more 1,000 mM NaCl than did BTBR/NZW mice. Taken together, the results involving NaCl and NaLa can best be described as persuasive but not compelling evidence of involvement of Itpr3 in sodium taste.
Tests with KCl and NH4Cl also produced several ambiguous results. The BTBR/NZW and Itpr3 WT mice showed significant preferences for moderate concentrations of KCl that were absent in BTBR/BTBR and Itpr3 KO mice. KCl preference scores of the NZW and BTBR inbred strains did not differ, but this may be because, unlike the other two control groups, the NZW strain did not prefer KCl more than water. In brief-access tests, the BTBR and BTBR/BTBR groups licked considerably more KCl than did NZW or BTBR/NZW controls. NH4Cl preference scores did not differ between the NZW and BTBR groups or BTBR/NZW and BTBR/BTBR groups but the Itpr3 KO mice had higher NH4Cl preferences than did the Itpr3 WT mice.
The inconsistent pattern of responses we observed with NaCl and other monovalent salts is similar to those observed in mice with other KOs of the GPCR pathway. For example, there were nonsignificant trends for reduced electrophysiological and behavioral responses to 1,000 mM NaCl relative to controls in gustducin, TRPM5 and PLCβ2 KO mice (23, 78); in brief-access tests, the avoidance of 1,000 mM NaCl was substantially blunted in Calhm1 and in P2X2/P2X3 KO mice (17, 61). On the basis of these results, we postulate, albeit tentatively, that in Itpr3-compromised mice, ENaC-mediated (amiloride-sensitive) (12) sodium detection is intact, but a component of amiloride-insensitive sodium detection (including detection of other monovalent cations) is impaired because of dysfunction in the GPCR transduction cascade. This implies either that monovalent salts are detected by a GPCR or that the TRPV1t channel, which has been postulated to be a nonspecific salt transducer (Ref. 32 but see Ref. 49), activates the GPCR transduction cascade. We note that a more consistent pattern of results was produced with brief-access tests than two-bottle choice tests, which argues that the postingestive effects of ingested monovalent anions may obscure taste-based responses. An obvious concern is that rodents drink water to “dilute” the hypertonic salts they ingest (60), and this confounds the interpretation of preference scores as measures of taste perception. Indeed, we found in the BTBR × NZW F2 mice that possessing BTBR/BTBR alleles near Itpr3 increased NaCl intake but decreased NaCl preference due to the BTBR/BTBR alleles increasing water intakes.
Sour (HCl and citric acid).
The results involving responses to HCl and citric acid are difficult to interpret. Most pertinently here, the Itpr3 WT and KO mice did not differ in acid preference scores in either the 96 h test or the 48 h tests. These findings replicate and extend those of Hisatsune et al. (26) and argue that Itpr3 is not involved with sour taste, a conclusion consistent with the generally accepted transduction pathway of acids (reviews Refs. 9, 41). However, preference scores for both acids were lower in the BTBR and BTBR/BTBR groups than NZW and BTBR/NZW groups and lower in BTBR × NZW F2 hybrids with BTBR/BTBR alleles near Itpr3 than in hybrids with one or both NZW alleles at this locus. Taking these results together with the results from the KO mice, we conclude that either 1) another gene introgressed in the Chr 17 congenic interval is responsible for these differences or 2) genetic background masks an effect of Itpr3 in the KO mice.
To add further complexity, in brief-access tests, BTBR mice licked both acids more than did NZW mice, but there was no difference in acid licking between BTBR/BTBR and BTBR/NZW mice. Thus, relative to the NZW group, the BTBR group showed stronger aversion to acids in the preference tests but weaker aversion in the brief-access tests. Perhaps there are Itpr3-mediated oral signals (observed in brief-access tests) that are overwhelmed by postingestive signals (which can dominate in long-term tests). We are impressed by the demonstration that the behavioral response to acids can be supported by pharyngeal (postoral) chemoreceptors or free nerve endings (38). A difference in trigeminal responsiveness seems unlikely to account for the results found here, considering there were no differences between mice with the BTBR and NZW forms of Itpr3 in response to capsaicin. One more piece of the puzzle is that HCl elicited stronger activity in the chorda tympani nerve of Itpr3 KO than WT mice (26). Perhaps the contribution of pharyngeal chemoreceptors becomes more pronounced in mice lacking GPCR-mediated taste. More research is needed to clarify these observations. In particular, it remains to be seen whether the group differences we observed reflect an additional, Itpr3-mediated transduction process or are an artifact of testing procedures.
Pyrophosphate.
Pyrophosphate taste has garnered little research attention despite commercial interest in its palatability enhancement of domestic cat food (54). Previously, we used gustatory electrophysiology to demonstrate that pyrophosphate taste is distinct from sweet, sour, salty, bitter, umami, or calcium tastes in the rat (34). Here, we replicated the observation that some mice prefer moderate concentrations of trisodium pyrophosphate more than water (34) and discovered that this preference was almost completely eliminated in BTBR, BTBR/BTBR, and Itpr3 KO mice. The implication is that pyrophosphate preference requires a functional ITPR3 protein, and this, in turn, implies that pyrophosphate influences GPCR-mediated transduction. The ligand for pyrophosphate is unknown. In the catfish taste organ, pyrophosphate influences enzymes that regulate IP3 concentrations (27), but whether something similar occurs in rodents is unknown.
Water.
Finally, our results converge to suggest that a dysfunctional Itpr3 gene increases water intake: Daily water intakes were 16–32% higher in BTBR, BTBR/BTBR, and Itpr3 KO mice than in corresponding control groups, and, in the BTBR × NZW F2 cross, mice with BTBR/BTBR alleles near Itpr3 drank 25–35% more water than did those with BTBR/NZW or NZW/NZW alleles. Mice with a dysfunctional or absent Itpr3 generally drank more total fluid (water + taste solution) in choice tests than did controls (data not shown). To our knowledge, there is no previous work implicating Itpr3 in water balance, although the Itpr3 gene is expressed in kidney (8). It is conceivable that Itpr3 is involved in transducing the taste of water (review Ref. 47) and that mice lacking Itpr3 drink more water than do controls because they find it more attractive. This is speculation with an important practical implication because a change in the attractiveness of water would bias the outcome of two-bottle choice tests toward lower taste solution preference scores. Fortunately, there are few examples in the present results where this possibility could influence interpretation.
Perspective
We began studies of the BTBR mouse strain because of its high calcium preference scores relative to most other strains (68). However, the results of two-bottle choice tests and brief-access tests revealed that the BTBR strain has a more general taste deficit. In common with BTBR/BTBR mice and Itpr3 KO mice, it has markedly abnormal preference scores for, and brief-access acceptance of, taste compounds that are believed to be transduced by GPCRs in type 2 taste receptor cells. This includes exemplars of the classic taste qualities of sweet (saccharin, sucrose, and maltose), umami (MSG and IMP), and bitter (denatonium and quinine but not caffeine). Comparably large abnormalities in preferences were also present for the less well-accepted taste qualities of carbohydrate (Polycose), calcium (CaCl2 and CaLa), and pyrophosphate (Na3HP2O7), which suggests that these too involve the GPCR transduction cascade in type 2 taste receptor cells. Smaller abnormalities were present in the taste responses of the BTBR, BTBR/BTBR, and Itpr3 KO mice in response to sour (HCl and citric acid) and salty (NaCl and NaLa) taste compounds and to two monovalent chlorides (KCl and NH4Cl) but not to ZnCl2 or the irritant capsaicin. Some of these differences were ephemeral, but they cannot easily be dismissed as artifacts. Either current theory is wrong and transduction of these “non-GPCR” taste compounds actually involves the Itpr3-mediated cascade (in addition to better-established transduction elements) or Itpr3 indirectly modulates non-GPCR transduction pathways, for example, by tonic modulation of transcellular ATP.
While producing the congenic strain described here, we observed that the BTBR/BTBR mice but not the BTBR/NZW mice had a tufted hair pattern. We then used complementation mapping to demonstrate that Itpr3 is responsible for this phenotype (18). This, therefore, is a conspicuous example of pleiotropism: The same Itpr3 gene mutation is responsible for the BTBR strain's bad hair and its poor taste. The tf (tufted) locus apparently arose spontaneously and was introduced into the BTBR strain during its early history, in or soon after 1956 (33). It is remarkable that the profound taste loss of the BTBR strain has not been noticed previously.
GRANTS
Supported by NIH Grant RO1 DK-46791. The Itpr3 KO mouse was produced by the University of Pennsylvania Transgenic & Chimeric Mouse Facility, which is supported by the Institute for Diabetes, Obesity, and Cardiovascular Metabolism (DK-019525), the Center for Molecular Studies in Digestive and Liver Diseases (DK-50306), and the Abramson Cancer Center (CA-016520).
DISCLOSURES
No conflicts of interest, financial or otherwise, are declared by the author(s).
AUTHOR CONTRIBUTIONS
Author contributions: M.G.T. conception and design of research; M.G.T. and H.T.E. performed experiments; M.G.T. analyzed data; M.G.T. and H.T.E. interpreted results of experiments; M.G.T. prepared figures; M.G.T. drafted manuscript; M.G.T. edited and revised manuscript; M.G.T. and H.T.E. approved final version of manuscript.
ACKNOWLEDGMENTS
Superlative technical support was provided by Laura Alarcon and Tiffany Aleman. Thanks to the CIDR (Johns Hopkins University) for genotyping the BTBR × NZW F2 hybrid mice. Additional genotyping was conducted with support from the Monell Genotyping Core (NIDCD Core Grant P30DC-011735).
Footnotes
In October 2012, the strain was renamed BTBR T+ Itpr3tf/J as a consequence of this and related work (18).
REFERENCES
- 1.Ackroff K, Weintraub R, Sclafani A. MSG intake and preference in mice are influenced by prior testing experience. Physiol Behav 107: 207–217, 2012 [DOI] [PubMed] [Google Scholar]
- 2.Bachmanov AA, Beauchamp GK, Tordoff MG. Voluntary consumption of NaCl, KCl, CaCl2 and NH4Cl solutions by 28 mouse strains. Behav Genet 32: 445–457, 2002 [DOI] [PMC free article] [PubMed] [Google Scholar]
- 3.Bachmanov AA, Inoue M, Ji H, Murata Y, Tordoff MG, Beauchamp GK. Glutamate taste and appetite in laboratory mice: physiologic and genetic analyses. Am J Clin Nutr 90: 756S–763S, 2009 [DOI] [PMC free article] [PubMed] [Google Scholar]
- 4.Bachmanov AA, Li X, Reed DR, Ohmen JD, Li S, Chen Z, Tordoff MG, de Jong PJ, Wu C, West DB, Chatterjee A, Ross DA, Beauchamp GK. Positional cloning of the mouse saccharin preference (Sac) locus. Chem Senses 26: 925–933, 2001 [DOI] [PMC free article] [PubMed] [Google Scholar]
- 5.Bachmanov AA, Reed DR, Beauchamp GK, Tordoff MG. Food intake, water intake, and drinking spout side preference of 28 mouse strains. Behav Genet 32: 435–443, 2002 [DOI] [PMC free article] [PubMed] [Google Scholar]
- 6.Bare JK. The specific hunger for sodium chloride in normal and adrenalectomized white rats. J Comp Physiol Psychol 42: 242–253, 1949 [DOI] [PubMed] [Google Scholar]
- 7.Bernhardt SJ, Naim M, Zehavi U, Lindemann B. Changes in IP3 and cytosolic Ca2+ in response to sugars and non-sugar sweeteners in transduction of sweet taste in the rat. J Physiol 490: 325–336, 1996 [DOI] [PMC free article] [PubMed] [Google Scholar]
- 8.Blondel O, Takeda J, Janssen H, Seino S, Bell GI. Sequence and functional characterization of a third inositol trisphosphate receptor subtype, IP3R-3, expressed in pancreatic islets, kidney, gastrointestinal tract, and other tissues. J Biol Chem 268: 11356–11363, 1993 [PubMed] [Google Scholar]
- 9.Boughter JD, Jr, Bachmanov AA. Behavioral genetics and taste. BMC Neurosci 8, Suppl 3: S3, 2007 [DOI] [PMC free article] [PubMed] [Google Scholar]
- 10.Broman KW, Wu H, Sen S, Churchill G. R/qtl: QTL mapping in experimental crosses. Bioinformatics 19: 889–890, 2003 [DOI] [PubMed] [Google Scholar]
- 11.Bystrova MF, Romanov RA, Rogachevskaja OA, Churbanov GD, Kolesnikov SS. Functional expression of the extracellular-Ca2+-sensing receptor in mouse taste cells. J Cell Sci 123: 972–982, 2010 [DOI] [PubMed] [Google Scholar]
- 12.Chandrashekar J, Kuhn C, Oka Y, Yarmolinsky DA, Hummler E, Ryba NJP, Zuker CS. The cells and peripheral representation of sodium taste in mice. Nature 464: 297–301, 2010 [DOI] [PMC free article] [PubMed] [Google Scholar]
- 13.Chaudhari N, Pereira E, Roper SD. Taste receptors for umami: the case for multiple receptors. Am J Clin Nutr 90: 738S–742S, 2009 [DOI] [PMC free article] [PubMed] [Google Scholar]
- 14.Clee SM, Nadler ST, Attie AD. Genetic and genomic studies of the BTBR ob/ob mouse model of type 2 diabetes. Am J Ther 12: 491–498, 2005 [DOI] [PubMed] [Google Scholar]
- 15.Damak S, Rong M, Yasumatsu K, Kokrashvili Z, Perez CA, Shigemura N, Yoshida R, Mosinger B, Jr, Glendinning JI, Ninomiya Y, Margolskee RF. Trpm5 null mice respond to bitter, sweet, and umami compounds. Chem Senses 31: 253–264, 2006 [DOI] [PubMed] [Google Scholar]
- 16.Delay ER, Eddy MC, Eschle BK. Behavioral studies of umami: tales told by mice and rats. Ann NY Acad Sci 1170: 41–45, 2009 [DOI] [PubMed] [Google Scholar]
- 17.Eddy MC, Eschle BK, Barrows J, Hallock RM, Finger TE, Delay ER. Double P2X2/P2X3 purinergic receptor knockout mice do not taste NaCl or the artificial sweetener SC45647. Chem Senses 34: 789–797, 2009 [DOI] [PMC free article] [PubMed] [Google Scholar]
- 18.Ellis HT, Tordoff MG, Parker MR. Itpr3 Is responsible for the mouse tufted (tf) locus. J Hered 104: 295–297, 2013 [DOI] [PMC free article] [PubMed] [Google Scholar]
- 19.Epstein AN, Stellar E. The control of salt preference in the adrenalectomized rat. J Comp Physiol Psychol 48: 167–172, 1955 [DOI] [PubMed] [Google Scholar]
- 20.Falk JL, Young PT. The relative acceptability of sodium chloride solutions as a function of concentration and water need. J Comp Physiol Psychol 49: 569–575, 1956 [DOI] [PubMed] [Google Scholar]
- 21.Farber CR, Corva PM, Medrano JF. Genome-wide isolation of growth and obesity QTL using mouse speed congenic strains. BMC Genomics 7: 102, 2006 [DOI] [PMC free article] [PubMed] [Google Scholar]
- 22.Flowers JB, Oler AT, Nadler ST, Choi Y, Schueler KL, Yandell BS, Kendziorski CM, Attie AD. Abdominal obesity in BTBR male mice is associated with peripheral but not hepatic insulin resistance. Am J Physiol Endocrinol Metab 292: E936–E945, 2007 [DOI] [PubMed] [Google Scholar]
- 23.Glendinning JI, Bloom LD, Onishi M, Zheng KH, Damak S, Margolskee RF, Spector AC. Contribution of alpha-gustducin to taste-guided licking responses of mice. Chem Senses 30: 299–316, 2005 [DOI] [PubMed] [Google Scholar]
- 24.Glendinning JI, Gresack J, Spector AC. A high-throughput screening procedure for identifying mice with aberrant taste and oromotor function. Chem Senses 27: 461–474, 2002 [DOI] [PubMed] [Google Scholar]
- 25.Grigson PS, Spector AC, Norgren R. Microstructural analysis of successive negative contrast in free-feeding and deprived rats. Physiol Behav 54: 909–916, 1993 [DOI] [PubMed] [Google Scholar]
- 26.Hisatsune C, Yasumatsu K, Takahashi-Iwanaga H, Ogawa N, Kuroda Y, Yoshida R, Ninomiya Y, Mikoshiba K. Abnormal taste perception in mice lacking the type 3 inositol 1,4,5-trisphosphate receptor. J Biol Chem 282: 37225–37231, 2007 [DOI] [PubMed] [Google Scholar]
- 27.Huque T, Brand JG, Rabinowitz JL. Metabolism of inositol-1,4,5-trisphosphate in the taste organ of the channel catfish, Ictalurus punctatus. Comp Biochem Physiol B 102: 833–839, 1992 [DOI] [PubMed] [Google Scholar]
- 28.Inoue M, Reed DR, Li X, Tordoff MG, Beauchamp GK, Bachmanov AA. Allelic variation of the Tas1r3 taste receptor gene selectively affects behavioral and neural taste responses to sweeteners in the F2 hybrids between C57BL/6ByJ and 129P3/J mice. J Neurosci 24: 2296–2303, 2004 [DOI] [PMC free article] [PubMed] [Google Scholar]
- 29.International Committee on Standardized Genetic Nomenclature for Mice Rules and Guidelines for Nomenclature of Mouse and Rat Strains. Bar Harbor, ME: Mouse Genome Informatics, The Jackson Laboratory, www.informatics.jax.org/mgihome/nomen/strains.shtml#ioi, 2007 [Google Scholar]
- 30.Kim S, Ahn T, Park C. The Pro335 –> Leu polymorphism of type 3 inositol 1,4,5-trisphosphate receptor found in mouse inbred lines results in functional change. J Biol Chem 280: 26024–26031, 2005 [DOI] [PubMed] [Google Scholar]
- 31.Kusek GK, Wahlsten D, Herron BJ, Bolivar VJ, Flaherty L. Localization of two new X-linked quantitative trait loci controlling corpus callosum size in the mouse. Genes Brain Behav 6: 359–363, 2007 [DOI] [PubMed] [Google Scholar]
- 32.Lyall V, Heck GL, Vinnikova AK, Ghosh S, Phan TH, Alam RI, Russell OF, Malik SA, Bigbee JW, DeSimone JA. The mammalian amiloride-insensitive non-specific salt taste receptor is a vanilloid receptor-1 variant. J Physiol 558: 147–159, 2004 [DOI] [PMC free article] [PubMed] [Google Scholar]
- 33.Lyon MF. Hereditary hair loss in the tufted mutant of the house mouse. J Hered 47: 101–103, 1956 [Google Scholar]
- 34.McCaughey SA, Giza BK, Tordoff MG. Taste and acceptance of pyrophosphates by rats and mice. Am J Physiol Regul Integr Comp Physiol 292: R2159–R2167, 2007 [DOI] [PubMed] [Google Scholar]
- 35.Miura H, Nakayama A, Shindo Y, Kusakabe Y, Tomonari H, Harada S. Expression of gustducin overlaps with that of type III IP3 receptor in taste buds of the rat soft palate. Chem Senses 32: 689–696, 2007 [DOI] [PubMed] [Google Scholar]
- 36.Moyer BD, Hevezi P, Gao N, Lu M, Kalabat D, Soto H, Echeverri F, Laita B, Yeh SA, Zoller M, Zlotnik A. Expression of genes encoding multi-transmembrane proteins in specific primate taste cell populations. PLoS One 4: e7682, 2009 [DOI] [PMC free article] [PubMed] [Google Scholar]
- 37.Nakashima K, Ninomiya Y. Increase in inositol 1,4,5-triphosphate levels of the fungiform papilla in response to saccharin and bitter substances in mice. Cell Physiol Biochem 8: 224–230, 1998 [DOI] [PubMed] [Google Scholar]
- 38.Ohkuri T, Horio N, Stratford JM, Finger TE, Ninomiya Y. Residual chemoresponsiveness to acids in the superior laryngeal nerve in “taste-blind” (P2X2/P2X3 double-KO) mice. Chem Senses 20: 523–532, 2012 [DOI] [PMC free article] [PubMed] [Google Scholar]
- 39.Pearson BL, Pobbe RL, Defensor EB, Oasay L, Bolivar VJ, Blanchard DC, Blanchard RJ. Motor and cognitive stereotypies in the BTBR T+tf/J mouse model of autism. Genes Brain Behav 10: 228–235, 2011 [DOI] [PMC free article] [PubMed] [Google Scholar]
- 40.Petkov PM, Ding Y, Cassell MA, Zhang W, Wagner G, Sargent EE, Asquith S, Crew V, Johnson KA, Robinson P, Scott VE, Wiles MV. An efficient SNP system for mouse genome scanning and elucidating strain relationships. Genome Res 14: 1806–1811, 2004 [DOI] [PMC free article] [PubMed] [Google Scholar]
- 41.Ramos Da Conceicao Neta ER, Johanningsmeier SD, McFeeters RF. The chemistry and physiology of sour taste–a review. J Food Sci 72: R33–R38, 2007 [DOI] [PubMed] [Google Scholar]
- 42.Ranheim T, Dumke C, Schueler KL, Cartee GD, Attie AD. Interaction between BTBR and C57BL/6J genomes produces an insulin resistance syndrome in (BTBR × C57BL/6J) F1 mice. Arterioscler Thromb Vasc Biol 17: 3286–3293, 1997 [DOI] [PubMed] [Google Scholar]
- 43.Reed DR, Li S, Li X, Huang L, Tordoff MG, Starling-Roney R, Taniguchi K, West DB, Ohmen JD, Beauchamp GK, Bachmanov AA. Polymorphisms in the taste receptor gene (Tas1r3) region are associated with saccharin preference in 30 mouse strains. J Neurosci 24: 938–946, 2004 [DOI] [PMC free article] [PubMed] [Google Scholar]
- 44.Richter CP. Sodium chloride and dextrose appetite of untreated and treated adrenalectomized rats. Endocrinology 29: 115–125, 1941 [Google Scholar]
- 45.Riera CE, Vogel H, Simon SA, Damak S, le Coutre J. Sensory attributes of complex tasting divalent salts are mediated by TRPM5 and TRPV1 channels. J Neurosci 29: 2654–2662, 2009 [DOI] [PMC free article] [PubMed] [Google Scholar]
- 46.Rong M, He W, Yasumatsu K, Kokrashvili Z, Perez CA, Mosinger B, Ninomiya Y, Margolskee RF, Damak S. Signal transduction of umami taste: insights from knockout mice. Chem Senses 30, Suppl 1: i33–i34, 2005 [DOI] [PubMed] [Google Scholar]
- 47.Rosen AM, Roussin AT, Di Lorenzo PM. Water as an independent taste modality. Front Neurosci 4: 175, 2010 [DOI] [PMC free article] [PubMed] [Google Scholar]
- 48.Rosenzweig S, Yan W, Dasso M, Spielman AI. Possible novel mechanism for bitter taste mediated through cGMP. J Neurophys 81: 1661–1665, 1999 [DOI] [PubMed] [Google Scholar]
- 49.Ruiz C, Gutknecht S, Delay E, Kinnamon S. Detection of NaCl and KCl in TRPV1 knockout mice. Chem Senses 31: 813–820, 2006 [DOI] [PubMed] [Google Scholar]
- 50.Russell ES. A history of mouse genetics. Ann Rev Genet 19: 1–28, 1985 [DOI] [PubMed] [Google Scholar]
- 51.San Gabriel A, Uneyama H, Maekawa T, Torii K. The calcium-sensing receptor in taste tissue. Biochem Biophys Res Commun 378: 414–418, 2009 [DOI] [PubMed] [Google Scholar]
- 52.Sclafani A, Mann S. Carbohydrate taste preferences in rats: glucose, sucrose, maltose, fructose and polycose compared. Physiol Behav 40: 563–568, 1987 [DOI] [PubMed] [Google Scholar]
- 53.Sclafani A, Zukerman S, Glendinning JI, Margolskee RF. Fat and carbohydrate preferences in mice: the contribution of α-gustducin and Trpm5 taste signaling proteins. Am J Physiol Regul Integr Comp Physiol 293: R1504–R1513, 2007 [DOI] [PMC free article] [PubMed] [Google Scholar]
- 54.Shao CC, Stammer Y. Potassium pyrophosphate pet food palatability enhancers. Bioproducts, Inc., patent: US 2005/0170067 A1, 2005 [Google Scholar]
- 55.Silver LM. Mouse t haplotypes. Ann Rev Genet 19: 179–208, 1985 [DOI] [PubMed] [Google Scholar]
- 56.Solberg LC, Baum AE, Ahmadiyeh N, Shimomura K, Li R, Turek FW, Churchill GA, Takahashi JS, Redei EE. Sex- and lineage-specific inheritance of depression-like behavior in the rat. Mamm Genome 15: 648–662, 2004 [DOI] [PMC free article] [PubMed] [Google Scholar]
- 57.Spector AC, Andrews-Labenski J, Letterio FC. A new gustometer for psychophysical taste testing in the rat. Physiol Behav 47: 795–803, 1990 [DOI] [PubMed] [Google Scholar]
- 58.Spielman AI, Huque T, Nagai H, Whitney G, Brand JG. Generation of inositol phosphates in bitter taste transduction. Physiol Behav 56: 1149–1155, 1994 [DOI] [PubMed] [Google Scholar]
- 59.Stephenson DT, O'Neill SM, Narayan S, Tiwari A, Arnold E, Samaroo HD, Du F, Ring RH, Campbell B, Pletcher M, Vaidya VA, Morton D. Histopathologic characterization of the BTBR mouse model of autistic-like behavior reveals selective changes in neurodevelopmental proteins and adult hippocampal neurogenesis. Mol Autism 2: 7, 2011 [DOI] [PMC free article] [PubMed] [Google Scholar]
- 60.Stricker EM, Gannon KS, Smith JC. Thirst and salt appetite induced by hypovolemia in rats: analysis of drinking behavior. Physiol Behav 51: 27–37, 1992 [DOI] [PubMed] [Google Scholar]
- 61.Taruno A, Vingtdeux V, Ohmoto M, Ma Z, Dvoryanchikov G, Li A, Adrien L, Zhao H, Leung S, Abernathy M, Koppel J, Davies P, Civan MM, Chaudhari N, Matsumoto I, Hellekant G, Tordoff MG, Marambaud P, Foskett JK. CALHM1 ion channel mediates purinergic neurotransmission of sweet, bitter and umami tastes. Nature 495: 223–226, 2013 [DOI] [PMC free article] [PubMed] [Google Scholar]
- 62.Tordoff MG. Gene discovery and the genetic basis of calcium appetite. Physiol Behav 94: 649–659, 2008 [DOI] [PMC free article] [PubMed] [Google Scholar]
- 63.Tordoff MG, Alarcon LK, Valmeki S, Jiang P. T1R3: a human calcium taste receptor. Sci Rep 2: 496, 2012 [DOI] [PMC free article] [PubMed] [Google Scholar]
- 64.Tordoff MG, Bachmanov AA. Influence of test duration on the sensitivity of the two-bottle choice test. Chem Senses 27: 759–768, 2002 [DOI] [PubMed] [Google Scholar]
- 65.Tordoff MG, Bachmanov AA. Influence of the number of alcohol and water bottles on murine alcohol intake. Alcohol Clin Exp Res 27: 600–606, 2003 [DOI] [PMC free article] [PubMed] [Google Scholar]
- 66.Tordoff MG, Bachmanov AA. Monell Mouse Taste Phenotyping Project. Monell Chemical Senses Center, http://www.monell.org/MMTPP, 2001 [Google Scholar]
- 67.Tordoff MG, Bachmanov AA. Mouse taste preference tests: why only two bottles? Chem Senses 28: 315–324, 2003 [DOI] [PMC free article] [PubMed] [Google Scholar]
- 68.Tordoff MG, Bachmanov AA, Reed DR. Forty mouse strain survey of voluntary calcium intake, blood calcium, and bone mineral content. Physiol Behav 91: 632–643, 2007 [DOI] [PMC free article] [PubMed] [Google Scholar]
- 69.Tordoff MG, Bachmanov AA, Reed DR. Forty mouse strain survey of water and sodium intake. Physiol Behav 91: 620–631, 2007 [DOI] [PMC free article] [PubMed] [Google Scholar]
- 70.Tordoff MG, Reed DR, Shao H. Calcium taste preferences: genetic analysis and genome screen of C57BL/6J × PWK/PhJ hybrid mice. Genes Brain Behav 7: 618–628, 2008 [DOI] [PMC free article] [PubMed] [Google Scholar]
- 71.Tordoff MG, Shao H, Alarcon LK, Margolskee RF, Mosinger B, Bachmanov AA, Reed DR, McCaughey SA. Involvement of T1R3 in calcium-magnesium taste. Physiol Genomics 34: 338–348, 2008 [DOI] [PMC free article] [PubMed] [Google Scholar]
- 72.Treesukosol Y, Smith KR, Spector AC. Behavioral evidence for a glucose polymer taste receptor that is independent of the T1R2+3 heterodimer in a mouse model. J Neurosci 31: 13527–13534, 2011 [DOI] [PMC free article] [PubMed] [Google Scholar]
- 73.Truett GE, Heeger P, Mynatt RL, Truett AA, Walker JA, Warman ML. Preparation of PCR-quality mouse genomic DNA with hot sodium hydroxide and tris (HotSHOT). Biotechniques 29: 52, 54, 2000 [DOI] [PubMed] [Google Scholar]
- 74.Witmer PD, Doheny KF, Adams MK, Boehm CD, Dizon JS, Goldstein JL, Templeton TM, Wheaton AM, Dong PN, Pugh EW, Nussbaum RL, Hunter K, Kelmenson JA, Rowe LB, Brownstein MJ. The development of a highly informative mouse simple sequence length polymorphism (SSLP) marker set and construction of a mouse family tree using parsimony analysis. Genome Res 13: 485–491, 2003 [DOI] [PMC free article] [PubMed] [Google Scholar]
- 75.Yan W, Sunavala G, Rosenzweig S, Dasso M, Brand JG, Spielman AI. Bitter taste transduced by PLC-β2-dependent rise in IP3 and à-gustducin-dependent fall in cyclic nucleotides. Am J Physiol Cell Physiol 280: C742–C751, 2001 [DOI] [PubMed] [Google Scholar]
- 76.Yang M, Abrams DN, Zhang JY, Weber MD, Katz AM, Clarke AM, Silverman JL, Crawley JN. Low sociability in BTBR T+tf/J mice is independent of partner strain. Physiol Behav 107: 649–662, 2012 [DOI] [PMC free article] [PubMed] [Google Scholar]
- 77.Yasumatsu K, Ogiwara Y, Takai S, Yoshida R, Iwatsuki K, Torii K, Margolskee RF, Ninomiya Y. Umami taste in mice uses multiple receptors and transduction pathways. J Physiol 590: 1155–1170, 2012 [DOI] [PMC free article] [PubMed] [Google Scholar]
- 78.Zhang Y, Hoon MA, Chandrashekar J, Mueller KL, Cook B, Wu D, Zuker CS, Ryba NJ. Coding of sweet, bitter, and umami tastes: different receptor cells sharing similar signaling pathways. Cell 112: 293–301, 2003 [DOI] [PubMed] [Google Scholar]
- 79.Zukerman S, Glendinning JI, Margolskee RF, Sclafani A. T1R3 taste receptor is critical for sucrose but not Polycose taste. Am J Physiol Regul Integr Comp Physiol 296: R866–R876, 2009 [DOI] [PMC free article] [PubMed] [Google Scholar]
- 80.Zukerman S, Touzani K, Margolskee RF, Sclafani A. Role of olfaction in the conditioned sucrose preference of sweet-ageusic T1R3 knockout mice. Chem Senses 34: 685–694, 2009 [DOI] [PMC free article] [PubMed] [Google Scholar]