Abstract
Quality control (QC) materials are crucial for internal quality control (IQC) and external quality assessment scheme (EQAS). However, many developing countries are disadvantaged by unavailability and high cost of commercial control material. Therefore, preparing home-made lyophilized human serum will be cost effective for used as a QC material in Bhutan. We prepared lyophilized QC material using serum collected from Bhutanese volunteers. The stability of lyophilized serum was studied at 3 selected conditions by analyzing at certain intervals. The results were statistically compared with initial values. The significant p values (<0.05) were seen in glucose, BUN, ALT, total bilirubin and protein at 2–8 °C but no significant difference were observed at −20 °C at the end of 9 months. We concluded that, home-made lyophilized human serum prepared without stabilizers could be used at least up to 9 months if stored at −20 °C and 7 months at 2–8 °C. Stabilizers and additives are necessary if the materials are to be used longer than 7–9 months.
Keywords: Quality assurance, Home-made quality control, Lyophilized serum, IQC, EQAS
Introduction
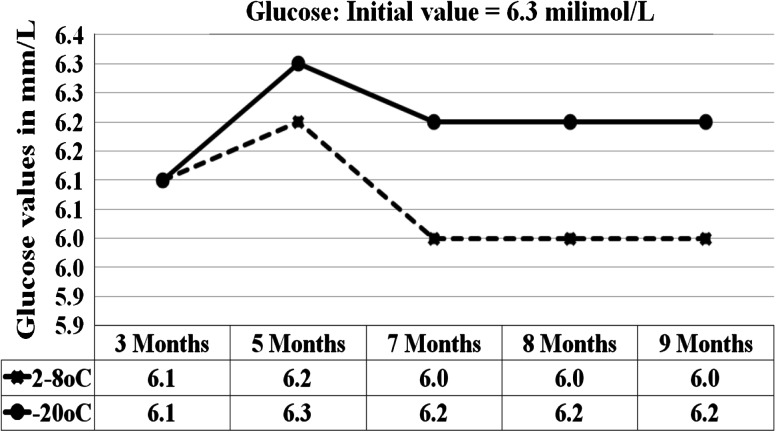
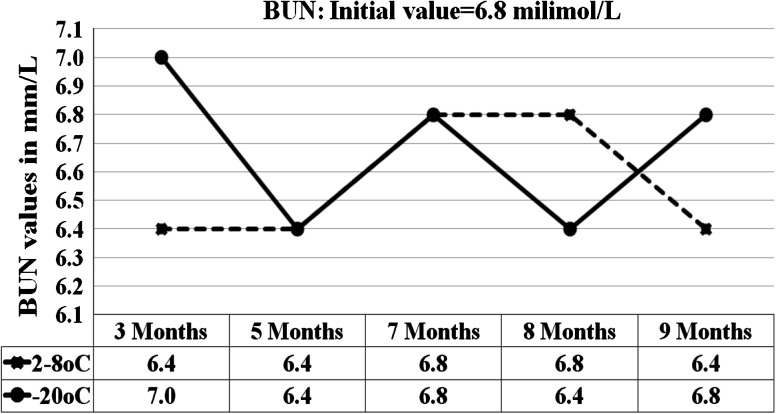
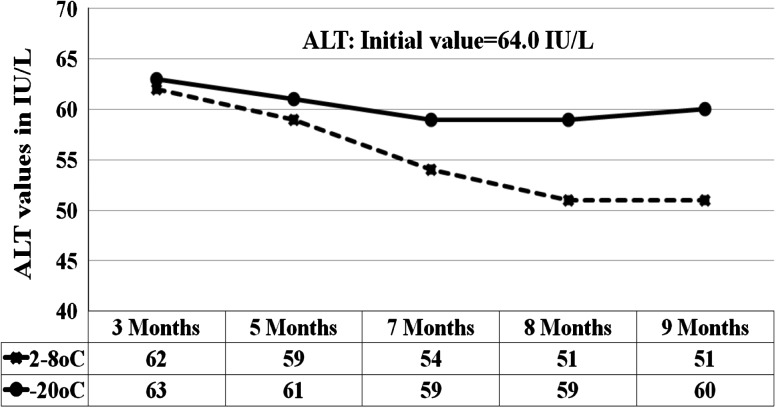
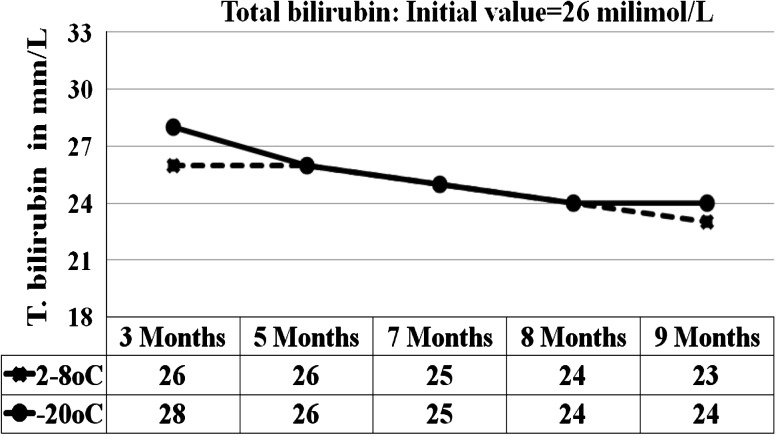
Quality control (QC) material is important for day-to-today checking of analytical procedures to ensure reliable laboratory results from patients’ sample. However, many developing countries are disadvantaged by unavailability and high cost of commercial QC materials. Therefore, home-made lyophilized human serum will be a very cost effective for use in Bhutan. Control material prepared should simulate fresh human serum in terms of matrix and concentration of analytes [1–4]. It must be sufficiently homogenous, stable and non-infective. There are two main sources of QC materials, animal and human. The animal serum is disadvantageous due to matrix effect which requires supplementation with enzymes and other constituents [3]. Therefore, human serum is suitable for preparing control materials in clinical chemistry. Three types of QC materials can be prepared, Frozen serum [5, 6], stabilized liquid serum [7–9] and Lyophilized or freeze dried serum [3, 10–12]. Frozen serum is of less useful in developing countries where there is transportation problems and where the laboratories do not have deep freezer. The chemically stabilized QC material gives rise to matrix effect and commutability problems due to interferences [13, 14]. Therefore, lyophilized serum is widely used in clinical laboratories. It is stable for 1–2 years when stored at 2–8 °C and several years at −20 °C or bellow. Some studies have shown its superiority of lyophilized serum over liquid control in terms of precision [15]. Study on lyophilized human serum without additives elsewhere concluded that their samples were suitable up to 5 months but there was loss of about 39 % of the glucose at the end of 5 months. We intended to study the stability of home-made lyophilized human serum without additives and stabilizers. We outline the durability of the home-made QC material and estimated the loss of activities at the end of the study. The information would be useful for the establishment of national EQAS in Bhutan Fig. 1, 2, 3, 4 and 5.
Fig. 1.
Graph shows the glucose results for 5 analytical runs from the sample stored at 2–8 °C and −15 to −20 °C
Fig. 2.
Graph shows the BUN results for 5 analytical runs from the sample stored at 2–8 °C and −15 to −20 °C
Fig. 3.
Graph shows the ALT results for 5 analytical runs from the sample stored at 2–8 °C and −15 to −20 °C
Fig. 4.
Graph shows the total bilirubin results for 5 analytical runs from the sample stored at 2–8 °C and −15 to −20 °C
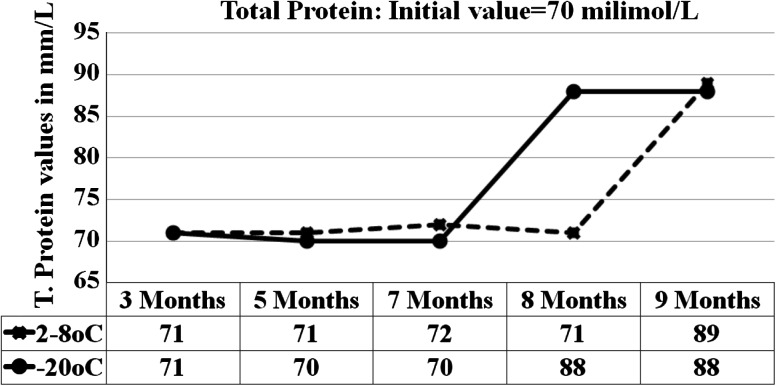
Fig. 5.
Graph shows the total protein results for 5 analytical runs from the sample stored at 2–8 °C and −15 to −20 °C
Materials and Methods
Serum was obtained from 15 healthy volunteers in Bhutan. Samples were tested for antibodies against HIV and HbsAg which were declared negative. Serum from each donor was pooled and obtained total volume of about 500 ml. Pooled serum was processed, adjusted the levels, dispensed into 3 ml vials and lyophilized for 18 h. 10 % of the vials containing lyophilized serum were tested for homogeneity using standard statistical procedures. To study the stability at three different conditions, 10 % of the vials were randomly selected and divided into 3 groups and stored at room temperature, 2–80 °C and −20 °C. At the end of each storage period, they were taken out, reconstituted and analyzed in the 3rd, 5th, 7th, 8th and 9th month after the date of preparation. Each of the samples was analyzed in duplicates. At the end of 7 and 9 months, means of the duplicate were compared with mean of the results of the initial values. We used SPSS program to test for equality of variance by Levene’s test and t test for equality of the means with 8 degrees of freedom at 95 % confidence interval. The mean of the four analytes (glucose, BUN, ALT and total protein) showing the p values <0.05 (Table 1) at 2–80 °C were plotted on the linear graph. The purpose was to examine for the deviation and differences from initial values and results from the sample stored at −15 to −20 °C. The percentage change in concentration of each analyte after seven and 9 month of storage period was computed for the sample stored at all the 3 conditions. The results of all the analytes stored at room temperature which was analyzed in 3, 5, 7, 8 and 9 months of storage period were compared with the initial values.
Table 1.
Results of the sample stored at 2–8 °C compared with initial values
| Tests | Initial values | At 2–8 °C | |||||
|---|---|---|---|---|---|---|---|
| Unit | n | Mean | SD | Mean | SD | p value | |
| Glu | mm/L | 11 | 6.3 | 0.07 | 6.11 | 0.06 | 0.01 |
| BUN | mm/L | 11 | 6.8 | 0.17 | 6.43 | 0.21 | 0.04 |
| Creat | μm/L | 11 | 186 | 4.42 | 194 | 4.42 | 0.41 |
| AST | U/L | 11 | 19 | 1.60 | 20 | 1.60 | 0.16 |
| ALT | U/L | 11 | 64 | 1.00 | 54 | 5.20 | 0.00 |
| ALP | U/L | 11 | 282 | 3.00 | 287 | 12.00 | 0.30 |
| TB | μm/L | 11 | 26 | 0.68 | 24 | 1.71 | 0.03 |
| TP | g/L | 11 | 70 | 1.00 | 78 | 9.00 | 0.03 |
| Alb | g/L | 11 | 45 | 0.40 | 45 | 1.00 | 0.90 |
Results
At 95 % confidence interval with 8 degrees of freedom, the results of the sample stored at 2–8 °C and −20 °C were statistically compared with results initial values. p value of 0.00, 0.04, 0.41, 0.16, 0.00, 0.3, 0.03, 0.03, 0.9 were obtained for glucose, BUN, creatinine, AST, ALT, ALP, total bilirubin, total protein and albumin respectively for the sample stored at 2–8 °C (Table 1). For the sample stored at −20 °C the p values were, 0.7, 0.4, 0.2, 0.9, 0.16, 0.25, 0.04, 0.8 for the same analytes respectively (Table 2). At 2–8 °C, the significant p values <0.05 were seen in glucose (0.01), BUN (0.04), ALT (0.00), total bilirubin (0.03) and total protein (0.03). The percentage changes in concentration of analytes in sample stored at all three conditions for 7 and 9 months were compared against initial values (Tables 3 and 4). At 2–8 °C, the maximum changes were shown by ALT (decreases by 15 %) and total protein (increased by 12 % at the end of 9 months. Our samples stored at room temperature showed time and temperature dependent changes characterized by marked increase or decrease in concentration (Table 5).
Table 2.
Results of the sample stored at −20 °C compared with initial values
| Tests | Initial values | At −15 to −20 °C | |||||
|---|---|---|---|---|---|---|---|
| Unit | n | Mean | SD | Mean | SD | p value | |
| Glu | mm/L | 11 | 6.3 | 0.07 | 6.16 | 0.06 | 0.7 |
| BUN | mm/L | 11 | 6.8 | 0.17 | 6.78 | 0.25 | 0.4 |
| Creat | μm/L | 11 | 186 | 4.42 | 185.64 | 8.84 | 0.2 |
| AST | U/L | 11 | 19 | 1.60 | 19.00 | 2.10 | 0.9 |
| ALT | U/L | 11 | 64 | 1.00 | 60.00 | 2.00 | 0.7 |
| ALP | U/L | 11 | 282 | 3.00 | 290.00 | 12.00 | 0.16 |
| TB | μm/L | 11 | 26 | 0.68 | 25.65 | 1.71 | 0.25 |
| TP | g/L | 11 | 70 | 1.00 | 77.00 | 9.00 | 0.05 |
| Alb | g/L | 11 | 45 | 0.40 | 45.00 | 1.00 | 0.8 |
Table 3.
Percentage changes in concentration of analytes at the end of 9 months
| Tests | At 2−8 °C (%) | At −20 °C (%) | RT (%) |
|---|---|---|---|
| Glu | −4 | −2 | −57 |
| BUN | −4 | −3 | 0 |
| Creat | +1 | +1 | +30 |
| AST | +5 | −5 | −42 |
| ALT | −15 | −6 | −87 |
| ALP | +2 | +8 | −17 |
| TB | −6 | −5 | −23 |
| TP | +12 | +26 | +24 |
| Alb | 0 | −1 | +2 |
Table 4.
Percentage changes in concentration of analytes at the end of 7 months
| Tests | At 2–8 °C (%) | At −20 °C (%) | RT (%) |
|---|---|---|---|
| Glu | +2 | 3 | −43 |
| BUN | 0 | 0 | −18 |
| Creat | −2 | −2 | −56 |
| AST | −10 | 0 | 47 |
| ALT | +11 | 8 | 55 |
| ALP | −1 | 4 | 12 |
| TB | +4 | 3 | −7 |
| TP | −1 | 1 | 4 |
| Alb | −1 | 0 | −1 |
Table 5.
Comparision of results of the samples stored at room temperature and analyzed in 3, 5, 7, 8 and 9 months of storage period with initial results
| Analytes | Unit | Initial | Months of analysis | ||||
|---|---|---|---|---|---|---|---|
| 3 | 5 | 7 | 8 | 9 | |||
| Glu | mm/L | 6.3 | 5.5 | 4.6 | 3.6 | 3.2 | 3.2 |
| BUN | mm/L | 6.8 | 7.9 | 8.2 | 8 | 7.9 | 7.9 |
| Creat | μm/L | 190 | 252 | 270 | 296 | 296 | 298 |
| AST | U/L | 19 | 12 | 15 | 10 | 8.5 | 9.5 |
| ALT | U/L | 64 | 76 | 42 | 29 | 22 | 20 |
| ALP | U/L | 282 | 287 | 273 | 249 | 270 | 273 |
| TB | μm/L | 26 | 31 | 28 | 27 | 25 | 24 |
| TP | g/L | 71 | 71 | 68 | 68 | 89 | 88 |
| Alb | g/L | 45 | 44 | 44 | 46 | 45 | 45 |
Positive sign increase exceeding the initial values, negative sign decrease in values exceeding the initial values, RT room temperature, Glu glucose, BUN blood urea nitrogen, AST aspartate aminotransferase, ALT alanine aminotransferase, ALP alkaline phosphatase, TB total bilirubin, TP total protein, Alb albumin
Discussion and Conclusion
We carried out stability tests for the sample stored at 3 chosen conditions. The results were statistically compared with the initial values from homogeneity tests. From the statistical results using SPSS program, p values <0.050 were obtained for glucose, creatinine, ALT and total protein for the sample store at 2–8 °C. There are many literatures describing the instability of the biological compounds in lyophilized and liquid serum stored at various temperatures [18–21]. Since we prepared our control material without additives and stabilizers for glucose and enzymes, the slight decrease in glucose levels could be due to degradation by microbial agents during the storage [19, 20]. Increase in creatinine may be attributed to the formation of pseudocreatinine in Jaffe’s reaction [20]. Decrease in ALT level (depicted in the graph) could be due to the loss of enzyme activities in prolonged storage and the interference by LDH on ALT should also be considered [17, 20]. Gradual decrease in total bilirubin could be due to photo degradation of bilirubin during storage [20]. The increase in protein levels could be attributed to the liberation of free proteins from the glycoprotein and increase bacterial activities could produce some enzymes and other microbial products that would contribute in increasing the protein levels [20]. The variety of statistical approaches used to assess stability also affects the stability results. It has been reported that about 5 % of the results are expected to show instability due the choice of the statistics [16]. Therefore, recommended alternate approaches to using statistics in order to provide useful information depending on the nature and frequency of the measurement. Our samples stored at room temperature showed time and temperature dependent changes characterized by marked decrease in glucose, AST, ALT, total bilirubin and increase in creatinine and total protein. These changes are expected for the samples stored at room temperature as described in many literatures [18]. Our results showed that the lyophilized QC serum prepared in-house could be used up to 7 months if stored at 2–8 °C and up to 9 months at −20 °C without significant change in concentration except total protein. Stabilizers and additives are required if the samples need to be stored longer than 9–10 months.
The study was supported by the ministry of Health, Thimphu, Bhutan.
References
- 1.Miller WG. Specimen materials, target values and commutability for external quality assessment schemes. Clin Chim Acta. 2003;327:25–37. doi: 10.1016/S0009-8981(02)00370-4. [DOI] [PubMed] [Google Scholar]
- 2.Browning DM, Hill PG, Olazabal DAV. Preparation of stabilized liquid quality control serum to be used in clinical chemistry (WHO Lab/86.4) Geneva: WHO; 1986. [Google Scholar]
- 3.Kenny AP, Eaton RH. Practical guidelines for the preparation of quality control sera for use in clinical chemistry (WHO Lab/81.4) Geneva: WHO; 1981. [Google Scholar]
- 4.Middle JG, Libeer JC, Malakhov V, Penttilä I. Characterization and evaluation of external quality assessment scheme serum. Clin Chem Lab Med. 1998;36(2):119–130. doi: 10.1515/CCLM.1998.023. [DOI] [PubMed] [Google Scholar]
- 5.Henriksen GM, Pedersen MM, Nørgaard M, Blom M, Blou L, Blaabjerg O, et al. Minimally processed fresh frozen human reference sera: preparation, testing, and application to international external quality assurance. Scand J Clin Lab Invest. 2004;64:293–308. doi: 10.1080/00365510410006612. [DOI] [PubMed] [Google Scholar]
- 6.Ferrero CA, Carobene A, Ceriotti F, Modenese A, Arcelloni C. Behavior of frozen serum pools and lyophilized sera in an external quality assessment scheme. Clin Chem. 1995;41(4):575–580. [PubMed] [Google Scholar]
- 7.Hartmann AE, Barnett RN, Richard D. Long-term stability stabilized liquid quality control serum. Clin Chem. 1981;27(8):1448–1452. [PubMed] [Google Scholar]
- 8.Premachandra P, Wood PL, HIII PG, Browning DM, Vazquez DA, Olazabat R. Preparation and stability of low-cost liquid quality-control serum stabilized with ethanediol. Clin Chem. 1987;33(6):851–852. [PubMed] [Google Scholar]
- 9.Khan MAU, Khan FA. Low cost quality control human serum: method of preparation, validation of values and its comparison with the commercial control serum. JPMA. 2004;54:375. [PubMed] [Google Scholar]
- 10.Selvakumar R, Swaminathan S, Fleming J. Report of a trial with lyophilized QC sera in the CMCH/ACBI EQAS programmes in India. Indian J Clin Biochem. 2004;19(1):24–33. doi: 10.1007/BF02872384. [DOI] [PMC free article] [PubMed] [Google Scholar]
- 11.Özbek B, Karavelioğlu H. Studies on the stability of various components of control serums prepared in lyophilized form. 2010. www.sigma.yildiz.edu.tr/2001-1-4-tam.DOC. Accessed 13 Aug 2010.
- 12.Prijavudhi A. Production and acquisition of control sample. 2010. http://www.eqacenter.com/2010_04_11_archive.html. Accessed on 13 June 2010.
- 13.Miller WG, Myers GL, Rej R. Why commutability matters? Clin Chem. 2006;52(4):553–554. doi: 10.1373/clinchem.2005.063511. [DOI] [PubMed] [Google Scholar]
- 14.Eckfeldt JH, Copeland KR. Accuracy verification and identification of matrix effects. Arch Pathol Lab Med. 1993;117(4):381–386. [PubMed] [Google Scholar]
- 15.Elm RJ, Gray BA. Liquid and lyophilized quality-control materials compared for use in continuous-flow analysis. Clin Chem. 1984;30(1):129–131. [PubMed] [Google Scholar]
- 16.Lawson, Haven GT, William Analyte stability in clinical chemistry quality control materials. Pharm sci. 1982;17(1):1–50. doi: 10.3109/10408368209107031. [DOI] [PubMed] [Google Scholar]
- 17.Smith AF, Fogg BA. Possible mechanisms for the increase in alkaline phosphatase activity of lyophilized control material. Clin Chem. 1972;18(12):1518–1523. [PubMed] [Google Scholar]
- 18.Marjani A. Effect of storage time and temperature on serum analytes. Am J Appl Sci. 2008;5(8):1047–1051. doi: 10.3844/ajassp.2008.1047.1051. [DOI] [Google Scholar]
- 19.Heins M, HeiP W, Withold W. Storage of serum or whole blood samples? Effects of time and temperature on 22 serum analytes. Eur J Clin Chem. 1995;33:231–238. doi: 10.1515/cclm.1995.33.4.231. [DOI] [PubMed] [Google Scholar]
- 20.Boyanton BL, Jr, Blick KE. Stability studies of twenty four analytes in human plasma and serum. Clin Chem. 2002;48(12):2242–2247. [PubMed] [Google Scholar]
- 21.Hanok A, Kuo J. Stability of a reconstituted serum for the assay of fifteen chemical constituents. Clin Chem. 1968;14(1):58–69. [Google Scholar]


