Abstract
Much work has been done on collapsed chains of conjugated semiconducting polymers and their applications as fluorescent probes or sensors. On surfaces spin-coated with semiconducting polymers, excitation energy transfer along the polymer backbone can be used to quickly and efficiently funnel energy to chromophores with localized energy minima. If each chromophore is immobilized within its matrix, this can result in large fluorescence anisotropy. Through nanoprecipitation of a matrix polymer blended at low mass ratios with short-chain, hydrophobic, fluorescent semiconducting polymers, we take advantage of this large fluorescence anisotropy to make polarization-sensitive nanoparticles. These nanoparticles are small at approximately 7 nm in diameter; exhibit a high quantum yield of 0.75; and are easily functionalized to bind to protein targets. By exciting the nanoparticles with polarized light on a wide-field fluorescence microscope, we are able to monitor not only protein location, but also changes in their orientation.
INTRODUCTION
Semiconducting polymer nanoparticles offer many advantages as fluorescent tags.1 They are bright2, emitting enough photons to be tracked with nanometer accuracy.3 They can be made easily using the nanoprecipitation method from a wide range of fluorescent polymers4,5, so that the absorption and emission spectra can be tailored to the specific application.6 The small size and close packing of polymers allow for efficient energy transfer to doped dyes.7 The nanoparticles can possess flexible surface chemistry and are easily functionalized with antibodies and other proteins7– 10 to bind a wide array of targets with a high degree of specificity. They can also be incorporated with other nanoparticles, such as quantum dots or gold or iron nanoparticles.11 A variety of the polymers used in semiconducting nanoparticle formation have been shown to be biocompatible.12
Electronically excited conjugated polymers in nanoparticles undergo excitation energy transfer (EET) along the polymer chain13 and transfer absorbed energy to segments where light emission takes place.14 This occurs by transferring energy from local regions on a semiconducting polymer chain of higher energy to lower energy regions where emission is preferred.15–17 By blending fluorescent conjugated polymers at low mass ratios with matrix polymers, we describe in this communication fluorescent nanoparticles with immobilized chain segments with high fluorescence polarization anisotropy. By monitoring the changes in a nanoparticle’s polarized fluorescence intensity, changes in nanoparticle position can be inferred. By attaching the polymer nanoparticles to a protein of interest and observing the change in intensity of polarized light as a polymer nanoparticle moves, change in protein orientation as well as spatial information can be obtained simultaneously using the same fluorescent probe. We demonstrate the practical application of our bright, polarization-sensitive protein probes by monitoring the rotation of microtubules as they precess across a kinesin-coated surface.
RESULTS AND DISCUSSION
Preparation of polymer nanoparticles
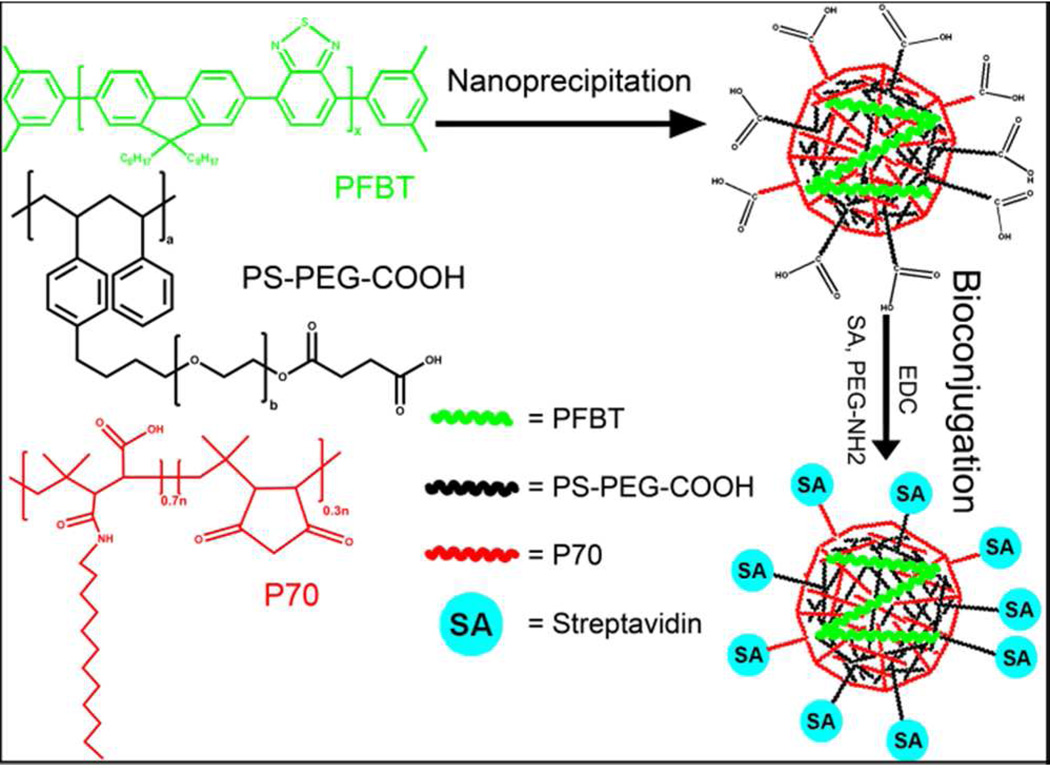
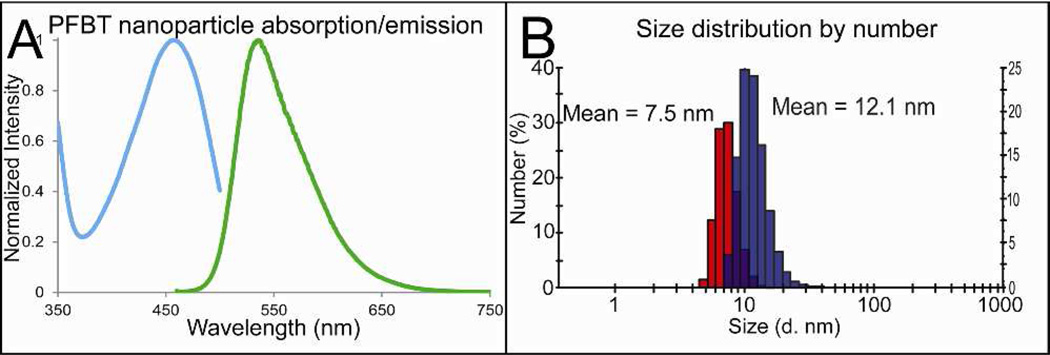
Scheme 1 shows the strategy used for preparing polarization-sensitive fluorescent nanoparticles. Nanoprecipitation of the hydrophobic fluorescent polymer Poly[(9,9-dioctylfluorenyl-2,7-diyl)-alt-co-(1,4-benzo- (2,1’,3)-thiadiazole)] (PFBT), along with matrix polymers P70 (see Scheme 1 for chemical formula) and polystyrene-graftpoly(ethylene oxide) functionalized with carboxyl groups (PSPEG- COOH), formed small fluorescent nanoparticles with a mean diameter of 7.5 nm and a peak width of 1.5 nm. The absorption/emission spectra of the nanoparticles are shown in Figure 1A. The nanoparticles were functionalized with streptavidin to facilitate binding to biomolecules. Figure S1 shows the nanoparticles had a relatively low zeta potential of −28 mV in 20 mM HEPES buffer at pH 7.2 as shown in supporting Figure 1. To prevent aggregation and nonspecific adsorption, they were also functionalized with polyethylene glycol (PEG). Dynamic light scattering (DLS) measurements show an increase in average polymer nanoparticle hydrodynamic diameter before and after bioconjugation from 7.46 nm to 12.07 nm (Figure 1B) with peak FWHM of 1.46 and 3.72 nm, respectively. The resulting functionalized nanoparticles were found to be quite monodisperse and their size measurement remained stable for months at 4 °C. The small size of polymer nanoparticles generated in this method is valuable for two reasons. First, their small size allows them to bind to proteins with minimal influence on protein activity. Second, the small size improves labeling efficiency due to improved mass transfer properties compared to larger fluorescent tags like beads.
Scheme 1.
Schematic showing the preparation of polymer nanoparticle using nanoprecipitation and subsequent bioconjugation. Briefly, a THF solution of PFBT, the amphiphilic polymer PS-PEG-COOH and matrix polymer P70 is quickly injected into water under high sonication power to precipitate nanoparticles. The hydrophobic fluorescent PFBT is trapped within the core of the nanoparticle. The THF is removed by heating and bubbling the solution with nitrogen. The nanoparticles are then bioconjugated to streptavidin and PEG. Although P70 and PS-PEG-COOH are both amphiphilic polymers and should fulfill the same role within the nanoparticles, it was found empirically that adding both polymers resulted in the smallest nanoparticles with the greatest sensitivity to excitation polarization and the most polarized emission.
Figure 1.
Bulk fluorescence and properties of polymer nanoparticles. (A) Absorption and emission spectra of polymer nanoparticles. (B) Number-averaged nanoparticle hydrodynamic diameter before functionalization shown in red and after functionalization shown in purple.
The mass of single polymer nanoparticles was estimated to be 200 kDA by differential centrifugation with a 1.5 M sucrose pillow. An 8-nm diameter polymer nanoparticle with a density of 1.1 g/cm3 would weigh approximately 200 kDa. With a mass ratio of fluorescent polymer of ~ 1–5% and a molecular weight of 10 kDa, each polymer nanoparticles contained around 1 PFBT chain per nanoparticle. This low mass ratio of fluorescent polymer differentiated these nanoparticles from previous work with Pdots, which generally contained at least 50% polymer by mass and often up to 100%.1, 6 Poisson statistics predict that some of the nanoparticles contained no fluorescent polymer, but the presence of the non-fluorescing nanoparticles did not seem to affect the other nanoparticles. Although the lower mass ratio of PFBT may decrease the brightness of the polymer nanoparticles in comparison to Pdots, it has other photophysical benefits. We have discussed previously the formation of PFBT Pdots, which contained 80% PFBT and exhibited a quantum yield of 0.3.1, 2 In contrast, these polymer nanoparticles were found to have a quantum yield of 0.75 (supporting Figure 2), which was even greater than the quantum yield of PFBT in THF solution. The high quantum yield was likely caused by the minimization of quenching by interchain aggregation15,16 as well as reduced collisional quenching of photoluminescence by the solvent17 due to the presence of the amphiphilic polymers protecting the hydrophobic fluorescent polymer from the aqueous environment. The polymer nanoparticles were quite photostable, and their brightness was nearly identical to quantum dots when excited with 488-nm light (supporting Figures 3 and 4). Also, these low mass ratio polymer nanoparticles had a high intensity dependence on the polarization of incident light.
Polarization sensitivity
The polymer nanoparticles showed a large intensity dependence on the polarization of light used for excitation. To demonstrate this, we used an optical setup with linearly polarized excitation. By using carefully positioned polarizers and λ/2 waveplates, we achieved I‖:I⊥ excitation polarization ratio of intensities of 100:1, measured after the objective. This polarized light selectively excites chromophores that have absorption dipoles aligned with the light; when the chromophores are confined to a specific orientation, the emitted light can be polarized.18 The emitted light was separated into its orthogonally polarized components, and the components were imaged onto an EMCCD camera. Information on the orientation changes of the polymer nanoparticles could be deduced from the change in intensity of the polarized components of the emitted light. The setup used for separating the emission into its orthogonal polarizations has been described previously.19
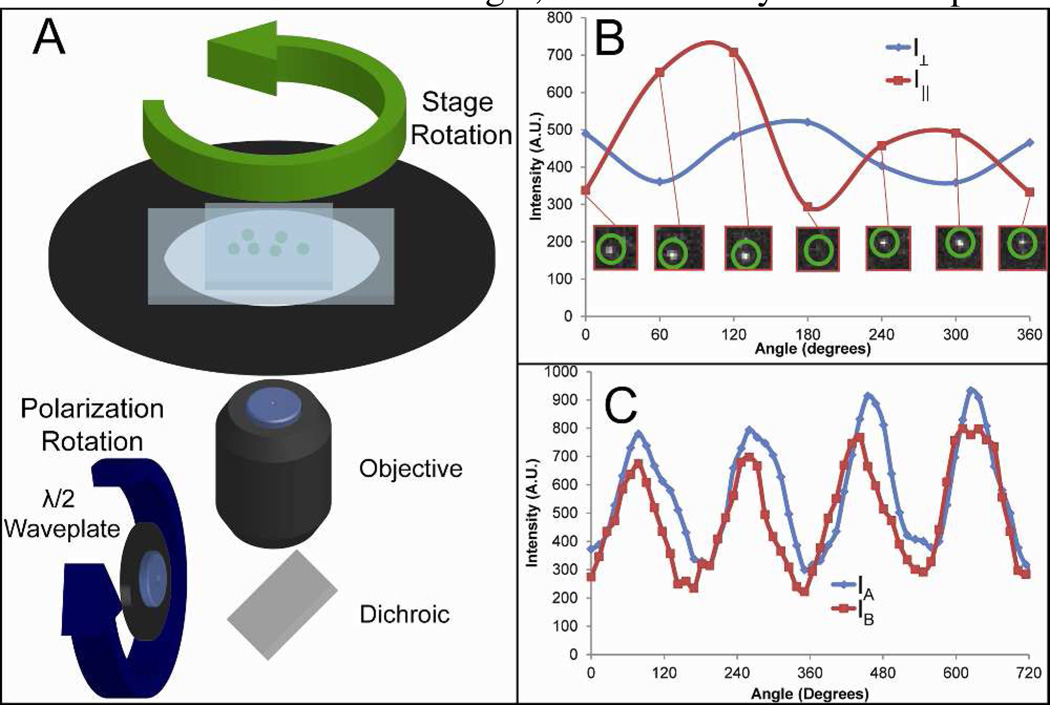
The fluorescence intensity dependence upon light polarization was monitored by two separate methods (Fig. 2A). In both methods, polymer nanoparticles were adsorbed to the surface of a cleaned, APTES-coated glass channel; then the channel was filled with Milli-Q water. In the first method, the excitation polarization remained fixed while the polymer nanoparticle sample was rotated manually using a rotation stage. The resulting anti-correlated intensity maxima and minima for the orthogonally polarized emitted light are shown in Figure 2B. The intensity of emission measured in I‖ and I⊥ channels as the stage rotated was not always anti-correlated; the relationship of the intensities of the two channels depended on the orientation at which the polymer nanoparticle adsorbed to the coverslip. The orientation of the emission dipole of each polymer nanoparticle was random, so the curves for I‖ and I⊥ could be correlated as in Figure 2C, anti-correlated, or in between correlated and anti-correlated depending on the orientation of the dipole moment with respect to the coverslip. Although the maxima and minima were present, practical issues resulting from manual repositioning of the rotation stage somewhat distorted the curves. In the second method, a λ/2 waveplate placed in a rotating mount in the excitation path was moved while the sample remained stationary. The intensity of emitted light from a single polymer nanoparticle for I‖ and I⊥ is shown in Figure 2C. The emission from the polymer nanoparticle resembled what would be observed for a single, stationary fluorophore.
Figure 2.
Polarization of individual polymer nanoparticles. (A) Schematic showing the microscope stage and polymer nanoparticles in a channel. The polarization excitation was changed by rotation of a λ/2 plate or the stage was rotated with constant polarization. (B) The plot shows the emitted light of a single polymer nanoparticle, separated into two channels of orthogonal polarization. The orientation of the polymer nanoparticle was changed with respect to excitation polarization by rotating the stage while the excitation polarization was held constant. The emission shows a strong dependence upon the orientation of the single polymer nanoparticle. Inset are images taken of a single nanoparticle upon stage rotation captured by the I‖ channel. (C) The plot shows the emitted light of a single polymer nanoparticle as the excitation polarization was rotated. The correlated intensity change in orthogonally polarized emission channels, labeled IA and IB, was what would be expected from a single emitting chromophore.
The mean molecular mass of the PFBT polymer used in the nanoparticles was 10 kDa, which corresponded to an average of 20 chromophores per polymer chain. Each fluorescent monomer was approximately 1.5 nm in length, so in order for the polymer chain to fit inside a 7-nm-diameter nanoparticle, there must be kinks in the chain. These kinks created sections of polymer chain that were local energy minima and were preferential for photon emission.20 Intrachain transfer of excitation energy to these regions allowed these polymer chains to behave similarly to a single fluorophore.21 Schwartz et. al. have also shown that polarization can spontaneously increase when the excitation energy is trapped at these local minima,22 which will favor polarized light emission from the polymer nanoparticles.
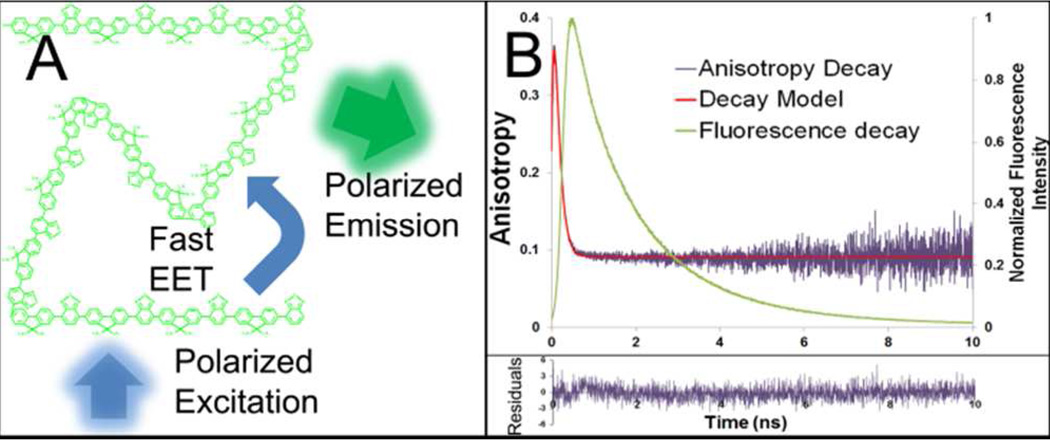
Figure 3Ais a cartoon depicting EET within the polymer nanoparticle. The PFBT polymer absorbed photons aligned with its absorption dipole and the absorbed energy was quickly transferred to the lowest energy point on the chain. The chromophore that ultimately emitted a photon may or may not have had its dipole moment aligned with the absorption dipole. This means that for individual fluorescent nanoparticles, the absorption and emission of the PFBT polymer can give information on changes in nanoparticle orientation. However, due to energy transfer, the excitation and emission polarizations may be randomly oriented with respect to each other. Figure 3B is an overlay of the time-resolved anisotropy decay and the fluorescence lifetime decay of polymer nanoparticles in bulk aqueous solution. The high initial anisotropy of 0.36 may be due to emission from the initially excited chromophore, which was aligned with the polarized light and would be expected to be highly anisotropic. The subsequent decrease in bulk anisotropy would be caused by excitation energy transfer to a chromophore with a different emission dipole moment and little relation to the excitation polarization. Instead of decreasing to a perfectly isotropic value of 0, the fluorescence anisotropy decays to a final value of ~0.1. There are several possible explanations for this residual anisotropy: (1) this is evidence that the fluorescent polymer may maintain some preferential orientation within the polymer nanoparticle, or (2) that chemical defects in the polymer chain may prevent transfer of a portion of the energy, or (3) a percentage of the light may be absorbed by the polymer’s local energy minima so little further energy transfer occurs. Integration under the anisotropic decay curve revealed that 94% of photons were emitted after the lifetime of the anisotropic decay; presumably, a large majority of photons were emitted after excited energy transfer. Based on a hydrodynamic diameter of 12.1 nm, we estimated using the Perrin equation that the rotational correlation time of the polymer nanoparticles was 200 ns. The anisotropic decay lifetime of the polymer nanoparticles measured in bulk aqueous solution was 170 ps, three orders of magnitude faster than the rotational correlation time and consistent with the timescale of energy transfer along the polymer backbone.
Figure 3.
Polarization sensitivity of polymer nanoparticle. The fluorescent PFBT polymer is held within the hydrophobic core of the polymer nanoparticle. Upon excitation with polarized light (A) intramolecular exciton transfer quickly directs fluorescence to chromophores within the polymer chain where fluorescent emission is favored. In (B), a time-resolved fluorescence anisotropy decay (purple) is overlaid with the fluorescence lifetime decay of PFBT nanoparticles, showing that emission depolarization occurs more quickly than fluorescence decay. Depolarization also occurs much faster than the calculated rotational correlation time of a 10-nm-diameter particle in water. Although the emission is polarized, the direction of polarized emission is independent of excitation polarization and different for each nanoparticle.
Semiconducting polymer nanoparticles as detectors of microtubule orientation
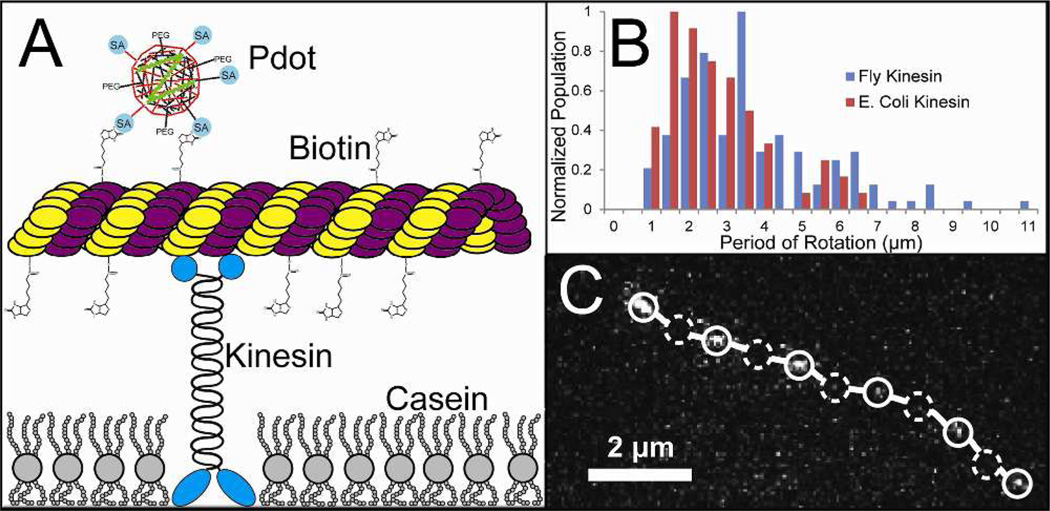
The small size, optical stability, chemical flexibility, and polarization sensitivity of the polymer nanoparticles makes them good candidates for probes to detect orientation changes in proteins. Eukaryotic microtubules inside cells usually each contain 13 protofilaments comprised of repeating units of α and β tubulin; microtubules polymerized in vitro have been shown to consist of varying numbers of protofilaments. Variation away from 13 protofilaments per microtubule can create a periodic twist in the cylinder of the microtubule.23–25 The motor protein kinesin precesses along the protofilaments axis in the microtubule, following along with any potential periodic twist in the microtubule axis. In a microtubule gliding assay, we passively adsorbed kinesin onto a glass surface to drive microtubules labeled with polymer nanoparticles through a channel. As the microtubules were directed by kinesin, the periodicity of the microtubule twist could be visualized using fluorescence microscopy (Fig. 4A).
Figure 4.
Polarization sensitive polymer nanoparticles used to detect microtubule rotation. (A) scheme showing a gliding microtubule moved by kinesin bound to a glass substrate. The polymer nanoparticles link to biotinylated tubulin within the microtubule. (B) measured microtubule periods of rotation when the microtubules are transported by two different forms of kinesin. There were 62 microtubules measured using E. coli kinesin and 131 measured using Drosophila kinesin along with 64 and 148 non-rotating microtubules, respectively. (C) Track of a single microtubule with a single bound polymer nanoparticle (open circles) show local intensity maxima while dashed circles indicate the location of local intensity minima in one of the observed channels. The optical setup used to capture the image track is described in reference 19.
The heavy chain of kinesin is approximately 70 nm long and the gliding assay was not inhibited by the presence of the 12-nmdiameter polymer nanoparticles. The periodicity of the microtubule twists was measured in this gliding assay using two different kinesin proteins: one fruit fly kinesin with a precession rate of 0.8 µm/s and E. coli kinesin with a precession rate of 1.2 µm/s. We measured the rate of precession of polymer-nanoparticle-labeled microtubules and microtubules containing fluorescent tubulin protein. The rates were the same for the fluorescently labeled and polymer-nanoparticle-labeled microtubules. The polymer nanoparticles did not appear to inhibit kinesin function. The histogram of the measured microtubule twist lengths are shown in Figure 4B, and the measured distributions in twist length remained consistent between the slower fruit fly and faster E. coli kinesin proteins. The twists were determined by the distance between local intensity maxima of polymer nanoparticle emission, and were not counted unless at least two consecutive periods of the same length were recorded between three local intensity maxima. Also, local intensity maxima and minima had to vary by at least 50%, representing a change in nanoparticle absorption/emission dipole orientation of approximately 0.75 radians over the course of the rotation. The observed numbers of rotating microtubules bound to fruit fly and E. coli kinesins were 131 and 62, respectively. Along with polymer nanoparticles that periodically showed bright and dark emission, a significant number of nanoparticles showed continuous emission while bound to precessing microtubules. This could be due to the observation of microtubules made of 13 protofilaments which did not have a twist or the absorption/emission dipole of the nanoparticle aligned with the microtubule. The latter case was considered unlikely, as often times several polymer nanoparticles labeled a single microtubule and each microtubule with multiple labels either exhibited periodic or constant emission from all bound nanoparticles. We observed 171 nonrotating microtubules bound to the fruit fly kinesin and 69 nonrotating microtubules bound to E. coli kinesin. Figure 4C is a trace of a microtubule labeled with a single polymer nanoparticle, showing alternating bright and dark spots as the microtubule rotates.
The microtubules were polymerized with 10% biotinylated tubulin, which allowed strong binding between streptavidinfunctionalized polymer nanoparticles and the microtubules. Because of the high density of biotinylated tubulin and the size of the polymer nanoparticles and tubulin units, it was likely that each polymer nanoparticle was bound to the microtubule by more than one biotin/streptavidin linkage. Virtually no fast, sporadic intensity fluctuations were visible that would be evidence for single biotin/streptavidin linkages or “the propeller effect” of polymer nanoparticles with flexible attachments to microtubules.
CONCLUSIONS
We have made small semiconducting polymer nanoparticles with a low mass ratio of fluorescent polymer that have a strong sensitivity to polarization. The chromophore absorbs light and transfers energy to the energy minima of the immobilized chain segment that was responsible for the high degree of emission polarization. The fluorescent polymer was a relatively short chain containing on average 20 monomers and made up a small mass percentage of the polymer nanoparticles, so the remaining polymer shell prevented aggregation induced quenching or collisional quenching by solvent. By exciting the nanoparticles with polarized light, we are able to measure the period of microtubule rotation. We anticipate the bright and polarization sensitive probe described here will provide a useful tool for studying the rotational motions of biomolecules.
Supplementary Material
ACKNOWLEDGMENT
We would like to thank Dr. Mike Wagenbach and the Wordeman lab for generously providing kinesin protein. We would also like to thank Dr. Lehui Xiao for his preliminary work in our lab with P70 doped polymer nanoparticles, and also to Bryant Fujimoto and Jiangbo Yu for input into the manuscript. This work was supported by a National Institutes of Health grant (NS062725).
Footnotes
Supporting Information
Information on polymer nanoparticle quantum yield, time trace, and brightness. This material is available free of charge via the Internet at http://pubs.acs.org.
REFERENCES
- 1.Wu C, Chiu DT. Angew. Chem. Int. Edit. 2013;52:3086–3109. doi: 10.1002/anie.201205133. [DOI] [PMC free article] [PubMed] [Google Scholar]
- 2.Wu C, Schneider T, Zeigler M, Yu J, Schiro PG, Burnham DR, McNeill J, Chiu DT. J. Am. Chem. Soc. 2010;132:15410–15417. doi: 10.1021/ja107196s. [DOI] [PMC free article] [PubMed] [Google Scholar]
- 3.Yu J, Wu C, Sahu SP, Fernando LP, Szymanski C, McNeill J. J. Am. Chem. Soc. 2009;131:18410–18414. doi: 10.1021/ja907228q. [DOI] [PubMed] [Google Scholar]
- 4.Hashim Z, Howes P, Green M. J. Mater. Chem. 2011;21:1797–1803. [Google Scholar]
- 5.Zhang X, Yu J, Wu C, Jin Y, Rong Y, Ye F, Chiu DT. ACS Nano. 2012;6:5429–5439. doi: 10.1021/nn301308w. [DOI] [PMC free article] [PubMed] [Google Scholar]
- 6.Rong Y, Wu C, Yu J, Zhang X, Ye F, Zeigler M, Gallina ME, Wu I-C, Zhang Y, Chan Y-H, et al. ACS Nano. 2013;7:376–384. doi: 10.1021/nn304376z. [DOI] [PMC free article] [PubMed] [Google Scholar]
- 7.Jin Y, Ye F, Zeigler M, Wu C, Chiu DT. ACS Nano. 2011;5:1468–1475. doi: 10.1021/nn103304m. [DOI] [PMC free article] [PubMed] [Google Scholar]
- 8.Wu C, Jin Y, Schneider T, Burnham DR, Smith PB, Chiu DT. Angew. Chem. Int. Ed. 2010;49:9346–9440. doi: 10.1002/anie.201004260. [DOI] [PMC free article] [PubMed] [Google Scholar]
- 9.Wu C, Hansen SJ, Hou Q, Yu J, Zeigler M, Jin Y, Burnham DR, Mcneill JD, Olson JM, Chiu DT. Angew. Chem. Int. Ed. 2011;50:3430–3434. doi: 10.1002/anie.201007461. [DOI] [PMC free article] [PubMed] [Google Scholar]
- 10.Petkau K, Kaeser A, Fischer I, Brunsveld L, Schenning APHJ. J. Am. Chem. Soc. 2011;133:17063–17071. doi: 10.1021/ja2075345. [DOI] [PubMed] [Google Scholar]
- 11.Chan Y-H, Ye F, Gallina ME, Zhang X, Jin Y, Wu I-C, Chiu DT. J. Am. Chem. Soc. 2012;134:7309–7312. doi: 10.1021/ja3022973. [DOI] [PMC free article] [PubMed] [Google Scholar]
- 12.Medina C, Santos-Martinez MJ, Radomski A, Corrigan OI, Radomski MW. Brit. J. Pharmacol. 2007;150:552–558. doi: 10.1038/sj.bjp.0707130. [DOI] [PMC free article] [PubMed] [Google Scholar]
- 13.Zhou Q, Swager TM. J. Am. Chem. Soc. 1995;117:12593–12602. [Google Scholar]
- 14.Klärner G, Lee J-I, Davey MH, Miller RD. Adv.Mater. 1999;11:115–119. [Google Scholar]
- 15.Nguyen T-Q, Doan V, Schwartz BJ. J.Chem. Phys. 1999;110:4068–4078. [Google Scholar]
- 16.Jakubiak R, Collison CJ, Wan WC, Rothberg LJ. J. Phys.Chem. A. 1999;103:2394–2398. [Google Scholar]
- 17.Yu J, Hu D, Barbara PF. Science. 2000;289:1327–1330. doi: 10.1126/science.289.5483.1327. [DOI] [PubMed] [Google Scholar]
- 18.Lakowicz JR. Principles of Fluorescence Spectroscopy. 3rd ed. Springer; 2006. [Google Scholar]
- 19.Zeigler MB, Allen PB, Chiu DT. Biophys. J. 2011;100:2846–2851. doi: 10.1016/j.bpj.2011.04.042. [DOI] [PMC free article] [PubMed] [Google Scholar]
- 20.Lee J-I, Zyung T, Miller RD, Kim YH, Jeoung SC, Kim D. J. Mater. Chem. 2000;10:1547–1550. [Google Scholar]
- 21.Huser T, Yan M, Rothberg LJ. Proc. Natl. Acad. Sci. USA. 2000;97:11187–11191. doi: 10.1073/pnas.97.21.11187. [DOI] [PMC free article] [PubMed] [Google Scholar]
- 22.Schwartz BJ, Nguyen T-Q, Wu J, Tolbert SH. Synth. Met. 2001;116:35–40. [Google Scholar]
- 23.Chrétien D, Wade RR. Biol. Cell. 1991;71:161–174. doi: 10.1016/0248-4900(91)90062-r. [DOI] [PubMed] [Google Scholar]
- 24.Sanghamitra R, Meyerhöfer E, Milligan RA, Howard J. J. Cell Biol. 1993;121:1083–1093. doi: 10.1083/jcb.121.5.1083. [DOI] [PMC free article] [PubMed] [Google Scholar]
- 25.Wang G, Sun W, Luo Y, Fang N. J. Am. Chem. Soc. 2010;132:16417–16422. doi: 10.1021/ja106506k. [DOI] [PubMed] [Google Scholar]
Associated Data
This section collects any data citations, data availability statements, or supplementary materials included in this article.


