

Abstract
Plasticity is a hallmark of macrophages, and in response to environmental signals these cells undergo different forms of polarized activation, the extremes of which are called classic (M1) and alternative (M2). Rapamycin (RAPA) is crucial for survival and functions of myeloid phagocytes, but its effects on macrophage polarization are not yet studied. To address this issue, human macrophages obtained from six normal blood donors were polarized to M1 or M2 in vitro by lipopolysaccharide plus interferon-γ or interleukin-4 (IL-4), respectively. The presence of RAPA (10 ng/ml) induced macrophage apoptosis in M2 but not in M1. Beyond the impact on survival in M2, RAPA reduced CXCR4, CD206 and CD209 expression and stem cell growth factor-β, CCL18 and CCL13 release. In contrast, in M1 RAPA increased CD86 and CCR7 expression and IL-6, tumour necrosis factor-α and IL-1β release but reduced CD206 and CD209 expression and IL-10, vascular endothelial growth factor and CCL18 release. In view of the in vitro data, we examined the in vivo effect of RAPA monotherapy (0·1 mg/kg/day) in 12 patients who were treated for at least 1 month before islet transplant. Cytokine release by Toll-like receptor 4-stimulated peripheral blood mononuclear cells showed a clear shift to an M1-like profile. Moreover, macrophage polarization 21 days after treatment showed a significant quantitative shift to M1. These results suggest a role of mammalian target of rapamycin (mTOR) into the molecular mechanisms of macrophage polarization and propose new therapeutic strategies for human M2-related diseases through mTOR inhibitor treatment.
Keywords: cytokines, Immunotherapeutics, macrophage polarization, macrophages/monocytes, rapamycin, transplantation
Introduction
Rapamycin (RAPA) is a macrocyclic triene antibiotic produced by the actinomycete Streptomyces hygroscopicus.1 Although RAPA was originally isolated for its antifungal properties, it is now considered an immunosuppressive agent and is currently used for the prevention of kidney transplant rejection.2,3 In humans, it has been also used successfully in islet,4 combined kidney–pancreas,5 liver6 and lung and heart transplantation,7 and for graft-versus-host disease prophylaxis.8 The immunosuppressive action of RAPA is commonly ascribed to inhibition of T-cell proliferation.9 In fact the intracellular target of RAPA is the mammalian target of rapamycin (mTOR), a 290 000 molecular weight member of the phosphatidylinositol 3′-kinase-like family with serine/threonine kinase activity that regulates protein translation, cell cycle progression and cellular proliferation.10,11
Recently, we and others have suggested that cells of the immune system other than proliferating lymphocytes are targets of RAPA action.12 In particular RAPA was shown to be a good candidate for pharmacological modulation of dendritic cells13–21 and CD4+ CD25+ regulatory T cells.22–27 Moreover, a growing body of evidence indicates that in myeloid phagocytes (monocytes, macrophages, granulocytes and myeloid dendritic cells), the mTOR pathway is crucial for survival and activation.19,28–31
Plasticity is a hallmark of myeloid mononuclear phagocytes and in response to environmental signals these cells undergo different forms of polarized activation, the extremes of which are called classic or M1 and alternative or M2.32,33 Although the central and pervasive action of RAPA in innate immune responses is becoming apparent,30,34 its effect on macrophage viability or polarization is still discordant19,31,35 or not yet studied.
To address this issue we tested the effect of RAPA on a well-characterized in vitro model of human macrophage polarization.36 Moreover, since 2002, we have been using two clinical protocols in which RAPA is given as monotherapy to patients before solitary islet transplantation.37 These studies have provided the unique opportunity to investigate the in vivo effect of RAPA alone on human mononuclear phagocytes. We demonstrate that RAPA selectively affects M0/M2 survival and induces modifications of phenotype and cytokine release depending on the type of polarization. Moreover, RAPA treatment unbalances to an M1-like inflammatory response in vivo.
Materials and methods
Macrophage preparation and polarization
Highly enriched human monocytes (> 98% CD14+) were obtained from normal blood donor buffy coats (by courtesy of Centro Trasfusionale, Ospedale San Raffaele, Milan, Italy) by two-step gradient centrifugation followed by an additional step using the Monocyte Isolation kit II according to the manufacturer's instructions (Miltenyi Biotech, Bergisch Gladbach, Germany). Macrophages were obtained by culturing monocytes in RPMI-1640 (Biochrom, Berlin, Germany), 20% fetal calf serum (FCS; Hyclone, Logan, UT) supplemented with 100 ng/ml macrophage colony-stimulating factor (M-CSF; Pepro Tech, Rocky Hill, NJ) in petriPERM dishes (Heraeus GmbH, Hanau, Germany) at a density of 1·5 × 105/cm2. After 7 days resting fully differentiated macrophages were obtained. Macrophage polarization was obtained by removing the culture medium and culturing macrophages for an additional 48 hr in RPMI-1640 supplemented with 5% FCS and 100 ng/ml lipopolysaccharide (LPS; Escherichia coli 0111:B4; Sigma Aldrich, St Louis, MO) plus 20 ng/ml interferon-γ (IFN-γ; Pepro Tech) for M1 polarization, 20 ng/ml interleukin-4 (IL-4; Pepro Tech) for M2 polarization or 100 ng/ml M-CSF for M0 polarization. RAPA (Sigma Aldrich) 10 ng/ml was added during polarization.
Cell recovery and viability
Cell recovery after polarization in the presence or absence of 10 ng/ml RAPA was evaluated using a Burker cell counting chamber. To assess apoptosis, phosphatidylserine exposure was determined using an annexin V-FITC Kit (Bender MedSystems, San Bruno, CA) in combination with propidium iodide (PI; Sigma Aldrich). After polarization, macrophages were detached by keeping the cells on ice for 30 min and pipetting them off using cold medium, washed, labelled with annexin V-FITC for 30 min on ice and subsequently with 1 mg/ml PI. Annexin V/PI staining was analysed on a BD FACScan™ using cell quest software (BD Biosciences, Rockville, MD). Alternatively, apoptotic cells were identified on the basis of hypodiploid DNA content that results from DNA fragmentation. After polarization culture macrophages were detached, washed once with PBS, and fixed with 70% ethanol at −20° for 24 hr. Fixed cells were washed three times and incubated for 1 hr with a PI solution (20 μg/ml) containing 0·1 mg/ml RNase A (Sigma Chemical Co.). Cells were then subjected to cell cycle analysis for determining DNA contents by flow cytometry. Data from 10 000 events were collected in the final gated histograms. Apoptosis was measured as subG1 fraction.
Flow cytometry analysis of surface antigens
Human macrophages were treated with PBS + EDTA 5 mm, harvested, and washed twice. Cell staining was performed using mouse monoclonal antibodies followed by FITC-conjugated affinity purified, isotype-specific goat anti-mouse IgG F(ab’)2 antibodies (Jackson Immunoresearch, Baltimore, PA). The FcR receptors were blocked by adding 1% human serum to antibody incubation buffers. The following monoclonal antibodies were used in this study: PAM-1 (IgG1 anti-CD206), UCHM1 (IgG2a anti-CD14) from Dr P. Allavena, Humanitas, Milan; 11G7 [IgG1 anti-Toll-like receptor 2 (TLR2)], 3G8 (IgG1 anti-CD16), 3D3 (IgG1 anti-CD32), 10.1 (IgG1 anti-CD64), L307.4 (IgG1 anti-CD80), 2331 (IgG1 anti-CD86), ML233 (IgG1 anti-CD23), GHI/61 (IgG1 anti-CD163), M-A251 (IgG2a anti-CD25), DCN46 (IgG2b anti-CD209), 19.2 (IgG1 anti-CD206) from BD Biosciences; 150503 (IgG2a anti-CCR7), 40131 (IgG2a anti-CD127), 44716 (IgG2B anti-CXCR4), human IL-15Rα affinity purified polyclonal antibody (goat IgG anti-IL-15Rα) from R&D Systems, Inc. (Abingdon, UK); TR9 (IgG1 anti-CD36) from AbCAM (Cambridge, UK). Staining was analysed on a BD FACScan™ using cell quest software (BD Biosciences). Results are expressed as % of positive cells.
Cytokine and chemokine assays
Human cytokines/chemokines were detected using multiplex bead-based assays based on × MAP technology (Bio-Plex Human Cytokine 27-Plex Panel; Bio-Plex Human Group II Cytokine 23-Plex Panel; Biorad Laboratories, Hercules, CA) or Duo Set ELISA kits (R&D Systems). The culture media supernatant was collected at the end of polarization and assayed for 52 proteins. The limits of detection and the coefficients of variability (intra-assay % CV; interassay % CV) of the cytokine/chemokine assay were: IL-1α: 0·5 pg/ml (4;4); IL-1β: 0·6 pg/ml (6;8); IL-1ra: 5·5 pg/ml (9;8); IL-2: 1·6 pg/ml (7;9); IL-2rα: 2·1 (6;4); IL-3: 4·8 pg/ml (7;4); IL-4: 0·7 pg/ml (9;8); IL-5: 0·6 pg/ml (8;10); IL-6: 2·6 pg/ml (7;11); IL-7: 1·1 pg/ml (6;8); IL-9: 2·5 pg/ml (8;9); IL-10: 0·3 pg/ml (5;6); IL-12p40: 23·3 pg/ml (5;8); IL-12p70: 3·5 pg/ml (6;6); IL-13: 0·7 pg/ml (8;7); IL-15: 2·4 pg/ml (5;6); IL-16: 0·4 pg/ml (6;4); IL-17: 3·3 pg/ml (8;6); IL-18: 0·2 pg/ml (4;5); IFN-γ: 6·4 pg/ml (15;9); tumour necrosis factor-α (TNF-α): 6 pg/ml (8;6); TNF-β: 0·3 pg/ml (4;4); granulocyte–macrophage colony-stimulating factor (GM-CSF): 2·2 pg/ml (12;6); granulocyte colony-stimulating factor (G-CSF): 1·7 pg/ml (10;5); M-CSF: 0·9 pg/ml (4,5); CCL2/monocyte chemotactic protein 1 (MCP-1): 1·1 pg/ml (9;7); CCL3/macrophage inflammatory protein 1α (MIP-1α): 1·6 pg/ml (7;8); CCL4/MIP-1β: 2·4 pg/ml (8;8); CCL5/Rantes: 1·8 pg/ml (9;6); CCL7/MCP-3: 1 pg/ml (7;8); CCL11/Eotaxin: 2·5 pg/ml (8;11); CCL27/CTAK: 3·4 pg/ml (5;6); CXCL1/GRO-α: 6·3 pg/ml (5;8); CXCL9/MIG: 1·2 pg/ml (6;6); CXCL10/IP-10: 6·1 pg/ml (11;9); CXCL12/SDF1α: 8·7 pg/ml (6;6); vascular endothelial growth factor (VEGF): 3·1 pg/ml (9;7); CXCL8/IL-8: 1·0 pg/ml (9;4); basic fibroblast growth factor: 1·9 pg/ml (8;8); platelet-derived growth factor-BB: 2·9 pg/ml (9;8); hepatocyte growth factor: 4·9 pg/ml (5;6); IFN-α2: 4·3 pg/ml (7;3); leukaemia inhibitory factor: 5·5 pg/ml (4;3); macrophage migration inhibitory factor: 1·5 pg/ml (5;8); β-nerve growth factor: 0·2 pg/ml (4;7); stem cell factor: 1 pg/ml (5;4); stem cell growth factor-β (SCGF-β): 45·4 pg/ml (6;8); and TRAIL: 2·1 pg/ml (4;8); CXCL11/I-TAC: 13·9 pg/ml (4;8); CCL19/MIP-3β: 15·69 pg/ml (4;8); CCL18/MIP-4: 7 pg/ml (4;7), CCL13/MCP-4: 1·92 pg/ml (5;8).
RAPA-treated patients
Patients with type 1 diabetes and on the waiting list for islet transplantation alone at the San Raffaele Diabetes Research Institute were eligible for clinical protocols in which RAPA at a dose of 0·1 mg/kg (target through levels 8–10 ng/ml) was prescribed as monotherapy for at least 4 weeks before the first islet infusion37 (ClinicalTrial.gov NCT01060605). The study protocols were approved by the Ethics Committee of the San Raffaele Scientific Institute and all patients gave informed consent before entering the study. Between February 2002 and March 2009, 23 patients aged 30–48 years (mean 38·5 years) were enrolled and started pre-treatment with RAPA. Measurements related to this study during the pre-transplant pre-conditioning therapy were obtained on 12 of 23 patients and included: (i) circulating RAPA and circulating inflammatory markers before and every week after RAPA treatment, (ii) chemokine/cytokine release by peripheral blood mononuclear cells (PBMC) after ex vivo LPS stimulation before and 2 weeks after RAPA treatment, and (iii) efficiency of macrophages to polarize to M1 or M2 before and 3 weeks after RAPA treatment (in 9 of 12 patients).
Rapamycin was measured in whole blood using IMx sirolimus MEIA (Abbott Laboratories, Abbott Park, IL). Erythrocyte sedimentation rate was measured by VES Cube® (Diesse, Siena, Italy). C-reactive protein was measured by ADVIA 2400 Chemistry System (Bayer Healthcare, Tarrytown, NY). Fibrinogen was measured by coagulometer (STA Diagnostica; Stago, Asnier sur Seine, France). PBMC were obtained from 10 ml whole blood using Ficoll gradients and were cultured at 106/ml in six-well multiwell tissue culture plates (Falcon; Corning Lifescience, Tewksbury, MA) in RPMI-1640 (Biochrom) 10% FCS (Hyclone). For TLR4 activation, LPS 10 ng/ml was added. Chemokine/cytokine release was assessed after 24 hr by multiplex bead-based assays (see above). The efficiency of macrophages to polarize to M1 or M2 was evaluated ex vivo. Highly enriched monocytes (> 80% CD14+) were obtained by Ficoll and Percoll gradients. Monocytes were cultured (7 days) in hydrophobic Petriperm culture dishes (Heraeus GmbH) at a concentration of 106/ml in RPMI-1640 (Biochrom), 20% FCS (Hyclone) supplemented with 100 ng/ml M-CSF (Pepro Tech). Polarization was obtained as described above. After polarization culture macrophages were detached, washed once with PBS, and counted using the Burker chamber.
Statistical analysis
Data are presented as mean ± standard deviation or as median (25th to 75th centiles or min–max) as appropriate. Variables with a normal distribution were compared with unpaired or paired Student's t-test or one-way analysis of variance test followed by Tukey test for multiple comparisons. Variables with non-normal distributions were compared with Mann–Whitney U-test, Wilcoxon signed rank test or by Friedman's test followed by Wilcoxon signed rank test for multiple comparison. For all analyses, a two-tailed P-value of 0·05 was considered significant. Statistical analyses were performed using the Statistical Package for Social Science (SPSS 13·0; SPSS, Chicago, IL).
Results
In vitro human macrophage polarization is associated with major changes in membrane phenotype and cytokine secretion
Cell recovery, membrane phenotype and secretion of cytokines associated with M1 or M2 cell polarization were investigated. After M-CSF-dependent monocyte-to-macrophage differentiation, cell polarization to M1 or M2 was induced by LPS plus IFN-γ or IL-4, respectively.
Polarization did not affect cell recovery and viability. The median absolute number of macrophages after M1 and M2 polarization was 2·3 × 106/ml and 2·85 × 106/ml, respectively (n = 6, P = 0·5). As expected, membrane phenotype analysis clearly identified specific patterns that characterize M1 versus M2 polarization. In fact, macrophage to M1 polarization was associated with a significant up-regulation of CD25, CD80, CD127, CD64, CCR7, CD86, CD23, CD14, CD32, CD163 and CXCR4. In contrast, CD16, CD206 and CD209 expression decreased. Macrophage to M2 polarization was associated with a significant down-regulation of CD25, TLR2, CD127, CD64, CCR7, CD16 and CD36, whereas CD86, CD14, CD209, CXCR4 and CD206 expression increased. The net balance of these changes was that M1 macrophages expressed significantly higher levels of CD25, CD80, TLR2, CD127, CD64, CCR7, CD86, CD16, CD14 and CD32 in comparison with M2. On the other hand, M2 macrophages expressed significantly higher levels of CD206, CXCR4 and CD209 in comparison with M1. Macrophage polarization was also characterized by specific patterns of released cytokines and chemokines (Table 1). We found high levels of CXCL9/MIG, CXCL11/I-TAC, CCL19/MIP-3β, IL-6, CCL3/MIP-1α, TNF-α, CCL4/MIP-1β, G-CSF, IL-1ra, stem cell factor, IL-1β, CXCL10/IP-10, CCL5/Rantes and IL-12p70 in M1 cells (M1/M2 ratio ≥ 8), and CCL18/MIP-4 and CCL13/MCP-4 in M2 cells (M1/M2 ratio ≤ 0·25).
Table 1.
Released chemokines/cytokines after macrophage (MΦ) polarization in the presence or in the absence of rapamycin (RAPA)
| RAPA treatment2 | ||||||||
|---|---|---|---|---|---|---|---|---|
| MΦ, M1/M2 polarization1 | M1 | M2 | ||||||
| Soluble factors | MΦ | M1/M2 | M1/MΦ | M2/MΦ | Ctrl | RAPA | Ctrl | RAPA |
| CXCL9 (ng/ml) | 0·027* (0·01–0·08) | 784* | 1155* | 1·5 | 31·9 (0·03–46) | 32·1 (0·03–45·5) | 0·040 (0·01–0·09) | 0·052 (0·01–0·11) |
| CXCL11 (ng/ml) | 0·02** (0·02–0·07) | 212* | 212* | 1 | 4·25 (2·48–8·7) | 2·51* (0·97–7·3) | 0·02 (0·02–0·19) | 0·02 (0·02–0·08) |
| CCL19 (ng/ml) | 0·02* (0·02–0·79) | 81·5* | 98·6* | 1·21 | 1·97 (0·15–7·94) | 0·05* (0·02–0·65) | 0·02 (0·02–0·79) | 0·02 (0·02–0·07) |
| IL-6 (ng/ml) | 0·02** (0·002–0·4) | 44·3* | 97·4* | 2·2 | 2·08 (0·78–3·63) | 3·38* (2·6–3·99) | 0·046 (0·004–0·08) | 0·01 (0·005–0·5) |
| CCL3 (ng/ml) | 0·016** (0–0·037) | 38·6* | 60·4* | 1·6 | 1·11 (0·11–3·19) | 0·98 (0·05–1·82) | 0·013 (0–0·054) | 0·021 (0·01–0·035) |
| TNF-α (ng/ml) | 0·16** (0·01–2·45) | 31·1* | 31·8* | 1 | 5·21 (0·54–8·9) | 12·63* (1·2–48·1) | 0·16 (0·11–0·41) | 0·19 (0·17–2·34) |
| CCL4 (ng/ml) | 0·23** (0·04–0·4) | 16·9* | 12·2* | 0·72 | > 2·71 | 2·05 (0·99–2·71) | 0·160 (0·121–1·29) | 0·260 (0·12–0·83) |
| G-CSF | 4·7* (0·4–8) | 15·4* | 20·2* | 1·3 | 95 (35–126) | 108 (70–249) | 6·2 (3–53) | 5·9 (0·5–25) |
| IL-1ra (ng/ml) | 0·11* (0·001–1) | 15·2* | 18·56* | 1·2 | 2·1 (0·32–3·87) | 1·4 (0·66–1·94) | 0·13 (0·05–0·98) | 0·13 (0·03–0·88) |
| SCF | 14** (7–21) | 14·3* | 10·9* | 0·76* | 158 (104–182) | 148 (126–179) | 11 (7–14) | 12 (5–21) |
| IL-1β | 3·3** (1·4–13) | 12·5* | 13·8* | 1·1 | 46 (23–52) | 60* (27–79) | 3·7 (2·1–9) | 2·7 (2·3–11) |
| CXCL10 (ng/ml) | 0·53** (0·12–1·6) | 9·8* | 10·8* | 1·1 | > 5·76 | > 5·76 | 0·59 (0·1–3·1) | 0·22 (0·63–1·24) |
| CCL5 | 20** (12–49) | 9·8* | 21·6* | 2·2 | 493 (237–2469) | 534 (193–2469) | 30 (18–68) | 30 (17–46) |
| IL-12p70 | 14** (7–20) | 8·1* | 7·1* | 0·87 | 102 (78–190) | 258 (65–835) | 12 (9–85) | 16 (8–30) |
| IFN-γ (ng/ml) | 0·038** (0·03–0·05) | 7·8* | 82·3* | 10·5* | 3·2 (1·17–19·6) | 4·8 (1·23–23·1) | 0·408 (0·024–2·1) | 0·448 (0·036–2·1) |
| IL-10 | 13* (4–58) | 7·8 | 19·4* | 2·5 | 255 (13–538) | 30* (9–48) | 33 (21–44) | 36 (21–423) |
| CCL7 | 17** (10–21) | 7·7* | 7·5* | 0·97 | 127 (57–1191) | 119 (22–267) | 16 (10–33) | 19 (11–33) |
| IL-17 | 25** (1·5–45) | 6·6* | 9·5* | 1·4* | 244 (132–322) | 180 (78–287) | 32 (25–100) | 41 (22–64) |
| VEGF | 17** (5–31) | 6·4* | 8·5* | 1·3* | 187 (57–377) | 59* (27–130) | 29 (6–74) | 42 (7–197) |
| TNF-β | 17* (10–24) | 5·8* | 5·3* | 0·9 | 95 (39–160) | 46 (37–88) | 16 (10–24) | 20 (10–22) |
| IL-2 | 3·1** (0·9–7·7) | 4·9* | 7·1* | 1·4* | 22 (13–42) | 32 (14–51) | 4·4 (1–8·9) | 3·7 (1–9) |
| IL-12p40 (ng/ml) | 0·33 (0·18–055) | 4·1 | 2·5 | 0·6 | 0·83 (0·21–6·35) | 1 (0·24–7·5) | 0·20 (0·095–0·82) | 0·23 (0·13–0·68) |
| TRAIL | 52** (44–60) | 3·6* | 3·2* | 0·89 | 171 (105–229) | 178 (121–242) | 47 (41–54) | 51 (24–66) |
| ICAM-1 (ng/ml) | 0·47 (0·2–2·9) | 3·2 | 3·4 | 1·1 | 1·63 (0·66–6·24) | 3·05 (0·93–9·3) | 0·50 (0·20–6·4) | 0·92 (0·22–3·2) |
| CXCL1 (ng/ml) | 0·59* (0·14–1·7) | 2·7* | 3·6* | 1·3 | 2·1 (1·1–2·6) | 2·0 (0·83–7·9) | 0·79 (0·11–1·9) | 1·12 (0·13–3·3) |
| LIF | 27* (21–160) | 2·6* | 2·7 | 1 | 73 (48–286) | 89 (35–197) | 27 (22–83) | 30 (21–115) |
| IL-3 | 85** (62–168) | 2·5* | 2·2* | 0·8 | 184 (146–236) | 196 (142–300) | 72 (37–127) | 73 (49–231) |
| CCL11 | 22** (10–34) | 2·4* | 3·2* | 1·3* | 70 (60–99) | 87 (66–128) | 29 (15–81) | 27 (16–37) |
| VCAM-1 | 49** (43–61) | 2·3* | 2·1* | 0·9 | 105 (81–172) | 108 (73–233) | 44 (12–65) | 53 (12–68) |
| IL-9 | 31* (9–42) | 2·2* | 2·2* | 1 | 71 (51–95) | 75 (36–100) | 32 (22–77) | 32 (18–37) |
| IL-13 | 4·6* (1·1–9) | 2·2 | 2·1* | 0·9 | 9·7 (6·8–14) | 8·4 (5·5–9·4) | 4·3 (4·1–22) | 5·4 (3·4–7) |
| CXCL12 | 272* (121–667) | 2* | 3* | 1·5 | 814 (594–1435) | 924 (506–3007) | 402 (73–737) | 426 (90–2018) |
| IL-16 | 82** (57–85) | 2* | 1·9* | 0·96 | 157 (105–227) | 171 (111–22) | 79 (55–219) | 84 (60–127) |
| IL-2rα | 76** (55–79) | 2* | 1·9* | 0·9 | 142 (123–313) | 187 (110–214) | 71 (57–85) | 77 (67–165) |
| PDGF-BB | 21* (10–72) | 2 | 2·8* | 1·4* | 59 (44–122) | 78 (38–146) | 30 (19–375) | 31 (22–179) |
| IL-7 | 1·1 (0·4–3·2) | 1·9 | 3·3 | 1·7 | 3·6 (1·7–4·6) | 3·1 (2·4–5·1) | 1·9 (0·4–12·6) | 1·17 (0·4–1·6) |
| HGF | 448* (181–761) | 1·9* | 1·1 | 0·55* | 478 (376–618) | 446 (300–809) | 248 (63–303) | 278 (74–413) |
| IFN-α2 | 61** (49–69) | 1·8* | 1·6* | 0·89 | 97 (90–110) | 95 (86–120) | 53 (49–63) | 56 (43–74) |
| M-CSF | 69 (36–113) | 1·8 | 1·9 | 1 | 129 (69–296) | 118 (92–1310) | 72 (54–504) | 74 (49–723) |
| IL-5 | 1·4 (1–6·2) | 1·8 | 2·5 | 1·4 | 3·7 (1·2–4·5) | 3·5 (2·3–5·05) | 2 (0·9–23·7) | 1·4 (0·5–2·95) |
| Basic FGF | 34* (13–51) | 1·7 | 2·2* | 1·3 | 76 (57–85) | 79 (57–95) | 43 (10–144) | 45 (28–57 |
| IL-18 | 7* (5–10) | 1·5* | 1·4* | 0·9 | 10 (8–32) | 15 (8–21) | 7 (5–13) | 7 (4–9) |
| IL-15 | 287* (65–498) | 1·4* | 1·4* | 0·98 | 410 (360–522) | 432 (399–269) | 280 (154–464) | 254 (91–501) |
| IL-1α | 8 (5·4–9·8) | 1·4 | 1·6 | 1·1 | 13 (8–17) | 14 (8–15) | 9 (5–13) | 8 (5–16) |
| CXCL8 (ng/ml) | 1·18 (0·95–2·5) | 1·3 | 2·1 | 1·6 | > 2·52 | > 2·52 | 1·9 (0·49–2·52) | 2·1 (0·81–2·5) |
| CCL27 | 89 (30–127) | 1·2 | 1·1 | 0·92 | 102 (62–126) | 93 (68–131) | 82 (30–104) | 85 (44–121) |
| GM-CSF | 69 (38–164) | 1·1 | 2·1 | 1·9 | 143 (112–263) | 181 (130–339) | 130 (37–372) | 142 (55–177) |
| MIF | 299 (116–3198) | 1·07 | 0·91 | 0·85 | 273 (214–992) | 377 (180–4101) | 255 (141–834) | 314 (149–2115) |
| SCGF-β (ng/ml) | 3·11 (0·54–4·6) | 0·79 | 0·75 | 0·96 | 2·35 (0·40–5·3) | 2·55 (0·31–4·9) | 2·98 (0·92–18) | 1·88* (0·12–7·7) |
| CCL18 | 33** (20–70) | 0·23* | 7·1* | 30·4* | 240 (109–467) | 60* (20–106) | 1025 (303–5389) | 130* (20–1511) |
| CCL13 | 42* (20–77) | 0·1* | 1·1 | 10·6* | 47 (29–111) | 37 (20–73) | 451 (227–4369) | 86* (21–977) |
| IL-4 | 0·7** (0·1–1·3) | 0·01* | 5·6* | 721* | 4 (2·8–6·5) | 5 (3·2–11·6) | > 522·8 | > 522·8 |
Abbreviations: G-CSF, granulocyte colony-stimulating factor; FGF, fibroblast growth factor; GM-CSF, granulocyte–macrophage colony-stimulating factor; HGF, hepatocyte growth factor; ICAM, intercellular adhesion molecule; IFN, interferon; IL-6, interleukin-6; LIF, leukaemia inhibitory factor; M-CSF, macrophage colony-stimulating factor; MIF, macrophage migration inhibitory factor; PDGF, platelet-derived growth factor; SCF, stem cell factor; SCGF, stem cell growth factor; TNF, tumour necrosis factor; TRAIL, tumour necrosis factor-α-related apoptosis inducing ligand; VCAM, vascular cell adhesion molecule; VEGF, vascular endothelial growth factor. Values in bold are statistically significant (*P < 0.05).
The fold increase column reports the median (min–max) of the concentrations (pg/ml if not otherwise indicated) in unpolarized macrophage (MΦ) and the fold difference between M1 and M2, M1 and MΦ, M2 and MΦ. *P < 0·05, **P < 0·01 as assessed by Friedman's test (MΦ; n = 6) with post hoc analysis by Wilcoxon signed ranks test (M1/M2; M1/MΦ; M2/MΦ).
The RAPA treatment column reports the median of the concentrations after M1 or M2 polarization in the presence or in the absence of RAPA*P < 0·05, **P < 0·01 as assessed by Wilcoxon signed ranks test (n = 6).
In vitro RAPA selectively affects M2 recovery and viability by inducing apoptosis
Macrophage polarization to M1 or M2 was induced by LPS plus IFN-γ or IL-4, respectively, in the presence or in the absence of RAPA 10 ng/ml (Fig. 1). The presence of RAPA induced a statistically significant (P = 0·026, n = 6) decrease of M2 recovery (− 43 ± 14%) but did not affect M1. As for M2, non-polarized macrophages (M0) treated with RAPA also showed a significant decrease of recovery (− 27 ± 19%; P = 0·043). Optical microscopy (Fig. 1) confirmed an increased percentage of M2 macrophages with the morphology of dying cells, characterized by condensation of the nucleus and cytoplasmic organelles, marked vacuolization of the cytoplasm, and membrane blebbing. To understand the type of cell death induced by RAPA M0, M1 and M2 macrophages were assessed using DNA staining and annexin V/PI staining. Consistent with apoptotic cell death, RAPA selectively increased annexin V-positive cells (P < 0·01, n = 6) and cells with hypodiploid DNA content in M2 and M0 macrophages (P < 0·01, n = 6) (Fig. 2).
Figure 1.
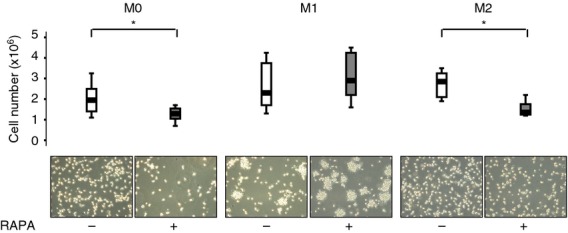
Macrophages recovery and morphology in the presence of rapamycin (RAPA) during polarization. Upper panel Cell recovery after macrophage polarization in the presence of 10 ng/ml RAPA was determined by counting viable cells using the Burker chamber on the basis of Trypan blue exclusion. The median absolute number of macrophages in untreated and RAPA-treated groups was 1·95 × 106/ml and 1·25 × 106/ml in M0, 2·3 × 106/ml and 2·9 × 106/ml in M1 and 2·85 × 106/ml and 1·35 × 106/ml in M2. Data are presented as Box Plot, n = 6. * P < 0·05, Wilcoxon signed ranks test. Lower panel Cytospin with haematoxylin & eosin staining of macrophages at × 20 and tissue culture photographed with phase-contrast optics using an Inverted optical microscope (× 20).
Figure 2.
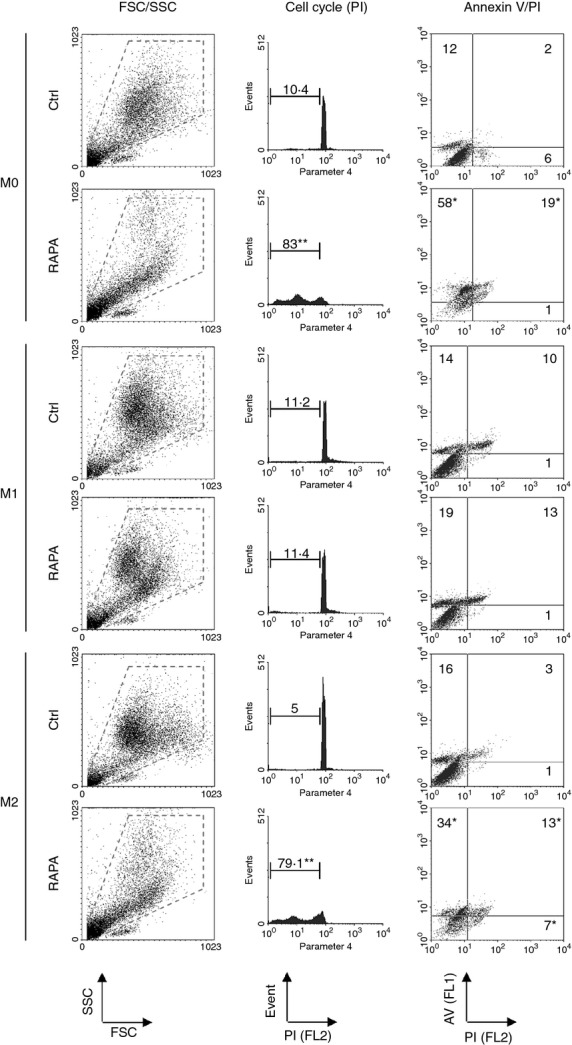
Macrophage viability in the presence of rapamycin (RAPA) during polarization. Forward and side scatter profiles, cell cycle analysis and annexinV/propidium iodide analysis of M0, M1 and M2 macrophages polarized in the presence or in the absence (Ctrl) of RAPA (10 ng/ml). The panels show a representative experiment of six performed. Data reported are percentages and represent the median of six experiments. *< 0·05 and **< 0·01 versus Ctrl, Wilcoxon signed ranks test.
In vitro RAPA induces differential modifications on membrane phenotype and cytokine secretion in M1 and M2 macrophages
The presence of RAPA induced modifications of macrophage phenotype depending on the type of polarization (Fig. 3). In M1, RAPA significantly reduced the expression of CD25, TLR2, CD127, CD64, CD14, CD163, CD36, CD206 and CD209, but increased CCR7, CD86 and CD32 expression. In M2, RAPA significantly reduced the expression of CD86, CD32, CD36, CD206, CXCR4 and CD209. As for phenotype, the cytokine/chemokine secretion was also modified by RAPA depending on polarization (Table 1). During M1 polarization CXCL11, CCL19, IL-10, VEGF and CCL18 were down-regulated while IL-6, TNF-α and IL-1β were up-regulated. On the other hand, RAPA reduced CCL18, CC13 and SCGF-β during M2 polarization.
Figure 3.
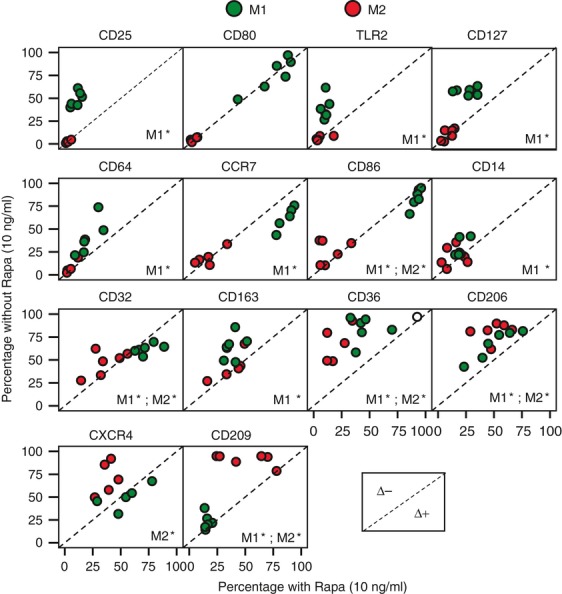
Macrophages phenotype in the presence or in the absence of rapamycin (RAPA) during polarization. Phenotype after macrophage polarization in the presence or in the absence of 10 ng/ml RAPA was evaluated by flow cytometry. The panels are scatter plots reporting six experiments performed. Data reported are percentage of positive cells. Green circles = M1; red circles = M2. The dashed line is the identity line: circles above the identity line represent observation with lower percentage in the presence of RAPA (Δ−), circles under the identity line represent observation with higher percentage in the presence of RAPA (Δ+).*< 0·05 presence of RAPA versus absence of RAPA, Wilcoxon signed ranks test.
In vivo RAPA treatment unbalances to an M1-like inflammatory response
In view of the in vitro effect of RAPA, we examined the chemokine/cytokine release by PBMC after LPS stimulation and the efficiency to polarize macrophages to M1 or M2 in patients who were treated with RAPA (0·1 mg/kg/day) as monotherapy. Twelve patients who received RAPA before islet transplant were analysed prospectively. During RAPA treatment circulating inflammatory markers such as C-reactive protein, erythrocyte sedimentation rate and fibrinogen increased significantly (Fig. 4a). The LPS-stimulated PBMC release of M1-related factors such as CXCL9, CXCL10, IFN-γ, G-CSF and IL-1ra was strongly up-regulated after 14 days of RAPA monotherapy (Table 2). Moreover, a milder, even if significant, increase was also observed for CCL11, CCL27, GM-CSF, intercellular adhesion molecule-1, hepatocyte growth factor, IL-2, IL-4, IL-9, IL-13, IL-15, IL-18 and macrophage migration inhibitory factor, while CCL4 appeared down-regulated. The efficiency to polarize to M1 or M2 was evaluated in nine of 12 patients (Fig. 4b). At baseline, 3951 cells/ml blood (2303–5318) and 2868 cells/ml blood (1686–5692) were obtained by in vitro M1 and M2 polarization, respectively (P = ns; M1/M2 ratio 1·41 ± 0·49). After 21 days of RAPA monotherapy 7795 cells/ml blood (2107–18 864) and 3247 cells/ml blood (1762–7431) were obtained by in vitro M1 and M2 polarization, respectively (P = 0·01; M1/M2 ratio 1·79 ± 0·84).
Figure 4.
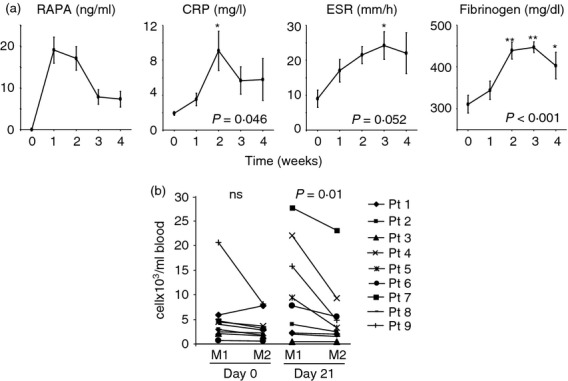
Rapamycin (RAPA) effect on macrophage polarization in vivo. (a) Circulating C-reactive protein (CRP), erythrocyte sedimentation rate (ESR) and fibrinogen were evaluated before and every week in the first month of RAPA treatment. RAPA circulating levels are also reported. Data are expressed as mean ± standard error of 12 patients and analysed by one-way analysis of variance test followed by Tukey test. *< 0·05, **< 0·01 versus time 0. (b) The efficiency of macrophages to polarize to M1 or M2 was evaluated ex vivo in nine of 12 patients treated with RAPA 0·1 mg/kg/day (target through levels 8–10 ng/ml). Cell recovery after macrophages polarization (see Materials and methods) starting from whole blood was determined by counting viable cells using the Burker chamber on the basis of Trypan blue exclusion. The absolute number of M1 and M2 macrophages obtained for each patient before and 21 days after RAPA treatment is reported. Data are expressed as number of cells for ml of starting whole blood, analysed by Wilcoxon signed ranks test.
Table 2.
Released chemokines/cytokines after ex vivo 24 hr of lipopolysaccharide stimulation of peripheral blood mononuclear cells
| Soluble factor1 | M1/M2 ratio | Pre | Day14 after RAPA treatment |
|---|---|---|---|
| CXCL9 | 784 | 43 (10–76) | 2010* (40–4310) |
| CXCL11 | 212 | nt | nt |
| CCL19 | 81·5 | nt | nt |
| IL-6 | 44·3 | > 2631 | > 2631 |
| CCL3 | 38·6 | 365 (0·4–755) | 73 (04–819) |
| TNF-α | 31·1 | 406 (158–1007) | 427 (233–1108) |
| CCL4 | 16·9 | > 3506 (30–3506) | 556* (0·8–3506) |
| G-CSF | 15·4 | 884 (182–1718) | 2262* (909–3695) |
| IL-1ra | 15·2 | 514 (166–704) | 1089* (442–2140) |
| SCF | 14·3 | 16 (12–21) | 23 (12–41) |
| IL-1β | 12·5 | 806 (301–1353) | 1592 (256–2559) |
| CXCL10 | 9·8 | 196 (90–522) | 1519** (177–5826) |
| CCL5 | 9·8 | 540 (335–3436) | 539 (130–3165) |
| IL-12p70 | 8·1 | 40·2 (11·5–75) | 39 (11–65) |
| IFN-γ | 7·8 | 167 (105–464) | 330* (158–906) |
| IL-10 | 7·8 | 41 (24–226) | 136 (87–307) |
| CCL7 | 7·7 | 105 (39–194) | 46 (37–124) |
| IL-17 | 6·6 | 152 (176–70) | 204 (132–228) |
| VEGF | 6·4 | 44 (19–123) | 75 (70–175) |
| TNF-β | 5·8 | 13 (0·9–24) | 12 (5–60) |
| IL-2 | 4·9 | 40 (8–53) | 45* (37–72) |
| IL-12p40 | 4·1 | 938 (416–2543) | 1401 (885–2088) |
| TRAIL | 3·6 | 65 (53–72) | 72 (56–130) |
| ICAM-1 | 3·2 | 265 (132–344) | 428* (165–1213) |
| CXCL1 | 2·7 | 14 799 (2222–23 157) | 16524 (3477–27 962) |
| LIF | 2·6 | 183 (99–223) | 154 (121–215) |
| IL-3 | 2·5 | 174 (145–916) | 235 (144–901) |
| CCL11 | 2·4 | 80 (40–101) | 98* (95–139) |
| VCAM-1 | 2·3 | 100 (51–123) | 105 (72–169) |
| IL-9 | 2·2 | 29 (14–65) | 64* (30–76) |
| IL-13 | 2·2 | 7·6 (3·3–14·4) | 11* (6·6–80·9) |
| CXCL12 | 2 | 4121 (685–5141) | 4267 (3107–6870) |
| IL-16 | 2 | 82·1 (50–147) | 179 (95–353) |
| IL-2rα | 2 | 90 (46–119) | 80 (70–137) |
| PDGF-BB | 2 | 133 (34–343) | 333 (205–590) |
| IL-7 | 1·9 | 4·4 (2·1–6·8) | 4·07 (3·2–8·6) |
| HGF | 1·9 | 221 (66–267) | 273* (126–335) |
| IFN-α2 | 1·8 | 70 (61–80) | 68 (56–95) |
| M-CSF | 1·8 | 1465 (1227–1768) | 1421 (937–1863) |
| IL-5 | 1·8 | 0·97 (0·66–2·5) | 1·05 (0·67–2·5) |
| Basic FGF | 1·7 | 41·3 (25–81) | 64 (31–82) |
| IL-18 | 1·5 | 9·5 (6·8–13·8) | 12·6* (9–20) |
| IL-15 | 1·4 | 148 (41–352) | 260* (139–576) |
| IL-1α | 1·4 | 82 (43–180) | 147 (106–292) |
| CXCL8 | 1·3 | > 2062 | > 2062 |
| CCL27 | 1·2 | 31 (19–49) | 40** (37–52) |
| GM-CSF | 1·1 | 955 (152–3178) | 3186* (222–3427) |
| MIF | 1·07 | 122 (80–176) | 459** (151–1260) |
| SCGF-β | 0·79 | 6768 (117–15 465) | 6731 (117–15 331) |
| CCL18 | 0·23 | nt | nt |
| CCL13 | 0·1 | nt | nt |
| IL-4 | 0·01 | 5·6 (2·1–8·3) | 8·8* (5·8–11·1) |
Abbreviations: G-CSF, granulocyte colony-stimulating factor; FGF, fibroblast growth factor; GM-CSF, granulocyte–macrophage colony-stimulating factor; HGF, hepatocyte growth factor; ICAM, intercellular adhesion molecule; IFN, interferon; IL-6, interleukin-6; LIF, leukaemia inhibitory factor; M-CSF, macrophage colony-stimulating factor; MIF, macrophage migration inhibitory factor; PDGF, platelet-derived growth factor; SCF, stem cell factor; SCGF, stem cell growth factor; TNF, tumour necrosis factor; TRAIL, tumour necrosis factor-α-related apoptosis inducing ligand; VCAM, vascular cell adhesion molecule; VEGF, vascular endothelial growth factor. Values in bold are statistically significant (*P < 0.05, **P < 0.01).
Nt, not tested.
The table shows secreted cytokines/chemokines associated with TLR4 stimulation by LPS ranked according to their fold difference between M1 and M2 (M1/M2 ratio). Columns report the median (25–75 percentiles) of the concentrations (pg/ml) and represent data from 12 different donors. *P < 0·05, **P < 0·01 versus pre as assessed by Wilcoxon Signed Ranks Test.
Discussion
Mounting evidence indicates that mTOR-mediated signalling regulates both adaptive and innate immune cell development and functions.12,38,39 In this study we described the effect of mTOR inhibition by RAPA on the plasticity of mononuclear phagocytes. In vitro, RAPA induced apoptotic cell death during M0/M2 but not M1 macrophage polarization. Previously a role for RAPA on survival of non-proliferating cells that can be derived from monocytes was suggested for osteoclasts40,41 and dendritic cells.16,19 The different susceptibility of M1 and M2 to RAPA action suggests that survival is regulated by different intracellular pathways acting in concert with the polarization and activation state of macrophage. On this basis, the selective killing of M2 macrophages by RAPA is not unexpected. In fact, we previously reported that in resting human monocytes, cell activation through three different signal pathways prevents death resulting from RAPA treatment: GM-CSF/IL-3 receptors, TLR4 and IL-1β/TNF-α/IFN-γ receptors.28 As levels of IL-3, IFN-γ, IL1-β and TNF-α are all significantly higher in M1 than in M2 polarization, this can explain the M1 resistance to RAPA induced apoptosis.
M1-polarized macrophages mediate resistance to intracellular pathogens and tissue destruction whereas M2-polarized cells are generally oriented to tissue remodelling and repair.42 The target of RAPA action is the inhibition of mTOR, so our findings propose that the mTOR pathway is essential in M2 but not in M1 macrophage survival. The mTOR acts as a central sensor for nutrient/energy availability10 and it could provide an important homeostatic mechanism for controlling the number and the function of M1 and M2 macrophages in a manner dependent upon basal nutritional status. On this basis, we can speculate that in the presence of sufficient nutrients and energy, mTOR could relay a permissive signal for M2 survival, facilitating events that drive tissue remodelling and repair. On the other hand, in conditions of limited nutrient availability, as mimicked by RAPA treatment, mTOR could preferentially ‘sacrifice’ the M2 compartment, so preserving the resistance to pathogens due to the existence of mTOR-independent pathways that regulate M1 survival at the site of inflammation. Consistent with this hypothesis is the finding that RAPA treatment impairs wound healing in patients.43 Moreover the relevance in regulating M2 survival could add a further explanation to activity of RAPA against cancer44 and atherosclerosis development,45 two diseases supported also by the presence of alternative activated macrophages.46–48 In accordance with this, Chen et al.49 recently reported that the mTOR pathway is a critical element in the regulation of monocyte differentiation to tumour-associated macrophages and that inhibition of mTOR by RAPA reduced tumour growth both in vitro and in vivo by modulating macrophage polarization.
Beyond the impact on M2 survival, RAPA induced relevant modification of macrophage phenotype and cytokine/chemokine secretion in vitro. M1 macrophages appeared more affected than M2 and, as a general trend, RAPA unbalanced the system to classic activation. In fact, in M1 macrophages, RAPA increased the expression of CD86 and CCR7 and induced a significantly higher release of IL-6, TNF-α and IL-1β (markers of classic activation) while reducing the expression of CD206 and CD209 and the release of IL-10, VEGF and CCL18 (markers of alternative activation). In contrast, in M2 macrophages RAPA decreased CXCR4, CD206 and CD209 expression and the release of SCGF-β, CCL18 and CCL13 (all markers of alternative activation). Of note, an increased CD86 and CCR7 expression associated with a decreased IL-10 secretion was previously reported after human myeloid dendritic cell maturation in the presence of RAPA,18 supporting the idea that mTOR plays a more general and pervasive role in modulating the function of myeloid mononuclear phagocytes.
Not all changes induced by RAPA can be interpreted as related to M1 or M2 polarization. For example, RAPA in M1 reduced the expression of cytokine receptors (CD25, IL-2Rα; CD127, IL-7Rα) and of pattern recognition receptors (TLR2 and CD14, co-receptor of TLR4) typically expressed in classical activation. Moreover, RAPA inhibited the expression of all the receptors involved in phagocytosis and antigen uptake including (i) scavenger receptors CD36 and CD163, (ii) C-type lectin receptors CD206 and CD209, and (iii) IgG Fc receptors CD32 and CD64. A similar behaviour was previously described in human myeloid dendritic cells,15,17 suggesting the mTOR pathway as a general key regulator of antigen uptake. The inhibition was independent by the polarization with the exception of CD32 which was down-regulated in M2 but up-regulated in M1. The interpretation of this specific divergent effect appears difficult because CD32, the IgG Fcγ receptor II, exists as two isoforms with opposing effects on maturation and function of human macrophages: the activating CD32a and the inhibitory CD32b. The balance between these divergent isoforms mediates opposing effects on maturation and function.50 Unfortunately, because of the near identical extracellular domains, 3D3 mAb used in our study binds both isoforms and we cannot discriminate which is affected by RAPA treatment.
Generally studies on macrophage polarization are limited to in vitro experimental models51,52 or to in vivo murine models53,30 and the findings are not always transferable to the in vivo human context. Thanks to the evaluation of a group of patients who were treated in monotherapy with RAPA as a pre-conditioning treatment for pancreatic islet transplantation, we had the unique opportunity to investigate the effect of RAPA alone on inflammatory status and mononuclear phagocytes in humans. The results suggested that RAPA also in vivo unbalanced the myeloid mononuclear phagocytes to classic activation. In fact, the efficiency of peripheral macrophages to polarize before or during RAPA treatment clearly showed a quantitative shift to M1. Concordantly, RAPA induced mild systemic inflammation as demonstrated by the increased circulating level of C-reactive protein, erythrocyte sedimentation rate and fibrinogen. Finally, the cytokine profiles of TLR4-stimulated PBMC showed a shift to an M1-like response. Consistent with our findings are the recent observations in an animal model54 and in most trials of transplant patients showing the emergence of distinct inflammatory diseases recognized as a consequence of RAPA treatment (i.e. inflammatory interstitial pneumonitis, de novo glomerulonephritis and systemic inflammatory response syndrome).34 Together with the described role of the phosphatidylinositol 3-kinase–mTOR pathway in limiting the production of pro-inflammatory cytokines after stimulation by TLR agonists or CD40 ligand,34 the relevance of mTOR pathways in M2 survival and M1 polarization could explain the distinct inflammatory side-effects observed during RAPA treatment.
In conclusion, we demonstrate that RAPA affects M2 survival and unbalances to an M1-like inflammatory response both in vivo and in vitro. Consequently, our work proposes the mTOR pathway as a key regulator of macrophage polarization and offers a novel mechanistic insight in macrophage polarization. Due to the availability of mTOR inhibitors for clinical therapy, the effect on macrophage polarization may open the way for mTOR targeting and tailoring in M2-related human diseases.
Acknowledgments
This work was supported by EU (HEALTH-F5-2009-241883-BetaCellTherapy), Juvenile Diabetes Research Foundation (JDRF Grant: 6-2006-1098, 31-2008-416, 4-2001-434, JT01Y01, 17-2011-601).
Glossary
- CCL
chemokine (C-C motif) ligand
- CCR
chemokine (C-C motif) receptor
- CXCL
chemokine (C-X-C motif) ligand
- CXCR
chemokine (C-X-C motif) receptor
- FCS
fetal calf serum
- FGF
fibroblast growth factor
- G-CSF
granulocyte colony-stimulating factor
- GM-CSF
granulocyte–macrophage colony-stimulating factor
- IFN
interferon
- IL
interleukin
- LPS
lipopolysaccharide
- M-CSF
macrophage colony-stimulating factor
- mTOR
mammalian target of rapamycin
- PBMC
peripheral blood mononuclear cell
- PI
propidium iodide
- SCF
stem cell factor
- SCGF
stem cell growth factor
- TNF
tumour necrosis factor
- TRAIL
tumour necrosis factor-α-related apoptosis inducing ligand
- VEGF
vascular endothelial growth factor
Disclosures
The authors declare that they have no financial disclosures or competing interests.
Supporting Information
Additional Supporting Information may be found in the online version of this article:
Figure S1. Macrophage phenotype in the presence or in the absence of rapamycin (RAPA) during polarization.
References
- 1.Vezina C, Kudelski A, Sehgal SN. Rapamycin (AY-22,989), a new antifungal antibiotic. I. Taxonomy of the producing streptomycete and isolation of the active principle. J Antibiot (Tokyo) 1975;28:721–6. doi: 10.7164/antibiotics.28.721. [DOI] [PubMed] [Google Scholar]
- 2.Flechner SM. Sirolimus in kidney transplantation indications and practical guidelines: de novo sirolimus-based therapy without calcineurin inhibitors. Transplantation. 2009;87:S1–6. doi: 10.1097/TP.0b013e3181a059a1. [DOI] [PubMed] [Google Scholar]
- 3.Kahan BD, Kaplan B, Lorber MI, Winkler M, Cambon N, Boger RS. RAD in de novo renal transplantation: comparison of three doses on the incidence and severity of acute rejection. Transplantation. 2001;71:1400–6. doi: 10.1097/00007890-200105270-00008. [DOI] [PubMed] [Google Scholar]
- 4.Shapiro AM, Lakey JR, Ryan EA, Korbutt GS, Toth E, Warnock GL, Kneteman NM, Rajotte RV. Islet transplantation in seven patients with type 1 diabetes mellitus using a glucocorticoid-free immunosuppressive regimen. N Engl J Med. 2000;343:230–8. doi: 10.1056/NEJM200007273430401. [DOI] [PubMed] [Google Scholar]
- 5.Salazar A, McAlister VC, Kiberd BA, Bitter-Suermann H, Al-Kerithy MF, MacDonald AS. Sirolimus–tacrolimus combination for combined kidney–pancreas transplantation: effect on renal function. Transplant Proc. 2001;33:1038–9. doi: 10.1016/s0041-1345(00)02321-6. [DOI] [PubMed] [Google Scholar]
- 6.Trotter JF, Wachs ME, Trouillot TE, Bak T, Kugelmas M, Kam I, Everson G. Dyslipidemia during sirolimus therapy in liver transplant recipients occurs with concomitant cyclosporine but not tacrolimus. Liver Transpl. 2001;7:401–8. doi: 10.1053/jlts.2001.23916. [DOI] [PubMed] [Google Scholar]
- 7.Snell GI, Levvey BJ, Chin W, Kotsimbos AT, Whitford H, Williams TJ, Richardson M. Rescue therapy: a role for sirolimus in lung and heart transplant recipients. Transplant Proc. 2001;33:1084–5. doi: 10.1016/s0041-1345(00)02426-x. [DOI] [PubMed] [Google Scholar]
- 8.Armand P, Gannamaneni S, Kim HT, et al. Improved survival in lymphoma patients receiving sirolimus for graft-versus-host disease prophylaxis after allogeneic hematopoietic stem-cell transplantation with reduced-intensity conditioning. J Clin Oncol. 2008;26:5767–74. doi: 10.1200/JCO.2008.17.7279. [DOI] [PMC free article] [PubMed] [Google Scholar]
- 9.Terada N, Lucas JJ, Szepesi A, Franklin RA, Domenico J, Gelfand EW. Rapamycin blocks cell cycle progression of activated T cells prior to events characteristic of the middle to late G1 phase of the cycle. J Cell Physiol. 1993;154:7–15. doi: 10.1002/jcp.1041540103. [DOI] [PubMed] [Google Scholar]
- 10.Schmelzle T, Hall MN. TOR, a central controller of cell growth. Cell. 2000;103:253–62. doi: 10.1016/s0092-8674(00)00117-3. [DOI] [PubMed] [Google Scholar]
- 11.Inoki K, Corradetti MN, Guan KL. Dysregulation of the TSC-mTOR pathway in human disease. Nat Genet. 2005;37:19–24. doi: 10.1038/ng1494. [DOI] [PubMed] [Google Scholar]
- 12.Thomson AW, Turnquist HR, Raimondi G. Immunoregulatory functions of mTOR inhibition. Nat Rev Immunol. 2009;9:324–37. doi: 10.1038/nri2546. [DOI] [PMC free article] [PubMed] [Google Scholar]
- 13.Taner T, Hackstein H, Wang Z, Morelli AE, Thomson AW. Rapamycin-treated, alloantigen-pulsed host dendritic cells induce antigen-specific T cell regulation and prolong graft survival. Am J Transplant. 2005;5:228–36. doi: 10.1046/j.1600-6143.2004.00673.x. [DOI] [PubMed] [Google Scholar]
- 14.Baumer W, Sulzle B, Weigt H, De Vries VC, Hecht M, Tschernig T, Kietzmann M. Cilomilast, tacrolimus and rapamycin modulate dendritic cell function in the elicitation phase of allergic contact dermatitis. Br J Dermatol. 2005;153:136–44. doi: 10.1111/j.1365-2133.2005.06745.x. [DOI] [PubMed] [Google Scholar]
- 15.Monti P, Mercalli A, Leone BE, Valerio DC, Allavena P, Piemonti L. Rapamycin impairs antigen uptake of human dendritic cells. Transplantation. 2003;75:137–45. doi: 10.1097/00007890-200301150-00025. [DOI] [PubMed] [Google Scholar]
- 16.Woltman AM, van der Kooij SW, Coffer PJ, Offringa R, Daha MR, van Kooten C. Rapamycin specifically interferes with GM-CSF signaling in human dendritic cells, leading to apoptosis via increased p27KIP1 expression. Blood. 2003;101:1439–45. doi: 10.1182/blood-2002-06-1688. [DOI] [PubMed] [Google Scholar]
- 17.Hackstein H, Taner T, Logar AJ, Thomson AW. Rapamycin inhibits macropinocytosis and mannose receptor-mediated endocytosis by bone marrow-derived dendritic cells. Blood. 2002;100:1084–7. doi: 10.1182/blood.v100.3.1084. [DOI] [PubMed] [Google Scholar]
- 18.Sordi V, Bianchi G, Buracchi C, et al. Differential effects of immunosuppressive drugs on chemokine receptor CCR7 in human monocyte-derived dendritic cells: selective upregulation by rapamycin. Transplantation. 2006;82:826–34. doi: 10.1097/01.tp.0000235433.03554.4f. [DOI] [PubMed] [Google Scholar]
- 19.Woltman AM, de Fijter JW, Kamerling SW, van Der Kooij SW, Paul LC, Daha MR, van Kooten C. Rapamycin induces apoptosis in monocyte- and CD34-derived dendritic cells but not in monocytes and macrophages. Blood. 2001;98:174–80. doi: 10.1182/blood.v98.1.174. [DOI] [PubMed] [Google Scholar]
- 20.Matsue H, Yang C, Matsue K, Edelbaum D, Mummert M, Takashima A. Contrasting impacts of immunosuppressive agents (rapamycin, FK506, cyclosporin A, and dexamethasone) on bidirectional dendritic cell-T cell interaction during antigen presentation. J Immunol. 2002;169:3555–64. doi: 10.4049/jimmunol.169.7.3555. [DOI] [PubMed] [Google Scholar]
- 21.Cao W, Manicassamy S, Tang H, Kasturi SP, Pirani A, Murthy N, Pulendran B. Toll-like receptor-mediated induction of type I interferon in plasmacytoid dendritic cells requires the rapamycin-sensitive PI(3)K-mTOR-p70S6K pathway. Nat Immunol. 2008;9:1157–64. doi: 10.1038/ni.1645. [DOI] [PMC free article] [PubMed] [Google Scholar]
- 22.Battaglia M, Stabilini A, Migliavacca B, Horejs-Hoeck J, Kaupper T, Roncarolo MG. Rapamycin promotes expansion of functional CD4+ CD25+ FOXP3+ regulatory T cells of both healthy subjects and type 1 diabetic patients. J Immunol. 2006;177:8338–47. doi: 10.4049/jimmunol.177.12.8338. [DOI] [PubMed] [Google Scholar]
- 23.Battaglia M, Stabilini A, Roncarolo MG. Rapamycin selectively expands CD4+ CD25+ FoxP3+ regulatory T cells. Blood. 2005;105:4743–8. doi: 10.1182/blood-2004-10-3932. [DOI] [PubMed] [Google Scholar]
- 24.Monti P, Scirpoli M, Maffi P, Piemonti L, Secchi A, Bonifacio E, Roncarolo MG, Battaglia M. Rapamycin monotherapy in patients with type 1 diabetes modifies CD4+ CD25+ FOXP3+ regulatory T-cells. Diabetes. 2008;57:2341–7. doi: 10.2337/db08-0138. [DOI] [PMC free article] [PubMed] [Google Scholar]
- 25.Strauss L, Whiteside TL, Knights A, Bergmann C, Knuth A, Zippelius A. Selective survival of naturally occurring human CD4+ CD25+ Foxp3+ regulatory T cells cultured with rapamycin. J Immunol. 2007;178:320–9. doi: 10.4049/jimmunol.178.1.320. [DOI] [PubMed] [Google Scholar]
- 26.Sauer S, Bruno L, Hertweck A, et al. T cell receptor signaling controls Foxp3 expression via PI3K, akt, and mTOR. Proc Natl Acad Sci U S A. 2008;105:7797–802. doi: 10.1073/pnas.0800928105. [DOI] [PMC free article] [PubMed] [Google Scholar]
- 27.Haxhinasto S, Mathis D, Benoist C. The AKT–mTOR axis regulates de novo differentiation of CD4+ Foxp3+ cells. J Exp Med. 2008;205:565–74. doi: 10.1084/jem.20071477. [DOI] [PMC free article] [PubMed] [Google Scholar]
- 28.Mercalli A, Sordi V, Ponzoni M, et al. Rapamycin induces a caspase-independent cell death in human monocytes. Am J Transplant. 2006;6:1331–41. doi: 10.1111/j.1600-6143.2006.01332.x. [DOI] [PubMed] [Google Scholar]
- 29.Melzi R, Maffi P, Nano R, et al. Rapamycin does not adversely affect intrahepatic islet engraftment in mice and improves early islet engraftment in humans. Islets. 2009;1:42–9. doi: 10.4161/isl.1.1.8881. [DOI] [PubMed] [Google Scholar]
- 30.Weichhart T, Costantino G, Poglitsch M, et al. The TSC-mTOR signaling pathway regulates the innate inflammatory response. Immunity. 2008;29:565–77. doi: 10.1016/j.immuni.2008.08.012. [DOI] [PubMed] [Google Scholar]
- 31.Spentzas T, Shappley RK, Savorgnan F, Meals E, English BK. Rapamycin augments the NMDA-mediated TNF suppression of MRSA-stimulated RAW264.7 murine macrophages. Int J Inflam. 2012;2012:542727. doi: 10.1155/2012/542727. [DOI] [PMC free article] [PubMed] [Google Scholar]
- 32.Gordon S, Taylor PR. Monocyte and macrophage heterogeneity. Nat Rev Immunol. 2005;5:953–64. doi: 10.1038/nri1733. [DOI] [PubMed] [Google Scholar]
- 33.Mantovani A, Sica A, Locati M. Macrophage polarization comes of age. Immunity. 2005;23:344–6. doi: 10.1016/j.immuni.2005.10.001. [DOI] [PubMed] [Google Scholar]
- 34.Weichhart T, Saemann MD. The multiple facets of mTOR in immunity. Trends Immunol. 2009;30:218–26. doi: 10.1016/j.it.2009.02.002. [DOI] [PubMed] [Google Scholar]
- 35.Danner S, Sigrist S, Moreau F, et al. Influence of rapamycin on rat macrophage viability and chemotaxis toward allogenic pancreatic islet supernates. Transplant Proc. 2008;40:470–2. doi: 10.1016/j.transproceed.2008.01.002. [DOI] [PubMed] [Google Scholar]
- 36.Martinez FO, Gordon S, Locati M, Mantovani A. Transcriptional profiling of the human monocyte-to-macrophage differentiation and polarization: new molecules and patterns of gene expression. J Immunol. 2006;177:7303–11. doi: 10.4049/jimmunol.177.10.7303. [DOI] [PubMed] [Google Scholar]
- 37.Piemonti L, Maffi P, Monti L, Lampasona V, Perseghin G, Magistretti P, Secchi A, Bonifacio E. Beta cell function during rapamycin monotherapy in long-term type 1 diabetes. Diabetologia. 2011;54:433–9. doi: 10.1007/s00125-010-1959-6. [DOI] [PubMed] [Google Scholar]
- 38.Powell JD, Delgoffe GM. The mammalian target of rapamycin: linking T cell differentiation, function, and metabolism. Immunity. 2010;33:301–11. doi: 10.1016/j.immuni.2010.09.002. [DOI] [PMC free article] [PubMed] [Google Scholar]
- 39.Saemann MD, Haidinger M, Hecking M, Horl WH, Weichhart T. The multifunctional role of mTOR in innate immunity: implications for transplant immunity. Am J Transplant. 2009;9:2655–61. doi: 10.1111/j.1600-6143.2009.02832.x. [DOI] [PubMed] [Google Scholar]
- 40.Sugatani T, Hruska KA. Akt1/Akt2 and mammalian target of rapamycin/Bim play critical roles in osteoclast differentiation and survival, respectively, whereas akt is dispensable for cell survival in isolated osteoclast precursors. J Biol Chem. 2005;280:3583–9. doi: 10.1074/jbc.M410480200. [DOI] [PubMed] [Google Scholar]
- 41.Glantschnig H, Fisher JE, Wesolowski G, Rodan GA, Reszka AA. M-CSF, TNFα and RANK ligand promote osteoclast survival by signaling through mTOR/S6 kinase. Cell Death Differ. 2003;10:1165–77. doi: 10.1038/sj.cdd.4401285. [DOI] [PubMed] [Google Scholar]
- 42.Mosser DM, Edwards JP. Exploring the full spectrum of macrophage activation. Nat Rev Immunol. 2008;8:958–69. doi: 10.1038/nri2448. [DOI] [PMC free article] [PubMed] [Google Scholar]
- 43.Flechner SM, Zhou L, Derweesh I, et al. The impact of sirolimus, mycophenolate mofetil, cyclosporine, azathioprine, and steroids on wound healing in 513 kidney-transplant recipients. Transplantation. 2003;76:1729–34. doi: 10.1097/01.TP.0000093502.26208.42. [DOI] [PubMed] [Google Scholar]
- 44.Sabatini DM. mTOR and cancer: insights into a complex relationship. Nat Rev Cancer. 2006;6:729–34. doi: 10.1038/nrc1974. [DOI] [PubMed] [Google Scholar]
- 45.Dibra A, Tiroch K, Schulz S, et al. Drug-eluting stents in acute myocardial infarction: updated meta-analysis of randomized trials. Clin Res Cardiol. 2010;99:345–57. doi: 10.1007/s00392-010-0133-y. [DOI] [PubMed] [Google Scholar]
- 46.Mantovani A, Sozzani S, Locati M, Allavena P, Sica A. Macrophage polarization: tumor-associated macrophages as a paradigm for polarized M2 mononuclear phagocytes. Trends Immunol. 2002;23:549–55. doi: 10.1016/s1471-4906(02)02302-5. [DOI] [PubMed] [Google Scholar]
- 47.Stoger JL, Gijbels MJ, van der Velden S, et al. Distribution of macrophage polarization markers in human atherosclerosis. Atherosclerosis. 2012;225:461–8. doi: 10.1016/j.atherosclerosis.2012.09.013. [DOI] [PubMed] [Google Scholar]
- 48.Oh J, Riek AE, Weng S, Petty M, Kim D, Colonna M, Cella M, Bernal-Mizrachi C. Endoplasmic reticulum stress controls M2 macrophage differentiation and foam cell formation. J Biol Chem. 2012;287:11629–41. doi: 10.1074/jbc.M111.338673. [DOI] [PMC free article] [PubMed] [Google Scholar]
- 49.Chen W, Ma T, Shen XN, Xia XF, Xu GD, Bai XL, Liang TB. Macrophage-induced tumor angiogenesis is regulated by the TSC2-mTOR pathway. Cancer Res. 2012;72:1363–72. doi: 10.1158/0008-5472.CAN-11-2684. [DOI] [PubMed] [Google Scholar]
- 50.Boruchov AM, Heller G, Veri MC, Bonvini E, Ravetch JV, Young JW. Activating and inhibitory IgG fc receptors on human DCs mediate opposing functions. J Clin Invest. 2005;115:2914–23. doi: 10.1172/JCI24772. [DOI] [PMC free article] [PubMed] [Google Scholar]
- 51.Martinet W, Verheye S, De Meyer I, Timmermans JP, Schrijvers DM, Van Brussel I, Bult H, De Meyer GR. Everolimus triggers cytokine release by macrophages: rationale for stents eluting everolimus and a glucocorticoid. Arterioscler Thromb Vasc Biol. 2012;32:1228–35. doi: 10.1161/ATVBAHA.112.245381. [DOI] [PubMed] [Google Scholar]
- 52.Baker AK, Wang R, Mackman N, Luyendyk JP. Rapamycin enhances LPS induction of tissue factor and tumor necrosis factor-α expression in macrophages by reducing IL-10 expression. Mol Immunol. 2009;46:2249–55. doi: 10.1016/j.molimm.2009.04.011. [DOI] [PMC free article] [PubMed] [Google Scholar]
- 53.Pan H, O'Brien TF, Zhang P, Zhong XP. The role of tuberous sclerosis complex 1 in regulating innate immunity. J Immunol. 2012;188:3658–66. doi: 10.4049/jimmunol.1102187. [DOI] [PMC free article] [PubMed] [Google Scholar]
- 54.Kirsch AH, Riegelbauer V, Tagwerker A, Rudnicki M, Rosenkranz AR, Eller K. The mTOR-inhibitor rapamycin mediates proteinuria in nephrotoxic serum nephritis by activating the innate immune response. Am J Physiol Renal Physiol. 2012;303:F569–75. doi: 10.1152/ajprenal.00180.2012. [DOI] [PubMed] [Google Scholar]
Associated Data
This section collects any data citations, data availability statements, or supplementary materials included in this article.