

Abstract
One of the most awaited techniques in modern physiology is the sensitive detection of spatiotemporal electrical activity in a complex network of excitable cells. The use of genetically encoded voltage probes has been expected to enable such analysis. However, in spite of recent progress, existing probes still suffer from low signal amplitude and/or kinetics too slow to detect fast electrical activity. Here, we have developed an improved voltage probe named Mermaid2, which is based on the voltage-sensor domain of the voltage-sensing phosphatase from Ciona intestinalis and Förster energy transfer between a pair of fluorescent proteins. In mammalian cells, Mermaid2 permits ratiometric readouts of fractional changes of more than 50% over a physiologically relevant voltage range with fast kinetics, and it was used to follow a train of action potentials at frequencies of up to 150 Hz. Mermaid2 was also able to detect single action potentials and subthreshold voltage responses in hippocampal neurons in vitro, in addition to cortical electrical activity evoked by sound stimuli in single trials in living mice.
Key points
The use of genetically encoded voltage probes has been expected to enable sensitive detection of spatiotemporal electrical activities in excitable cells.
However, existing probes suffer from low signal amplitude and/or kinetics too slow to detect fast electrical activity.
We have developed an improved voltage probe named Mermaid2.
Mermaid2 provides ratiometric readouts of electrical activity with fast kinetics and great sensitivity, and was able to detect single-event electrical activity both in vitro and in vivo.
Mermaid2 will expand our chances to analyse electrical events that have been less accessible by using other techniques.
Introduction
Microelectrode techniques generally provide the most accurate and reliable readouts of electrical activity in a single cell or a few cells (Ogden, 1994), but they do not provide much spatial information. Organic voltage-sensitive dyes enable spatially resolved measurements with excellent time resolutions (Grinvald & Hildesheim, 2004), but when applied to a complex network of heterogeneous cells, it is normally difficult to analyse signals from genetically specified cells. It has been expected that such analysis may become possible by using a protein-based voltage probe that can be genetically encoded under the control of cell-type-specific promoters.
The first genetically encoded voltage probe relied on the structural rearrangement of a pore domain in the Shaker potassium channel (Siegel & Isacoff, 1997), and successor probes based on voltage-gated sodium and potassium channels have been reported (Sakai et al. 2001; Ataka & Pieribone, 2002). However, it has been difficult to follow electrical activity in actual excitable cells by using these probes, mainly because of impaired membrane targeting (Baker et al. 2007). Structural rearrangement in the voltage-gated channel is triggered through the transition of its voltage sensor domain (VSD), which consists of the four membrane-spanning segments (S1–S4) and undergoes a conformational transition from a ‘down’ state at hyperpolarized voltages to an ‘up’ state at depolarized voltages (Hille, 2001). The VSD was long thought to be unique to voltage-gated channels, but with the discovery of a voltage-sensing phosphatase (VSP) in Ciona intestinalis (Ci-VSP; Murata et al. 2005) this was shown not be the case. Importantly, in contrast to conventional voltage-gated ion channels, which function as a tetrameric assembly, VSP functions as a monomer (Kohout et al. 2008), which implies that the VSP-derived VSD is structurally more stable by itself and is thus suitable for molecular engineering. After the discovery of Ci-VSP, various VSP-based voltage probes were developed, and they generally showed performance that was better than the channel-based probes (Dimitrov et al. 2007; Tsutsui et al. 2008, 2010; Perron et al. 2009; Akemann et al. 2010, 2012; Baker et al. 2012; Barnett et al. 2012; Jin et al. 2012; Lam et al. 2012).
Interestingly, the effects of modification of the probe design are often unpredictable, even for a very small modification. Recently, for example, Jin et al. (2012) studied a fusion protein consisting of a VSP-derived VSD and super ecliptic pHluorin and found that a point mutation in this fluorescent protein remarkably enhanced the response to voltage changes by unknown mechanisms. The improved mutant, ArcLight-A242, exhibited robust responses (∼35% (100 mV)−1) although its time constants were limited to over 10 ms. In contrast, ElectricPk, which consists of a VSP-derived VSD, and circularly permutated enhanced green fluorescent protein (EGFP) exhibited fast kinetics (1–2 ms), whereas the amplitude of response over the physiologically relevant voltage range was limited to fractional changes of a few per cent (Barnett et al. 2012).
In spite of the recent progress, none of the existing probes exhibits both fast kinetics and large amplitude, which are both crucial for determining the precise spatiotemporal regulation of electrical activities in a network of excitable cells. Since our development of Mermaid (Tsutsui et al. 2008), we have also been interested in modifying its design to improve its performance. Here, we report a voltage probe named Mermaid2 that provides both fast and large ratiometric readouts of electrical activity. Mermaid2 was able to detect single-event electrical activity both in vitro and in vivo.
Methods
Molecular biology
Site-directed mutagenesis was performed as described previously (Sawano & Miyawaki, 2000). For cyan fluorescent protein (CFP), a bright variant of superenhanced CFP (seCFP; Matsuda et al. 2008) termed seCFP2 (i.e. seCFP + S30R/Y39R/T65S/A87V/I128Q/D129G/H148D/S202T/A206W) was used. Details on the constructs are shown in Supplemental Fig. 1, available online only. cDNA encoding ArcLight-A242 was constructed according to the report (Jin et al. 2012). pCS2+ vector was used for cRNA synthesis as well as for expression in mammalian cells unless otherwise noted.
Voltage-clamp and photometry in Xenopus oocytes
The preparation of Xenopus oocytes and the synthesis and microinjection of cRNAs were as described previously (Goldin, 1992). Briefly, the frogs were anaesthetized before surgery by immersing in water containing 0.15% Tricaine. The oocytes were isolated and treated with collagenase (1 mg/ml, Nitta Gelatin, Osaka, Japan). After isolation of oocytes, the frogs were stitched up, and recovered in fresh water. Simultaneous two-electrode voltage-clamp (TEVC) and photometry were performed using an amplifier (OC-725C, Warner Instruments, CT, USA) and an inverted microscope (IX70; Olympus, Tokyo, Japan) equipped with a stable 75 W xenon lamp (Ushio, Tokyo, Japan). Intracellular glass microelectrodes were filled with 2.5 m KCl (pH 7.2) and had resistances ranging from 0.1 to 3.0 MΩ. An objective lens (×20, NA 0.70; Olympus) was used to collect fluorescence. One or two photomultiplier (PMT) modules (H5784-02; Hamamatsu Photonics, Hamamatsu, Japan) were used for single or dual channel photometry, respectively. The output from each PMT module and from the TEVC amplifier was digitized and stored using an A/D converter (1322A; Axon Instruments, CA, USA) and pCLAMP8 software (Axon Instruments). For dual channel photometry in the measurement of Förster resonance energy transfer (FRET), fluorescence output at the IX70 side-port was split using a dichroic mirror, band-pass filtered, and delivered to the donor and acceptor channel PMT modules. The optical filters used were shown in Supplemental Fig. 2.
Voltage-clamp and photometry in mammalian cells
For recording, cells from the human embryonic kidney cell line HEK293 were transfected with Lipofectamine 2000 reagent (Invitrogen). Recordings were made after 23–30 h post transfection. Three to six hours before recording, cells were subjected to gentle mechanical dissociation and then replated on glass-bottomed dishes to prepare isolated, single cells. Primary hippocampal neurons were prepared from Wistar rats on embryonic day 17 as described previously (Kondo et al. 2000). Briefly, pregnant rats were deeply anaesthetized with isoflurane and decapitated. The uteri were removed and placed in cold PBS. The dissociated neurons were obtained by digesting hippocampus with 10 U/mL papain in Earle's balanced salt solution (EBSS, Gibco, NY, USA) for 20 min at 32 °C followed by the brief treatment with 0.001% DNaseI in Dulbecco's modified Eagle's medium (DMEM, Wako, Kyoto, Japan) and mechanical tritulation through Pasteur pipettes. Neurons were plated (2 × 10⁵ cells/cm2) on poly-l-lysine coated coverslips (diameter = 18 mm, Matsunami, Osaka, Japan). We used 32 embryos from 4 rats including those for the pilot experiments. Transfection was performed at 6–8 days in vitro (DIV6–8) using calcium phosphate methods as previously described (Xia et al. 1996). Neurons were recorded at DIV8–10 using an inverted microscope (IX71; Olympus) equipped with a quick-change imaging chamber (RC-41LP; Warner Instruments) as well as a temperature controller (QE-1RC; Warner Instruments). Whole-cell patch clamp recordings were made using an Axopatch 200B patch clamp amplifier (Axon Instruments). Hepes-buffered artificial cerebrospinal fluid (in mm): NaCl 120, KCl 2.5, MgSO4 1.5, CaCl2 2.0, NaHCO3 26, NaH2PO4 1.1, dextrose 10, and Hepes 15 (pH 7.4) was used as bath solution. The pipette solution contained (in mm): NaCl 5, KCl 10, Hepes 10, KOH 130, MgATP 2.5, Na2GTP 0.3 and EGTA 1 (pH adjusted to 7.3 with methanesulfonic acid). To perform single cell photometry, an octagonal region (∼2330 μm2) clipping around a cell was selectively illuminated via a field stop in the excitation light path, and the emitted fluorescence was delivered to the PMT modules (H7422-40; Hamamatsu Photonics). The current output was then passed to a transimpedance amplifier (C7319; Hamamatsu Photonics) before digitization (1440A; Axon Instruments). To study the optical response of Mermaid2 to well-defined trains of action potentials, we delivered an action potential waveform recorded from a rat dorsal root ganglion neuron as a voltage command. The peak amplitude and half-width of the action potentials were 115 mV and 2.1 ms, respectively. Clampex and Clampfit software (Axon Instruments) were used for data acquisition and analysis, respectively. The optical filters used were shown in Supplemental Fig. 2.
Long-term expression
To evaluate the effects of long-term (>4 weeks) expression of Mermaid and Mermaid2 in various cell lines, these genes were subcloned into pEB6SRmcs vector, an Epstein–Barr virus-based plasmid carrying a mini-oriP (Tanaka et al. 1999) which was a kind gift from Dr Miwa (Tsukuba Univ.). The vector enables stable expression via an episomally replicating system. The expression level obtained with the vector seems to be milder more constant when compared to pCS2+ vector. HEK, Cos7, Neuro2A and RAW cells were transfected with the plasmids and then cultured in Dulbecco's modified Eagle's medium supplemented with 10% fetal bovine serum and 0.8 mg ml−1 G418. Neurons were prepared as for the photometry experiments, and transfected using pCS2+ vector. Subcellular localization of probes was observed using a laser-scanning microscope (LSM-510, Carl Zeiss, Jena, Germany) equipped with an Ar laser (488 nm).
Imaging experiments in mice
cDNA encoding Mermaid2 was subcloned into a plasmid vector carrying the cytomegalovirus enhancer and β-actin promoter, woodchuck hepatitis virus post-transcriptional regulatory element and bovine growth hormone poly-adenylation signal (Gray et al. 2006). The embryonic in utero electroporations were performed as previously described (Saito & Nakatsuji, 2001; Saito, 2006; Shimogori & Ogawa, 2008). Eighteen ICR mice of both sexes were used. Briefly, pregnant ICR mice (Japan SLC) were anesthetized by intraperitoneal injection of sodium pentobarbital (∼50 mg/kg), the abdominal skin and muscle were cut open, and the uterus horns were exposed on a heating pad (BWT-100, BRC, Nagoya, Japan). Approximately 1 ml of purified plasmid solution (2 μg/μl in phosphate buffer solution (PBS), with 0.02% Fast Green (Sigma)) was pressure-injected (IM-300, Narishige, Tokyo, Japan) into the lateral ventricle of each embryo, and 5 electrical pulses (45 V, 50 ms duration at 1 Hz) were delivered through the uterine wall using a tweezer-type electrode (CUY650-P5, Nepa gene, Chiba, Japan) connected to an electroporator (CUY21-EDIT, Nepa gene). After electroporation, the embryos were carefully replaced into the abdominal cavity, and the muscle and skin were sutured. The electroporated mice were subjected to the preparation on postnatal days 21–28. The preparation for transcranial imaging in the auditory cortex was carried out as described previously (Takahashi et al. 2006). Briefly, mice were deeply anaesthetized by intraperitoneal injection of urethane (1.65 g/kg). Following subcutaneous injection of bupivacaine, the skin covering the skull was incised and the temporal muscle over the right auditory cortex was removed. A metal piece was attached to the skull with dental resin, via which the head was fixed onto a manipulator. The exposed surface of the skull was coated with liquid paraffin to maintain transparency. Rectal temperature was kept at 38 °C with a heating pad. Out of the 18 mice, sufficient probe expression in the auditory cortex was observed in six mice, which were subject to transcranial FRET imaging. Our setup consisted of a macro zoom fluorescence microscope (MVX; Olympus) equipped with a ×2 plan apochromat objective lens, a stable 75 W xenon lamp (UXL-S75XB; Ushio) and two cooled charge-coupled device (CCD) cameras (Orca-R2; Hamamatsu Photonics). After passage through a tube lens, the fluorescence was split using a dichroic mirror to acquire donor and acceptor images simultaneously. The two CCD cameras were operated using two separate PCs, and were start-triggered by an electric pulse. The time delays in the two cameras were measured using a pulsing light-emitting diode and were found to be less than 0.1 ms. CCDs were exposed for 30 ms frame−1, and the total acquisition rate was 30.04 frames s−1. Amplitude-modulated tones were generated by multiplying a carrier wave at 5 or 20 kHz with a modulation wave at 20 Hz, and were delivered to mice via an electrostatic speaker (SR307; STAX) at a sound pressure level (SPL) of 60 dB. Duration was 250 ms. Image data were analysed using IDL (Research Systems, CO, USA) and ImageJ (NIH) software. Experimental animals were used in compliance with the policies and regulations of The Journal of Physiology as described by Drummond (2009) as well as with the institutional guidelines for the care of animals provided by Osaka University and RIKEN.
Results
Development of an improved voltage probe, Mermaid2
We previously developed a genetically encoded voltage probe, Mermaid (Tsutsui et al. 2008), in which a green/orange FRET pair was placed at the C-terminal end of the fourth segment (S4) of the voltage sensor domain derived from Ci-VSP (Murata et al. 2005). In our attempts to engineer an enhanced version of Mermaid, we have explored different methods of tagging Mermaid with other fluorescence reporters. In particular, we placed mUKG and mKOκ, which are green- and orange-emitting fluorescent proteins, at the N-terminal end of S1 and the C-terminal end of S4 as a FRET donor and acceptor, respectively (Fig. 1A), to obtain Mermaid2β, which showed fine membrane expression in Xenopus oocytes and exhibited a robust ratio change that reached 93.3 ± 1.9% (mean ± SD; n= 6 cells) upon maximum depolarization (Fig. 1B). This response is more than twice as large as the response of Mermaid (Fig. 1G). Additionally, the kinetics of the optical response also improved (Fig. 1H and I). However, in HEK293 cells, Mermaid2β tended to induce the formation of highly fluorescent granular structures (Fig. 1C), which may interfere with the measurement of plasma-membrane signals at low magnification. Presumably, the granule formation resulted from the resistance of mUKG and mKOκ to proteolysis in endosomes/lysosomes, which is seen with many coral-derived fluorescent proteins (Katayama et al. 2008). To increase the versatility of the probe, we therefore tried to substitute CFP and yellow fluorescent protein (YFP) for mUKG and mKOκ, respectively, and named the new probe Mermaid2 (Fig. 1D).
Figure 1. Development of Mermaid2.

A, schematic representation of the structure of Mermaid2β.B, representative acceptor (mKOκ) and donor (mUKG) signals as well as their ratio (acceptor/donor) for Mermaid2β elicited by voltage steps in Xenopus oocytes. C, image of HEK293 cells expressing Mermaid2β, acquired using an epifluorescence microscope at approximately 24 h post-transfection. Arrows indicate some of the granular structures. Scale bar = 10 μm. D, schematic representation of the structure of Mermaid2.E, representative acceptor (YFP) and donor (CFP) signals as well as their ratio (acceptor/donor) for Mermaid2. F, HEK293 cells expressing Mermaid2 at approximately 24 h post-transfection. Scale bar = 10 μm. G, steady-state ratiometric changes in Xenopus oocytes, obtained using the voltage probes Mermaid (n= 4 cells), Mermaid2β (n= 6 cells) and Mermaid2 (n= 5 cells) as a function of voltage. The data for Mermaid are from an earlier study (Tsutsui et al. 2008). H and I, the responses of these probes to voltage steps from −100 mV to +40 mV were normalized and superimposed. The boxed region in H was expanded in I.
Mermaid2 showed proper targeting to the plasma membrane in HEK293 cells (Fig. 1F), and we found that the N-terminal flanking region of CFP, which is derived from the N-terminal sequence of the original Ci-VSP, was essential for membrane targeting (Supplemental Fig. 3). Voltage-clamp photometry in Xenopus oocytes showed that while this replacement of fluorescent proteins reduced the maximum ratiometric response to some extent (Fig. 1E and G), it had the unanticipated effect of further improving the kinetics (Fig. 1E, H and I). The maximum ratio response of Mermaid2 reached 70.4 ± 2.0% (n= 6 cells) in Xenopus oocytes (Fig. 1G). The results of the quantitative analysis of Mermaid2 responses in oocytes are summarized in Supplemental Fig. 4.
To determine the contribution of FRET to the optical signals of Mermaid2, we then measured responses in two chromophore-deficient mutants, in which the chromophore formation of either CFP or YFP was blocked (Merm2_CFPnull and Merm2_YFPnull; Fig. 2A and B). Only negligible responses were observed for both of these mutants (Fig. 2C–F), which suggests that the change in FRET efficiency, rather than the direct modulation of CFP and/or YFP fluorescence, is the major factor that contributes to the voltage-dependent optical signals.
Figure 2. Optical responses in chromophore-deficient mutants.

A, schematic representation of Merm2_CFPnull, in which the formation of the CFP chromophore was blocked by mutating the tryptophan within the chromophore-forming tripeptide (Ser65-Trp66-Gly67) into glycine. The numbering of the amino acids is based on the conventional numbering in Aequoria victoria GFP variants. B, similarly, Merm2_YFPnull carries the chromophore-deficient Y66G mutation within YFP. C, representative YFP signals in response to voltage steps in Merm2_CFPnull. D, representative CFP signals in Merm2_YFPnull. E, a plot showing steady-state YFP signals versus voltage in Merm2 (open circles; n= 5 cells) and in Merm2_CFPnull (filled squares; n= 6 cells). F, steady-state CFP signals versus voltage in Merm2 (open circles; n= 5 cells) and in Merm2_YFPnull (filled squares; n= 6 cells).
In Mermaid, the formation of intracellular fluorescent granules is generally less noticeable at time points soon after transfection but becomes significant after long-term expression (Akemann et al. 2010), possibly because of proteolytic resistance of the FRET reporter (Katayama et al. 2008). We therefore compared the effects of long-term (17–30 days) expression of Mermaid with that of Mermaid2 on the formation of granules by using cell lines (HEK293, Cos7, Neuro2A, and Raw cells) and primary cultures of rat hippocampal neurons, which revealed that Mermaid2 had a significantly reduced tendency for granule formation in common when compared with Mermaid (Fig. 3).
Figure 3. Long-term expression of Mermaid and Mermaid2 in cell lines and neurons.

Images show single optical sections acquired using a confocal microscope, except for the neurons for which projection images are shown in the main panels and optical sections at the soma are shown in the insets. Arrows indicate some of the granular structures formed after long-term expression. Scale bars = 20 μm.
Detection of electrical activity in mammalian cells by using Mermaid2
The performance of Mermaid2 was then evaluated using voltage-clamped HEK293 cells at approximately 33°C. Figure 4A shows representative responses to single-trial voltage steps in a single cell. The maximum steady-state ratiometric response (ΔR/R; R = acceptor/donor) of Mermaid2 in HEK293 cells reached 53.5 ± 2.8% (n= 6 cells; Fig. 4B). For a 100 mV depolarization from –70 mV to +30 mV, ΔR/R was 48.5 ± 3.5%. Mermaid2 exhibited significantly faster responses in mammalian cells than in Xenopus oocytes as was previously observed for Mermaid (Tsutsui et al. 2008). The on-responses upon depolarization were fitted well by a double exponential function (Fig. 4C), which may reflect the multi-step conformational rearrangement in the VSD transition (Kohout et al. 2008). Remarkably, a sub-millisecond time constant was obtained for the fast component at +50 mV (0.93 ± 0.21 ms, n= 6 cells; Fig. 4D). The fractions for the fast component ranged from 55% to 79% (Fig. 4E). In contrast, off-responses upon hyperpolarization showed single exponential decay (Fig. 4C) with time constants similar to those of the slow components of the on-responses (Fig. 4D).
Figure 4. Responses of Mermaid2 in HEK293 cells.
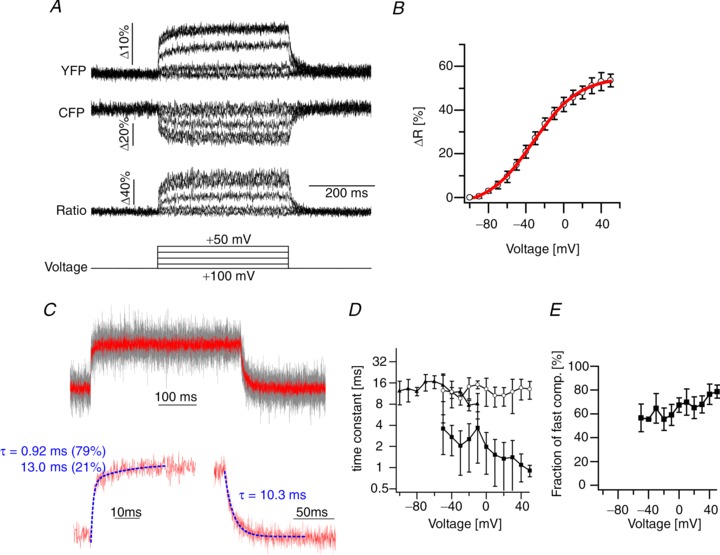
A, representative YFP and CFP signals as well as their ratio (YFP/CFP) elicited by voltage steps in HEK293 cells (∼33°C). Responses in single trials in a single voltage-clamped cell are shown. Data were low-pass filtered at 0.7 kHz. B, steady-state ratio response versus membrane voltage in HEK293 cells (open circles, n= 5; continuous line, Boltzmann's function fit, Vmid=−32 mV, the effective charge valence (Zd) = 1.05). C, top traces show superimposed normalized YFP signals from 5 different cells (in grey) and their average in response to the voltage step from −100 mV to +50 mV. Note that data were not filtered offline to perform the kinetic analysis. Examples of fits for the on- and off-responses with double and single exponential functions are shown at the bottom. D, voltage dependence of the time constants for activation (fast component, filled squares; slow component, open circles; n= 5 cells) and deactivation (filled triangles; n= 5 cells). Notably, a sub-millisecond activation time constant was obtained in HEK cells at +50 mV (0.93 ± 0.21 ms). E, fraction of the fast component for the activation time constants plotted as a function of voltage (n= 5 cells).
To evaluate the performance of Mermaid2 for detecting action potentials, spike-train waveforms generated from a dorsal root ganglion neuron's impulses were applied as the voltage commands to a patch-clamped cell. We analysed YFP channel signal since the CFP channel is dimmer and the rationing seemed to enhance the noise level in this situation (Wilt et al. 2013). With Mermaid, it was only possible to detect each spike event up to a firing rate of 50 Hz (Tsutsui et al. 2008), but Mermaid2 enabled reliable detection of individual spikes at a firing rate of up to 150 Hz in single trials (Fig. 5A). A frequency of 200 Hz was close to or slightly over the limit for resolving individual spikes, but a power spectrum analysis of the ratio responses showed well-resolved spectral components up to this frequency (Fig. 5B). When the time lag of Mermaid2's voltage-dependent optical responses at four different firing rates was defined as a time delay maximizing the cross-correlations between the optical signals and voltages, the measured lags were less than 1 ms (Fig. 5B). For comparison, we performed similar experiments with the ArcLight-A242 probe (Jin et al. 2012). ArcLight-A242 detected an isolated single spike as a robust decrease in fluorescence (Supplemental Fig. 5). However, its responses to individual spikes within a train of action potentials were typically buried in the slow signal component and were difficult to resolve at higher frequencies (≥100 Hz). These observations demonstrate an advantage of the fast kinetics of Mermaid2 in detecting fast electrical activity. We also found that Mermaid2 successfully detected another action potential waveform that simulated a faster spike (Supplemental Fig. 6). We then expressed Mermaid2 in rat hippocampal neurons, and simultaneous photometry and current-clamp recordings were performed to evaluate its versatility in actual neurons (Fig. 6A). Mermaid2 enabled detection of action potentials evoked by current injection as well as slow subthreshold voltage changes in single trials (Fig. 6B). The fractional fluorescence change (ΔF) in the acceptor channel for 46 action potentials recorded in 11 neurons ranged from 2.1% to 4.1% (2.57 ± 0.54%; mean ± SD).
Figure 5. Responses of Mermaid2 to simulated spike trains.

A, representative responses of Mermaid2 to voltage commands consisting of spike trains at four different frequencies (50–200 Hz). Each trace represents a single trial (not time-averaged data) from a single cell. Data were low-pass filtered offline at 0.7 kHz to reduce noise. B, analysis of responses of Mermaid2 to the spike trains. Blue, green, purple and red plots represent the power spectra of the responses to action potential trains with frequencies of 50, 100, 150 and 200 Hz, respectively. Data from 6 cells are superimposed, and the thick lines represent averages. Filled squares (top) represent the time lag for the Mermaid2 response at each spike frequency, measured by cross-correlating the Mermaid2 response with the voltage command.
Figure 6. Detection of single-trial neuronal electrical activity by using Mermaid2 in vitro.
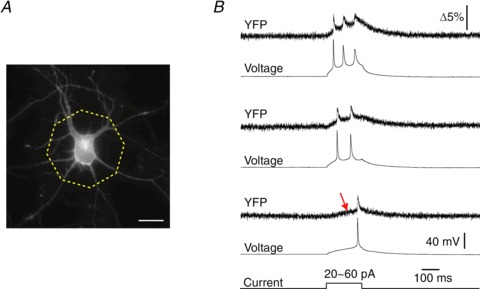
A, representative epifluorescence microscopy showing a hippocampal neuron expressing Mermaid2 at DIV10. Scale bar = 20 μm. The octagonal region shows the illumination spot for single-cell photometry. B, representative simultaneous photometry and current-clamp recordings and response in a primary hippocampal neuron. The neuron was injected with a constant current of 20 (bottom), 40 (middle), or 60 pA (top) to evoke one, two and three action potentials, respectively. Note that a subthreshold event was also detected (arrow). The resting potential was −64 mV.
Finally, to validate the utility of Mermaid2 in vivo, it was expressed in the auditory cortex of mice by using embryonic electroporation. On postnatal days 21–28, transcranial imaging was performed from the primary auditory cortex while delivering a stimulus consisting of a 5 kHz or 20 kHz tone (60 dB SPL; Fig. 7A). Mermaid2 responded with an appreciable ratio change (3.23 ± 0.20% for 5 kHz, 3.34 ± 0.09% for 20 kHz; n= 6 mice), and the tonotopic organization was visualized in single-trial measurements (Fig. 7B and C; Supplemental movies 1 and 2), which demonstrates the potential for Mermaid2 to serve as a sensitive biosensor for analysing dynamic electrical signalling in excitable cells, tissues and organs.
Figure 7. Cortical responses to auditory stimuli detected using Mermaid2 in vivo.
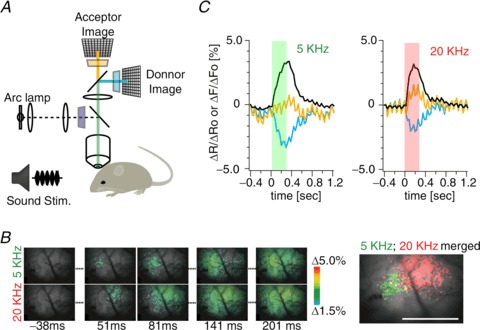
A, schematic diagram showing the setup for transcranial FRET imaging of cortical surface fluorescence in vivo. Sound stimuli (5 kHz or 20 kHz tones) were delivered to the mice by using an electrostatic speaker, and the primary auditory cortex of the right hemisphere was simultaneously imaged. B: left, pseudocoloured images of the ratiometric response of Mermaid2 to tonal stimuli at 5 kHz and 20 kHz (60 dB SPL); right, regions that showed >2% ratio changes during stimulation are highlighted in green and red for responses to 5 kHz and 20 kHz tones, respectively, to show the tonotopic organization noted in single-trial measurements, and have been used as regions of interest for the intensity plot in C. Scale bar = 1 mm. Anterior is to the right side. C, representative time courses of the changes in YFP intensity (yellow), CFP intensity (cyan) and their ratio (black). Stimulus periods are colour-shaded. The CFP and YFP signals generally contained substantial common noise, which, however, was cancelled in the ratio. The noise has frequency at ∼650 cycles min−1 and probably comes from the motions associated with heartbeats.
Discussion
Here we report an improved voltage probe, Mermaid2 that provides larger and faster ratiometric readouts than existing probes. In developing Mermaid2, two main modifications were introduced to the original design of Mermaid. First, placement of the FRET donor and acceptor at the N- and C-terminal ends of the VSD, respectively, improved both the kinetics and the maximum amplitude of response (Mermaid2β; Fig. 1G–I). Enhancement of the probe performance by a similar design has also been reported in a recent study on VSFP-Butterfly (Akemann et al. 2012), which, however, still has slower kinetics and lower response amplitude than Mermaid2. It is currently difficult to explain why this particular configuration improved the kinetics and maximum amplitude of the response because the detailed mechanisms underlying the structural rearrangements of the VSD have not yet been resolved and also because FRET is a complex phenomenon that depends on both the distance and orientation between the two fluorophores. Although one possible interpretation may be increased degrees of freedom for the S4-tagged acceptor in Mermaid2 and Mermaid2β relative to that in Mermaid, which has a tandem FRET pair, there also exist other possibilities. In particular, we have recently found that the VSD induces significant structural changes not only in the C-terminal region of S4 but also in the N-terminal region of S1 upon transition (Tsutsui et al. 2013). So it could be possible that the performance of Mermaid2 is also contributed to by such an N-terminal effect. The second modification was the replacement of the mUKG/mKOκ FRET pair with CFP/YFP, which not only decreased the formation of fluorescent granules but also unexpectedly improved the kinetics (Fig. 1). Generally, β-barrel fluorescent proteins contain less-conserved flexible regions in their N- and C-terminals (Ormo et al. 1996; Wall et al. 2000) through which the membrane-spanning segments are thought to affect the positions of the fluorescent proteins upon the structural transition of the VSD. This region may therefore provide a hot spot for future optimization of the temporal resolution of voltage detection.
Although one of the goals in the development of a protein-based voltage probe is the spatiotemporal analysis of the dynamics of plasma-membrane voltage in a network of excitable cells, membrane voltage measurements in intracellular organelles, which are inaccessible with microelectrodes, would be another important issue in the current physiology. We have shown that the N-terminal flanking region in the original Ci-VSP is involved in efficient targeting to the cell membrane, without which the probe appeared to be distributed both on the cell membrane and endomembrane (Supplemental Fig. 3). Thus, further modification of this region may enable proper targeting to specific organelle membranes, which we plan to address in the near future.
A recently developed voltage probe based on microbial rhodopsin does not rely on the structural transition of the VSD, but rather on the putative voltage-dependent interactions of the Schiff base and local electrochemical potential of protons (Kralj et al. 2012). This probe exhibits a very fast (<0.5 ms) response. Although its non-conductive version, which is preferred for use as a probe, has much slower kinetics and also has a low fluorescence quantum yield (<10−3), there should be room for further improvement through molecular engineering or via exploration of diverse microbial rhodopsins. Great diversity also exists in VSPs, and so we believe that further improvements in VSD-based probes are also still possible.
In summary, through modifications of the previous designs, we have developed an enhanced voltage probe, Mermaid2. The ability to detect electrical activity with faster kinetics and greater sensitivity will expand our chances to analyse electrical events that have been less accessible by using other techniques.
Acknowledgments
We thank Dr Miwa (Univ. of Tsukuba) for the kind gift of pEB6SRmcs vector. We thank Dr Souya (RIKEN), Dr Tsukano and Dr Shibuki (Nigata Univ.) for their valuable advice for mice imaging in vivo. We are also grateful to Dr M. Ishikawa for kind help in preparing figures.
Glossary
- CFP
cyan fluorescent protein
- Ci-VSP
Ciona intestinalis
- DIV
days in vitro
- FRET
Förster resonance energy transfer
- GFP
green fluorescent protein
- PMT
photomultiplier
- SPL
sound pressure level
- TEVC
two-electrode voltage-clamp
- VSD
voltage-sensor domain
- VSP
voltage-sensing phosphatase
- YFP
yellow fluorescent protein
Additional information
Competing interests
None declared.
Author contributions
All the experiments, except for the mice imaging, were carried out in the Laboratory of Integrative Physiology, Graduate School of Medicine, Osaka University, Japan. Imaging experiments in mice were performed in the Laboratory for Cell Function Dynamics, Brain Science Institute, RIKEN, Japan. The contribution of each author was as follows: conception and design of the experiments, H.T.; collection, analysis and interpretation of data, H.T., Y.J., A.T., Y.N. and Y.Y.; drafting the article, H.T. and Y.O.; revising the article critically for important intellectual content, H.T., Y.Y., K.M., A.M. and Y.O. All authors approved the final version of the manuscript.
Funding
This work was supported by grants from MEXT (H.T. and Y.O.), JST-PRESTO (H.T.) and HFSP (Y.O.).
Supplementary material
Supplemental Fig. 1
Supplemental Fig. 2
Supplemental Fig. 3
Supplemental Fig. 4
Supplemental Fig. 5
Supplemental Fig. 6
Supplemental movies 1 and 2
References
- Akemann W, Mutoh H, Perron A, Rossier J, Knopfel T. Imaging brain electric signals with genetically targeted voltage-sensitive fluorescent proteins. Nat Methods. 2010;7:643–649. doi: 10.1038/nmeth.1479. [DOI] [PubMed] [Google Scholar]
- Akemann W, Mutoh H, Perron A, Park YK, Iwamoto Y, Knopfel T. Imaging neural circuit dynamics with a voltage-sensitive fluorescent protein. J Neurophysiol. 2012;108:2323–2337. doi: 10.1152/jn.00452.2012. [DOI] [PubMed] [Google Scholar]
- Ataka K, Pieribone VA. A genetically targetable fluorescent probe of channel gating with rapid kinetics. Biophys J. 2002;82:509–516. doi: 10.1016/S0006-3495(02)75415-5. [DOI] [PMC free article] [PubMed] [Google Scholar]
- Baker BJ, Jin L, Han Z, Cohen LB, Popovic M, Platisa J, Pieribone V. Genetically encoded fluorescent voltage sensors using the voltage-sensing domain of Nematostella and Danio phosphatases exhibit fast kinetics. J Neurosci Methods. 2012;208:190–196. doi: 10.1016/j.jneumeth.2012.05.016. [DOI] [PMC free article] [PubMed] [Google Scholar]
- Baker BJ, Lee H, Pieribone VA, Cohen LB, Isacoff EY, Knopfel T, Kosmidis EK. Three fluorescent protein voltage sensors exhibit low plasma membrane expression in mammalian cells. J Neurosci Methods. 2007;161:32–38. doi: 10.1016/j.jneumeth.2006.10.005. [DOI] [PubMed] [Google Scholar]
- Barnett L, Platisa J, Popovic M, Pieribone VA, Hughes T. A fluorescent, genetically-encoded voltage probe capable of resolving action potentials. PLoS One. 2012;7:e43454. doi: 10.1371/journal.pone.0043454. [DOI] [PMC free article] [PubMed] [Google Scholar]
- Dimitrov D, He Y, Mutoh H, Baker BJ, Cohen L, Akemann W, Knopfel T. Engineering and characterization of an enhanced fluorescent protein voltage sensor. PLoS One. 2007;2:e440. doi: 10.1371/journal.pone.0000440. [DOI] [PMC free article] [PubMed] [Google Scholar]
- Drummond GB. Reporting ethical matters in The Journal of Physiology: standards and advice. J Physiol. 2009;587:713–719. doi: 10.1113/jphysiol.2008.167387. [DOI] [PMC free article] [PubMed] [Google Scholar]
- Goldin AL. Maintenance of Xenopus laevis and oocyte injection. Methods Enzymol. 1992;207:266–279. doi: 10.1016/0076-6879(92)07017-i. [DOI] [PubMed] [Google Scholar]
- Gray NW, Weimer RM, Bureau I, Svoboda K. Rapid redistribution of synaptic PSD-95 in the neocortex in vivo. PLoS Biol. 2006;4:e370. doi: 10.1371/journal.pbio.0040370. [DOI] [PMC free article] [PubMed] [Google Scholar]
- Grinvald A, Hildesheim R. VSDI: a new era in functional imaging of cortical dynamics. Nat Rev Neurosci. 2004;5:874–885. doi: 10.1038/nrn1536. [DOI] [PubMed] [Google Scholar]
- Jin L, Han Z, Platisa J, Wooltorton JR, Cohen LB, Pieribone VA. Single action potentials and subthreshold electrical events imaged in neurons with a fluorescent protein voltage probe. Neuron. 2012;75:779–785. doi: 10.1016/j.neuron.2012.06.040. [DOI] [PMC free article] [PubMed] [Google Scholar]
- Katayama H, Yamamoto A, Mizushima N, Yoshimori T, Miyawaki A. GFP-like proteins stably accumulate in lysosomes. Cell Struct Funct. 2008;33:1–12. doi: 10.1247/csf.07011. [DOI] [PubMed] [Google Scholar]
- Hille B. Ion Channels of Excitable Membranes. MA, USA: Sinauer; 2001. [Google Scholar]
- Kohout SC, Ulbrich MH, Bell SC, Isacoff EY. Subunit organization and functional transitions in Ci-VSP. Nat Struct Mol Biol. 2008;15:106–108. doi: 10.1038/nsmb1320. [DOI] [PubMed] [Google Scholar]
- Kondo M, Okabe S, Sumino R, Okado H. A high GluR1:GluR2 expression ratio is correlated with expression of Ca2+-binding proteins in rat forebrain neurons. Eur J Neurosci. 2000;12:2812–2822. doi: 10.1046/j.1460-9568.2000.00167.x. [DOI] [PubMed] [Google Scholar]
- Kralj JM, Douglass AD, Hochbaum DR, Maclaurin D, Cohen AE. Optical recording of action potentials in mammalian neurons using a microbial rhodopsin. Nat Methods. 2012;9:90–95. doi: 10.1038/nmeth.1782. [DOI] [PMC free article] [PubMed] [Google Scholar]
- Lam AJ, St-Pierre F, Gong Y, Marshall JD, Cranfill PJ, Baird MA, McKeown MR, Wiedenmann J, Davidson MW, Schnitzer MJ, Tsien RY, Lin MZ. Improving FRET dynamic range with bright green and red fluorescent proteins. Nat Methods. 2012;9:1005–1012. doi: 10.1038/nmeth.2171. [DOI] [PMC free article] [PubMed] [Google Scholar]
- Matsuda T, Miyawaki A, Nagai T. Direct measurement of protein dynamics inside cells using a rationally designed photoconvertible protein. Nat Methods. 2008;5:339–345. doi: 10.1038/nmeth.1193. [DOI] [PubMed] [Google Scholar]
- Murata Y, Iwasaki H, Sasaki M, Inaba K, Okamura Y. Phosphoinositide phosphatase activity coupled to an intrinsic voltage sensor. Nature. 2005;435:1239–1243. doi: 10.1038/nature03650. [DOI] [PubMed] [Google Scholar]
- Ogden D, editor. Microelectrode Techniques: The Plymouth Workshop Handbook. 2nd edn. Cambridge, UK: Company of Biologists Limited; 1994. [Google Scholar]
- Ormo M, Cubitt AB, Kallio K, Gross LA, Tsien RY, Remington SJ. Crystal structure of the Aequorea victoria green fluorescent protein. Science. 1996;273:1392–1395. doi: 10.1126/science.273.5280.1392. [DOI] [PubMed] [Google Scholar]
- Perron A, Mutoh H, Launey T, Knopfel T. Red-shifted voltage-sensitive fluorescent proteins. Chem Biol. 2009;16:1268–1277. doi: 10.1016/j.chembiol.2009.11.014. [DOI] [PMC free article] [PubMed] [Google Scholar]
- Saito T. In vivo electroporation in the embryonic mouse central nervous system. Nat Protoc. 2006;1:1552–1558. doi: 10.1038/nprot.2006.276. [DOI] [PubMed] [Google Scholar]
- Saito T, Nakatsuji N. Efficient gene transfer into the embryonic mouse brain using in vivo electroporation. Dev Biol. 2001;240:237–246. doi: 10.1006/dbio.2001.0439. [DOI] [PubMed] [Google Scholar]
- Sakai R, Repunte-Canonigo V, Raj CD, Knopfel T. Design and characterization of a DNA-encoded, voltage-sensitive fluorescent protein. Eur J Neurosci. 2001;13:2314–2318. doi: 10.1046/j.0953-816x.2001.01617.x. [DOI] [PubMed] [Google Scholar]
- Sawano A, Miyawaki A. Directed evolution of green fluorescent protein by a new versatile PCR strategy for site-directed and semi-random mutagenesis. Nucleic Acids Res. 2000;28:E78. doi: 10.1093/nar/28.16.e78. [DOI] [PMC free article] [PubMed] [Google Scholar]
- Shimogori T, Ogawa M. Gene application with in utero electroporation in mouse embryonic brain. Dev Growth Differ. 2008;50:499–506. doi: 10.1111/j.1440-169X.2008.01045.x. [DOI] [PubMed] [Google Scholar]
- Siegel MS, Isacoff EY. A genetically encoded optical probe of membrane voltage. Neuron. 1997;19:735–741. doi: 10.1016/s0896-6273(00)80955-1. [DOI] [PubMed] [Google Scholar]
- Takahashi K, Hishida R, Kubota Y, Kudoh M, Takahashi S, Shibuki K. Transcranial fluorescence imaging of auditory cortical plasticity regulated by acoustic environments in mice. Eur J Neurosci. 2006;23:1365–1376. doi: 10.1111/j.1460-9568.2006.04662.x. [DOI] [PubMed] [Google Scholar]
- Tanaka J, Miwa Y, Miyoshi K, Ueno A, Inoue H. Construction of Epstein-Barr virus-based expression vector containing mini-oriP. Biochem Biophys Res Commun. 1999;264:938–943. doi: 10.1006/bbrc.1999.1617. [DOI] [PubMed] [Google Scholar]
- Tsutsui H, Higashijima S, Miyawaki A, Okamura Y. Visualizing voltage dynamics in zebrafish heart. J Physiol. 2010;588:2017–2021. doi: 10.1113/jphysiol.2010.189126. [DOI] [PMC free article] [PubMed] [Google Scholar]
- Tsutsui H, Karasawa S, Okamura Y, Miyawaki A. Improving membrane voltage measurements using FRET with new fluorescent proteins. Nat Methods. 2008;5:683–685. doi: 10.1038/nmeth.1235. [DOI] [PubMed] [Google Scholar]
- Tsutsui H, Jinno Y, Tomita A, Okamura Y. Optically detected structural change in the N-terminal region of the voltage-sensor domain. Biophys J. 2013;105:108–115. doi: 10.1016/j.bpj.2013.05.051. [DOI] [PMC free article] [PubMed] [Google Scholar]
- Wall MA, Socolich M, Ranganathan R. The structural basis for red fluorescence in the tetrameric GFP homolog DsRed. Nat Struct Biol. 2000;7:1133–1138. doi: 10.1038/81992. [DOI] [PubMed] [Google Scholar]
- Wilt BA, Fitzgerald JE, Schnitzer MJ. Photon shot noise limits on optical detection of neuronal spikes and estimation of spike timing. Biophys J. 2013;104:51–62. doi: 10.1016/j.bpj.2012.07.058. [DOI] [PMC free article] [PubMed] [Google Scholar]
- Xia Z, Dudek H, Miranti CK, Greenberg ME. Calcium influx via the NMDA receptor induces immediate early gene transcription by a MAP kinase/ERK-dependent mechanism. J Neurosci. 1996;16:5425–5436. doi: 10.1523/JNEUROSCI.16-17-05425.1996. [DOI] [PMC free article] [PubMed] [Google Scholar]
Associated Data
This section collects any data citations, data availability statements, or supplementary materials included in this article.