

Abstract
Malignant hyperthermia (MH) is linked to mutations in the type 1 ryanodine receptor, RyR1, the Ca2+ channel of the sarcoplasmic reticulum (SR) of skeletal muscle. The Y522S MH mutation was studied for its complex presentation, which includes structurally and functionally altered cell ‘cores’. Imaging cytosolic and intra-SR [Ca2+] in muscle cells of heterozygous YS mice we determined Ca2+ release flux activated by clamp depolarization, permeability (P) of the SR membrane (ratio of flux and [Ca2+] gradient) and SR Ca2+ buffering power (B). In YS cells resting [Ca2+]SR was 45% of the value in normal littermates (WT). P was more than doubled, so that initial flux was normal. Measuring [Ca2+]SR(t) revealed dynamic changes in B(t). The alterations were similar to those caused by cytosolic BAPTA, which promotes release by hampering Ca2+-dependent inactivation (CDI). The [Ca2+] transients showed abnormal ‘breaks’, decaying phases after an initial rise, traced to a collapse in flux and P. Similar breaks occurred in WT myofibres with calsequestrin reduced by siRNA; calsequestrin content, however, was normal in YS muscle. Thus, the Y522S mutation causes greater openness of the RyR1, lowers resting [Ca2+]SR and alters SR Ca2+ buffering in a way that copies the functional instability observed upon reduction of calsequestrin content. The similarities with the effects of BAPTA suggest that the mutation, occurring near the cytosolic vestibule of the channel, reduces CDI as one of its primary effects. The unstable SR buffering, mimicked by silencing of calsequestrin, may help precipitate the loss of Ca2+ control that defines a fulminant MH event.
Key points
Malignant Hyperthermia (MH) affects the Ca2+ movements that control muscle contraction. We measured Ca2+ movements in skeletal muscle of “Y522S” mice, with a tyrosine-to-serine mutation in the RyR channel that causes MH in mice and humans.
In YS cells, [Ca2+] inside the Ca2+ store (sarcoplasmic reticulum, SR) was 45% of that in the wild type (WT), but the SR membrane permeability increased 2-fold, resulting in Ca2+ release of initially normal value.
During Ca2+release, cytosolic [Ca2+] and SR Ca2+ buffering power evolved differently in YS and WT. These variables became similar in WT exposed to BAPTA, an inhibitor of Ca2+-dependent inactivation (CDI) of the RyR, suggesting that tyrosine 522 is involved in CDI.
Similar paradoxical observations in YS and WT cells with reduced content of the SR protein calsequestrin, revealed the importance of balance between SR Ca permeability (increased in YS) and storage capability (decreased when calsequestrin is low).
Introduction
Excitation–contraction coupling involves a finely controlled sequence of rapid Ca2+ movements that start with Ca2+ release from the sarcoplasmic reticulum (SR) and then involves every organelle in the muscle cell. These movements are controlled by at least five proteins (DHPR dihydropiridine receptor, RyR, triadin, junctin and calsequestrin) that constitute a physically connected chain, which we call the couplon (a term introduced by Stern et al. 1997, referring initially to the voltage sensors and calcium release channels on one side of a skeletal muscle triad). Alterations of the skeletal muscle couplon at various levels, including mutations of the DHPR (Eltit et al. 2012), the RyR (MacLennan & Zvaritch, 2011), and deletion of calsequestrin (as reviewed by Protasi et al. 2011), may result in malignant hyperthermia (MH: MIM no. 145600), a subclinical disorder characterized by a fulminant and potentially lethal hypermetabolic reaction to inhalational anaesthetics and succinylcholine (MacLennan & Zvaritch, 2011).
Strikingly parallel is the situation in cardiac muscle, given the linkage of many mutations in ryanodine receptor 2 (RyR2), a few in calsequestrin 2 (Priori & Chen, 2011) and at least one in triadin (Roux-Buisson et al. 2012) with catecholaminergic polymorphic ventricular tachycardia (CPVT), a potentially lethal dysrhythmia, analogous to MH in producing uncontrolled events of Ca2+ release (Priori & Chen, 2011). These associations, valid for both types of striated muscle, promote a unifying view of pathogenesis, showing that similar syndromes may arise from defects in different members of the chain of proteins that control Ca2+ release.
Seventy per cent of the cases of MH have defects in the ryanodine receptor 1 gene RyR1, and some 300 mutations of RyR1 have been linked to MH and/or the related central core disease (CCD). Similarly, nearly 200 mutations in RyR2 are linked to CPVT. Among these mutations, many are concentrated in highly conserved regions or ‘hotspots’, largely homologous in RyR1 and RyR2. While the identification and further study of these mutants is primarily driven by the need to understand and prevent or alleviate the associated diseases, the study of the well-defined functional defects associated with each mutation is becoming a useful approach to unravel structure–function relationships in these large and complex channels.
Several mice have been created with RyR1 mutations homologous to those associated with MH in humans (Yang et al. 2006; Chelu et al. 2006; Yuen et al. 2012). All show a MH-like hypermetabolic response to volatile anaesthetics and temperature. Among them, the Y524S mice (Y522S in humans) appear to be the most sensitive to temperature since they usually do not survive more than 15 min at 37°C (Lanner et al. 2012). The multi-systemic nature of the hypermetabolic response to temperature in the Y524S mice has suggested that they are also models of enhanced susceptibility to heat stroke (Durham et al. 2008; Lanner et al. 2012). In humans the Y522S mutation is also associated with central cores and the Y524S mice develop metabolically inactive cores as they age (Boncompagni et al. 2009). Tyrosine 522 is part of the N-terminal domain (‘hotspot 1’, MacLennan & Zvaritch, 2011) containing a large number of amino acids that are known to be mutated in human MH and CCD. This domain of RyR1 was recently crystallized (Tung et al. 2010) and localized by docking in 3-D cryo-electron microscopy structures (e.g. Samsóet al. 2005).
New insight into the disease processes has been obtained from studies of the YS mice (Durham et al. 2008; Andronache et al. 2009; Boncompagni et al. 2009; Lanner et al. 2012) and other mouse models of malignant hyperthermia (Estéve et al. 2010; Feng et al. 2011; Yuen et al. 2012) and CCD (Zvaritch et al. 2007). Here we apply recently developed techniques to further evaluate the fundamental changes in Ca2+ handling that are caused by the Y524S mutation. The main technical advance is the direct determination of [Ca2+]SR, which takes advantage of the highly specific location of the SR-targeted biosensor D4cpv-calsequestrin (Sztretye et al. 2011a). Combining this measurement with the determination of Ca2+ release flux and amount of released Ca2+, we can for the first time evaluate the permeability of the releasing SR membrane (P, a direct measure of the openness, popen, of the release channels), and Ca2+ buffering power, B, of the SR. [Ca2+]SR, P and B proved to be drastically changed in the YS mutant. Much of the change can be explained if one of the primary consequences of the mutation is the partial or total loss of the susceptibility of the channel to inactivation by cytosolic Ca2+.
Methods
Construction of silencing vectors
The oligonucleotide encoding the specific small interfering (si)RNA for Casq1 was inserted into pSilencer-1.0 vector (Ambion, Austin, TX, USA) downstream of the U6 promoter using ApaI and EcoRI sites as described previously (Wang et al. 2006). To produce fluorescent markers of transfection, enhanced cyan fluorescent protein (ECFP) or enhanced yellow fluorescent protein (EYFP) expression cassettes were inserted downstream of the multiple cloning region at the NotI site using standard procedures. Initially, the enhanced green fluorescent protein (EGFP) cassette from the vector pCMS-EGFP (Clontech Laboratories, Mountain View, CA, USA) was amplified by PCR and inserted into the NotI site of pSilencer-1.0. Subsequently, the EGFP coding region was removed and replaced by the one of ECFP or EYFP using the AgeI and BclI restriction sites. The vectors pECFP-N1 and pEYFP-N1 (Clontech Laboratories) were used as PCR templates.
Immunoblotting
Two slightly different techniques were used for Western blots with different purposes. To compare calsequestrin (Casq) content in Y522S and wild-type muscles, whole soleus, extensor digitorum longus (EDL) and diaphragm muscles from six wild-type (WT) and six Y524S mice were homogenized and lysed in 4°C radioimmunoprecipitation assay (RIPA) buffer with phosphatase and protease inhibitors, consisting of (mm): 25 Tris, 150 NaCl, 1 Na3VO4, 10 NaPyroPO4, 10 β-glycerophosphate, 10 NaF, phenylmethylsulfonyl fluoride (PMSF) protease inhibitor cocktail (Santa Cruz Biotechnology, Dallas, TX, USA), 1% NP40, 1% sodium deoxycholate, and 0.1% sodium dodecyl sulfate. pH was 7.6. Total protein concentration was measured using the BCA protein assay (Thermo Scientific). Equal amounts of total protein from whole muscle lysates were resolved by electrophoresis and then transferred to polyvinylidene difluoride (PVDF) membrane for Western blot analysis. Calsequestrin was identified using anti-calsequestrin 1 antibody MA3-913 (Affinity Bioreagents) at 1:1000 dilution. Glyceraldehyde-3-phosphate dehydrogenase (GADPH; with antibody sc-20357, Santa Cruz Biotechnology, at 1:500 dilution) was used as a control for homogeneous total protein loading. LI-COR IRDye infrared dyes were used as secondary antibodies and immunoreactive bands were visualized using the Odyssey Infrared Imaging System (LI-COR Biosciences).
For evaluation of Casq1 gene silencing in individual flexor digitorum brevis (FDB) muscles, an entire FDB muscle was homogenized at 4°C in RIPA buffer. Total protein concentration was measured using a modified version of the Lowry method (DC Protein Assay; BioRad, Lincoln, NE, USA). Proteins were separated electrophoretically using the SDS-PAGE buffer system. After separation the proteins were transferred electrophoretically to a nitrocellulose membrane and stained for calsequestrin 1 and GAPDH as described above. The protein bands were detected using a chemiluminescent substrate (Super Signal West Dura; Thermoscientific) and horseradish peroxidase-conjugated secondary antibodies.
Transgenic animals
Fourteen mice heterozygous for the Y522S mutation and 10 WT littermates, produced as described by Chelu et al. (2006) were used in these experiments. The animals were raised in Baylor College of Medicine, and studied at Rush University, at 7–15 weeks of age.
Transfection of FDB muscles in adult mice and isolation of single cells
Some of the results reported here were obtained by analysis of data collected in an earlier study of permeability (Sztretye et al. 2011b). In most cases muscles were made to express the biosensor D4cpv-Casq1 (Sztretye et al. 2011a,b). The method of transfection and cell separation was described by Sztretye et al. (2011a). Experiments were performed 4–5 days after injection of plasmid at 20–22°C in ‘External’ solution.
Ethical approval and killing
Protocols for animal care, transfection and killing were approved by the Institutional Animal Care and Use Committee of Rush University, which found them consistent with their ethical standards. Mice (6–14 weeks), of weight between 25 and 37 g, were killed by inhalation of a rising concentration of CO2.
Solutions
‘RIPA buffer’ (mm): 150 NaCl, 10 Tris, 5 EDTA. pH was adjusted to 7.2 with HCl. ‘External’ solution (mm): 140 TEA-CH3SO3, 1 CaCl2, 3.5 MgCl2, 10 Hepes, 1 4-aminopyridine, 0.5 CdCl2, 0.3 LaCl3, 0.001 TTX (citrate), 0.05 N-benzyl-p-toluene sulphonamide (BTS). pH was adjusted to 7.2 with TEA-OH and osmolality to 320 mosmol kg−1 with TEA methanesulfonate.
Internal solutions (in pipette) were either ‘EGTA’ or ‘BAPTA’. ‘EGTA’ (mm): 110 N-methylglucamine, 110 l- glutamic acid, 10 EGTA, 10 Tris, 10 glucose, 5 Na ATP, 5 phosphocreatine Tris, 0.075 X-rhod 1, 3.56 CaCl2 and 7.4 MgCl2. ‘BAPTA’ (mm): 120 potassium l-glutamate, 5 BAPTA, 10 Trizma, 5 Na ATP, 5 phosphocreatine Tris, 5.4 CaCl2, 7.19 MgCl2, 10 glucose. pH was set to 7.2 with NaOH and osmolality to 320 mosmol kg−1 with N-methylglucamine. The amounts of added Ca2+ and Mg2+ were calculated as in Manno et al. (2013).
Voltage clamp
The whole-cell patch clamp technique follows the implementation of Wang et al. (1999), with changes described by Royer et al. (2008). The clamped cells were stable in ‘BAPTA’, as ascertained by the stability of series resistance, linear capacitance (Cm), charging time constant and holding current. The actual recording of Ca2+ transients was started after 15–35 min of stable holding at −80 mV, a time when the concentration of EGTA or BAPTA inside the cell was at a substantial fraction of the solution values (as was described previously, Manno et al. 2013). Non-linear capacitive (‘charge movement’) currents obtained by conventional subtraction of scaled controls and baseline correction were integrated to calculate intramembranous charge transfers QON and QOFF as functions of Vm. The dependence QON(Vm) was fitted with the ‘Boltzmann’ function:  to derive the amount of mobile charge Qmax, transition voltage
  , and limiting logarithmic slope 1/K. The mean values of these parameters were not statistically significantly different from those recorded in our previous work with this technique (Royer et al. 2008, 2010).
Simultaneous measurement of cytosolic and SR-lumenal [Ca2+] using a biosensor
In the experiments reported here Ca2+ transients and release flux are examined in parallel with [Ca2+]SR largely as described by Sztretye et al. (2011b). Every cell studied expressed D4cpv-Casq1 or D4cpv-δAsp in the SR; they were voltage clamped and had the high affinity, long wavelength Ca2+ monitor X-rhod 1 introduced in the cytosol via the patch pipette. Images Fj(x, t) were obtained in line scan mode. F1 and F2 represent fluorescence of D4cpv-Casq1 and D4cpv-δAsp, and F3 of X-rhod 1. The images were acquired in a laser scanning confocal system (SP2, Leica Microsystems, Exton, PA, USA) equipped with acousto-optical tunable elements that allowed excitation of X-rhod 1 (at 594 nm, with emission collected between 610 and 700 nm) alternating line-by-line with the excitation for D4cpv (at 458 nm, with emission collected between 470 and 510 nm for F1, and between 520 and 580 nm for F2); therefore images were effectively simultaneous. At the acquisition frequencies used, the alternate illumination resulted in actual intervals of 2.5–10 ms per line (5 ms per line in most cases) in the individual images. Spatial resolution was 0.24 μm pixel−1. Line scanning was always parallel to the fibre axis, at 10–15 μm from the glass coverslip.
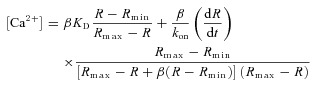
After averaging Fj(x, t) over x, to obtain Fj(t), the ‘FRET ratio’R was calculated as (F2– Background2)/(F1– Background1). Backgroundi was measured with lasers off. [Ca2+]SR was calculated from the ratio by a generalization of the equilibrium equation (Sztretye et al. 2011a)
 |
(1) |
where β is the ratio of values of F1 in the Ca2+-free and the Ca2+-saturated conditions. The parameter values of Rmin (0.505), Rmax (1.74), βKD (222 μm) and β (0.554) were determined in calibrations in situ (Sztretye et al. 2011a). kon was assumed to be 3.6 × 10⁶ m−1 s−1 (the value determined in solution at room temperature for cameleon D1, Palmer et al. 2004).
Determination of free cytosolic [Ca2+]
Average cytosolic [Ca2+], [Ca2+]c(t), is calculated from averaged X-rhod fluorescence F(t) as
| (2) |
Fmax and Fmin are derived from eqn (2) applied to the resting condition, in which [Ca2+]c(0) ≡[Ca2+]R is assumed equal to that in the pipette (0.1 μm, an assumption based on previous results, Royer et al. 2010). Equation 2 then becomes 0.1 μm= (F−Fmin)KD/(Fmax−F). Other parameter values are given in Sztretye et al. (2011a).
Release flux and permeability
Ca2+ release flux  was derived from [Ca2+]c(t) by the removal method (Melzer et al. 1987; Schuhmeier & Melzer, 2004; Royer et al. 2008), which involves assigning parameter values in a model of the removal of released Ca2+, so that the simulation fits the observed decay of cytosolic Ca2+ simultaneously for several evoked transients. Permeability was calculated as
| (3) |
The removal method, if strictly applied, yields  records of reliable kinetics but unreliable scale (details in Manno et al. 2013). [Dye]total, [EGTA]total and [BAPTA]total were set proportionally to the concentrations in the pipette and an exponential ‘entry’ function of time (Royer et al. 2010).
The kinetic constants of EGTA:Ca were kON= 15 (μm s)−1 and kOFF= 7.5 s−1 (Schuhmeier & Melzer, 2004; Royer et al. 2008). For BAPTA:Ca they were kON= 1000 (μm s)−1 and kOFF= 200 s−1 (Wu et al. 1996). Parvalbumin concentration was set to 1 mm. Its rate constants with Ca2+ were set as kON= 100 (μm s)−1 and kOFF= 1 s−1; for Mg2+ kON= 0.03 (μm s)−1 and kOFF= 3 s−1. kuptake, the proportionality constant linking the rate of pump removal to [Ca2+]c, was allowed to vary among cells for the best fit of [Ca2+]c(t). The best fit kuptake varied in the range 3.5–20 ms−1.
Amount released
The net flux leaving the SR,  , is derived by subtraction of the pump removal flux from
  , the flux that exits through release channels,
| (4) |
The integral of  , from the beginning of the pulse until time t, defines R(t), the amount released at time t.
| (5) |
Because the images were acquired at low frequencies, the peak of release flux was blunted. This effect was corrected, for the purpose of tabulating peak values, using empirical factors derived as described by Royer et al. (2008). The more slowly varying flux during the so-called quasi-steady phase that follows the peak during a long-lasting depolarization can be measured equally well at different acquisition rates and needs no correction (as shown by Royer et al. 2008).
SR Ca2+ buffering power
B is defined as d[Ca]T,SR/d[Ca2+]SR, a derivative of total with respect to free Ca2+ concentration in the SR. Because the change in total concentration is derived from the release flux, which is expressed relative to the volume of aqueous solution in the cytosol, a factor is necessary to express the concentration in terms of SR volume.
 |
(6) |
The adjustment factor, 12.7 (Manno et al. 2013), is the ratio of cytosolic volume (0.7 of cell volume) to SR volume (0.055). The values of B averaged during the pulse and afterwards will be represented as BON and BOFF, respectively; formally:
 |
(7) |
Supplemental material
Supplemental material is available online only. Supplemental Tables S1 and S2 present average parameters of voltage dependence of activation of Ca2+ release and intramembranous charge displacement in YS cells. Table S3 presents average parameters of intramembranous charge displacement in Casq1-silenced cells. Figure S1 and associated narrative illustrates the reproducibility of [Ca2+]SR transients. Figure S2 provides an additional example of the changes in P and B recorded in YS cells.
Results
MH events are essentially catastrophic alterations of Ca2+ management in skeletal myofibres. To learn more about Ca2+ management in cells of mice carrying the Y522S mutation in their RyR1 we combined established techniques for dynamic measurement of cytosolic [Ca2+] transients and the underlying Ca2+ release flux with the newly available measurement of [Ca2+]SR(t) (Sztretye et al. 2011a). Combined, these measurements yield two functionally important variables: the permeability, P(t), of the Ca2+-releasing SR membrane (Sztretye et al. 2011b; calculated by eqn (3)) and B(t), the Ca2+ buffering power of the SR (Manno et al. 2013; calculated by eqns (6) and (7)). This was done for Ca2+ release evoked by depolarizing pulses in plasma membrane voltage (Vm), pulses that were of high amplitude so that the Vm sensors would be put in a fully activating configuration, and long-lasting, to cause deep depletion in the store and explore its consequences. But before engaging in these measurements it was important to establish the Vm dependence of activation by repeating an earlier determination by Andronache et al. (2009). Our purpose was to test whether a consequential property of this dependence, observed in their work, applied in our setting.
Vm dependence of Ca2+ release flux and intramembranous charge movement are negatively shifted in the mutant
Andronache et al. (2009) observed a similar shift in the Vm dependence, by about 8 mV in the negative direction, of both flux and movement of the intramembranous voltage sensor in the YS mutant cells. As in the earlier study, we imaged Ca2+ transients and measured intramembranous charge movement during pulses to variable voltages in cells from YS mutants and their WT littermates. The Vm dependence of peak flux and charge displacement was fitted with descriptive sigmoidal functions, with mean best-fit parameters listed in Supplemental Tables S1 and S2. We fully confirm results of the earlier work: the Vm of half-release activation, Vr, shifted negatively in the YS, by about 5 mV on average. Also as found in the previous study, the mid-voltage  of the ‘Boltzmann’ fit to the intramembranous charge displacement also shifted negatively, by 8 mV. The parallel shift of flux and voltage sensor activation is remarkable, as it suggests that the increase in Vm sensitivity of the mutant channel (its activation at a more negative Vm) is not primarily an increase in readiness of the response to the signals from the Vm sensor (as these appear to be shifted as well, by about the same amount).
An additional outcome of the study is that by +30 mV the displacement of intramembranous charge is saturated for both YS and WT cells. Pulses to +30 mV are used in the remainder of the study.
Cytosolic Ca2+ transients are different in the mutant
A consistent feature distinguishes the time course of [Ca2+]c in YS mutants. This is illustrated with two examples in Fig. 1, which compares cytosolic Ca2+ transients elicited by long duration pulses in a YS cell (panel A) and a WT cell (B). As shown in earlier work (Royer et al. 2008, 2010) in the WT cells [Ca2+]c continues to rise, more slowly, after an initial fast phase (black trace in panels C and D). By contrast, in the YS cells (red trace in C and D) the second phase is brief, interrupted by a claudication, marked by an arrow, which usually occurs within the first 100 ms of the pulse. In the time course of flux  , the claudication corresponds to a ‘dip’ (arrows in panels E and F). This dip was of variable height and timing, as we show with these two examples, but was clearly present in comparisons with WT littermates in every one of 15 YS cells studied.
Figure 1. Cytosolic [Ca2+] transient and release flux elicited by maximal depolarization.

A and B, normalized line scans of cytosolic dye fluorescence (F(x,t)/F0 (x)) in a YS mutant (A) or a wild-type cell (B). C, line averages of the arrays in A and B showing a two-stage rise in the WT and an abrupt break during the 2nd stage in the YS (at arrow). Experiment identifiers (ID): YS is 012112b, average of images 39, 40, 43 and 44; WT is 072309a 43–52. D, line averages in a 2nd example, showing a lesser difference between the YS and its WT littermate. ID: YS, 042312b 48; WT, 042312d 12. E and F, release flux  calculated from the records in C and D, showing a faster decay (arrows) in YS cells. G and H, Ca2+ transients and flux in an EGTA-buffered reference solution or one with 5 mm BAPTA. The changes introduced by BAPTA are qualitatively similar to those found in the YS. ID: ‘BAPTA’, 091709a 19; ‘Reference’, 072309a 106.
As illustrated in Fig. 1G and H, these characteristics of the YS cells are similarly found in cells exposed to a large concentration of BAPTA in the cytosol. Records in G and H are from cells studied previously (Sztretye et al. 2011b), one in internal solution with 5 mm BAPTA, the other, ‘Reference’, with 10 mm EGTA (this EGTA solution provides a similar buffering power at equilibrium to the BAPTA solution, but does not interfere with release kinetics, due to the much slower rate of Ca2+ binding to EGTA; Rengifo et al. 2002). The interrupted second rise in [Ca2+]c in the presence of BAPTA (panel G) is again associated with an abrupt dip of  (arrow in panel H).
The statistics of these comparisons are summarized in Fig. 2A. An expanded summary is presented as Supplemental Table S1. As shown, there is no difference between the peak of  in the YS cells and in its WT littermates. BAPTA, which increases
  greatly in the WT (Sztretye et al. 2011b), caused a small and not significant change in the YS. This is a first example of qualitatively similar effects of BAPTA and the YS mutation. In this and other instances, which will be documented later, there is also mutual ‘occlusion’ of the BAPTA and YS effects. These effects do not compound quantitatively; when both BAPTA and the mutation are present, one does not add much to the effect of the other.
Figure 2. Statistical summary of differences.

Mean values and SEM for the variables indicated. A, peak release flux,  , is nearly equal in WT and YS in Reference solution. BAPTA fails to increase flux in the mutant. ‘(a)’ YS significantly different from WT (P < 0.05). ‘(b)’ WT in BAPTA significantly different from Reference. B, [Ca2+]SR is lower in the YS at rest, and decreases proportionally more after maximally depleting pulses. C, peak permeability, derived by dividing
  by [Ca2+]SR at the time of peak flux, is significantly greater in the YS, but the difference disappears in BAPTA. D, the average buffering power during the depolarizing pulse, BON, and its value during the OFF, which is approximately equal to the value of B reached at the end of the pulse, are similar in the WT in Reference. They become different in the YS. BAPTA increases the difference in the WT, but not in the YS. Cell numbers are listed inside the bars. Data on [Ca2+]SR were gathered in 7 of 15 YS cells studied in Reference solution, and all 7 YS cells in BAPTA. The WT sets include cells in a previous study (Manno et al. 2013).
In the mutant [Ca2+]SR is lower and P is higher
Figure 3A shows the FRET ratio of D4cpv-calsequestrin images simultaneously with the [Ca2+]c record from the YS cell in Fig. 1A. The traces are an average of three ratio images, obtained during pulses applied at 3 min intervals. The line average of this image is plotted in red in Fig. 3B. The graph includes scales for FRET ratio and [Ca2+]SR. The initial value of [Ca2+]SR, 200 μm, is much lower than the example WT, plotted in black (approximately 500 μm). The average resting value of [Ca2+]SR in YS cells is significantly lower than the WT average (mean ± SEM: 260 ± 54 μm vs. 470 ± 56 μm; Fig. 2B, see also Sztretye et al. 2011b for earlier measurements in the WT).
Figure 3. The time course of [Ca2+]SR and release permeability.

A, FRET ratio of line scan images of fluorescence of D4cpv-calsequestrin in the YS cell whose cytosolic dye line scan was shown in Fig. 1A. The panel is an average of 3 individual ratio images, scanned during the same pulses eliciting the records in Fig. 1B, line average of ratio in A. [Ca2+]SR calibration is given on the right side. A brief increase in [Ca2+]SR (arrow) was observed in repeated pulses. C, P(t), ratio of  from Fig. 1E and [Ca2+]SR(t) from this figure, panel B. P is greater in the YS (red trace) and exhibits a hump after the initial peak. Cytosolic F/F0 simultaneously recorded in the YS cell is plotted in grey. The break in the 2nd rise of F/F0 (arrow) coincides with the trailing side of the hump in P. D, average of 10 line scan ratio images from a WT cell in BAPTA. ID: 051209b 34–43. E, line average of the image in D (red). The curve in black is from the WT in Reference (panel B). F, P(t), calculated as in C. A second rise in P(t) is a common observation in BAPTA. Note different scales in C and F.
Considering that peak flux in the YS is approximately equal to that in the WT, the lower initial [Ca2+]SR requires that permeability be increased in the mutant. P(t) for the example is in Fig. 3C. It peaks higher in the YS, and remains higher during the pulse, resulting in a greater relative depletion after a long-lasting depolarization. These differences are repeated in the averages (Fig. 2C), which also show that BAPTA greatly increases P in the WT but not in the YS. Reciprocally, the difference in P observed in Reference conditions is obliterated in BAPTA (another example of the occlusion mentioned in the previous sub-section).
In many YS cells, including the example, P(t) features a second peak, or ‘hump’. Figure 3D is an average FRET ratio image from a WT cell in BAPTA. The simultaneously derived flux, together with [Ca2+]SR(t), in red in Fig. 3E, are used to derive P(t) (red in panel F). In this and other WT cells in BAPTA, a prominent second rise in P follows the initial peak. Humps in P are a feature common to YS mutants and WT cells in BAPTA, reinforcing the notion that the mutation and BAPTA have similar effects.
An additional feature of [Ca2+]SR(t) in the mutant is an event that in this example appears as a transient rise in the concentration (arrows in Fig. 3B and Supplemental Fig. S1) and in others as an interruption of the decay (Supplemental Fig. S2). Supplemental Fig. S1 shows line-averaged profiles of the FRET signal in repeated pulses, to demonstrate reproducibility, with some variation, in the event features. Figure S2 shows P(t) with a hump in another cell where [Ca2+]SR(t) interrupts its decay rather than rising transiently. This example, as well as the observation of humps in BAPTA, demonstrates that the secondary rise in P is not necessarily linked with the anomalous rise that interrupts normal decay in the temporal evolution of [Ca2+]SR. As one might expect given the change in driving force for Ca2+, the anomalous rise in [Ca2+]SR was always accompanied by an increase in release flux.
SR calcium buffering is altered in the YS mutant
The Ca2+ buffering power, B, of the SR, defined as the derivative of total SR calcium concentration, [Ca]T,SR, with respect to free [Ca2+]SR, was derived from ‘buffer plots’ as illustrated in Fig. 4 for the same YS and WT examples. This calculation follows closely the description by Manno et al. (2013). Total amount released, R(t), calculated by time integration of net flux, is represented in Fig. 4A for the WT and YS examples of Figs 1 and 3. In Fig. 4C, these amounts are plotted vs.[Ca2+]SR. Because the cell is a closed universe for calcium in the conditions used for voltage clamp, and flux into mitochondria and organelles other than the SR is small (Yi et al. 2011), the change in total SR calcium is equal to (minus) R(t). Therefore B is equal to (minus) the slope of the buffer plots. As noted recently (Manno et al. 2013), B is either constant or slowly decreasing during a depolarizing pulse in the ‘Reference’, EGTA-buffered solution. This quasi-linearity is altered in the YS; in the example (red trace in Fig. 4C) the slope changes, appearing to go through a very high value (chord d–d) or even a change of sign during the pulse. The stage of high B value corresponds in time to the hump in P (red trace in Fig. 3C), and the positive slope corresponds with the brief rise in [Ca2+]SR that interrupts its decay (arrow in Fig. 3B).
Figure 4. Dynamic Ca2+ buffering in the SR.

Continuing analysis of the experiments in Fig. 3. A, amount released R(t), calculated by time integration of net flux. B, R(t) for the cell in BAPTA illustrated in Fig. 3 (red). In A and B the amount released in the WT cell in Reference solution is shown in black. C and D, ‘buffer plots’, R(t) vs.[Ca2+]SR(t). Buffering power B (the (minus) slope) is nearly constant in WT cells in Reference (black), but decays during the pulse in the presence of BAPTA (compare a–a and b–b). In the YS B changes during the ON, the slope becomes infinite (line d–d) or even changes sign. The OFF portion of the plot is generally linear. Its (minus) slope, BOFF, is used as an estimate of the value of B at the end of a pulse (Manno et al. 2013). A difference between the averages BON and BOFF is a measure of the change in B(t) during the pulse.
In the presence of BAPTA, B changes markedly during a depleting pulse (Manno et al. 2013). Buffering data from the cell in BAPTA illustrated in Fig. 3 are included in Fig. 4B and D. The main effect of the presence of BAPTA is the occurrence of a substantial change – a reduction – in B during the pulse (red trace in Fig. 4D). The slope of the buffer plot starts high (chord a–a) but decays during the pulse, ending at a substantially lower value (b–b). The YS example of Fig. 4C does not show a comparable difference between initial and final B; instead, it has a large increase in B roughly mid-way through the pulse, followed by pronounced decay. On average over all YS cells studied, there is a clear and significant decay in B during the pulses (Fig. 2D). In summary, B in the YS in the Reference solution decreased during a depleting depolarization, a change that did not happen in the WT. Again, the presence of BAPTA occluded this difference, as the decay in B then became obvious in the WT.
Silencing of the calsequestrin gene replicates alterations observed in YS cells
The key observation of the present work is that P increases greatly in the YS cells, reflecting an increase in channel openness that is probably the main primary defect associated with the mutation. Breaks in [Ca2+]c(t) and changes in B can be explained using the known positive correlation between binding power of calsequestrin and [Ca2+]SR level (Park et al. 2004; Pape et al. 2007; Manno et al. 2013). Increased P results in release flux that is large initially but decays rapidly, as it reduces an already low SR load. The diminishing binding ability of calsequestrin feeds back negatively, precipitating the decay of flux.
To put this idea to the test we used an alternative way to diminish buffering by calsequestrin: we reduced the amount of protein. Muscle of adult mice was transfected with siRNA tested for its ability to silence Casq1 (Wang et al. 2006). To increase the silencing effect we applied the vector twice, in both hind paws, with an interval of 5 days. Mice were studied 4–5 days after the second application.
The FDB of one paw was used for immunoblots and the other for functional studies of dissociated cells. Figure 5A shows anti-calsequestrin 1 blots of whole FDB muscles from four treated and four reference mock-transfected mice. The measured reduction ranges from 40% to 100% of reference. We assume, therefore, that in individual cells treated the same way, silencing was in the same range. As an additional predictor of silencing, the plasmid vector that carried the silencer had cDNA for a fluorescent marker: ECFP for the first injection and EYFP for the second one. The image panels in Fig. 5 are fluorescence image pairs of a fibre that expressed only ECFP (panels B) or EYFP (C), while panels D show a fibre with expression of both markers. Fibres were not studied functionally unless they had both markers. This allows certainty that the cells tested had been transfected with the silencing vector but their exact degree of reduction in Casq1 was not determined. It should be noted, though, that the range of 40– 100% reduction observed with whole muscles is sure to underestimate the degree of reduction in individual cells known to have taken shRNA vector in both injections.
Figure 5. Silencing of the Casq1 gene.

A, calsequestrin 1 levels in silenced muscles. Blots of 4 reference, mock-transfected FDB muscles (lanes 1, 2, 7 and 8) or 4 Casq1-silenced muscles, transfected twice with differently marked shRNA coding vectors as described in the text (lanes 3–6). GAPDH staining was used as control for protein loading. The extent of Casq1 knock-down varied between 40% (lane 6) and 100% (lane 4). B–D, fluorescence of transfection markers EYFP (a) or ECFP (b) in three cells from a muscle treated by two injections of differently marked silencer. Only the fibre in D showed evidence of transfection by both applications of silencer.
Figure 6A–D compares the [Ca2+]c transients in a reference cell, a cell from a calsequestrin-null mouse (both taken from a study of Royer et al. 2010) and a silenced cell. The Ca2+ transient in the silenced cell (green trace in Fig. 6D) shows a claudication similar to that in the YS (red trace in Fig. 1A and C), which interrupts the 2nd rising phase observed in the WT cell (blue trace in Fig. 6D). This 2nd rise is absent in the Casq-null example (red trace in Fig. 6D) and in all null cells in the earlier study (Royer et al. 2010).
Figure 6. The Ca2+ transients of Casq1-silenced cells.

A and B, normalized line scans of cytosolic X-rhod 1 in a reference and a Casq1- and Casq2-null cell (reproduced from Royer et al. 2010). C, line scan in a doubly transfected cell that was positive for both markers. ID: 102208a17. D, line averages from images A–C. Note a secondary rise in the silenced cell (similar to that of the WT), which is interrupted by a rapid decay or break, at ∼100 ms into the depolarization. A similar decay phase, but faster and earlier, is observed in the Casq-null (red). E, line scan from another cell positive for two silencer applications. ID: 092208b 18. F, line scan of X-rhod 1 in the YS (same cell as in Fig. 1A, but 0.4 s pulses used instead). G, line averages of images E and F. Note the agreement in time course, including a secondary rise ended by a break, ∼100 ms into the pulse.
In Fig. 6E–G the transient in a second silenced cell, from a different mouse, is compared with a Ca2+ transient imaged in a YS cell (Fig. 6F). The similarity in the kinetic evolution of both records is striking (Fig. 6G). Both feature a peak, about 100 ms into the pulse, which reflects an abrupt decay in release flux. As was the case for mutant cells, abrupt changes in the Ca2+ transients were not present in all cases, they were observed in 5 of 15 cells from four silenced muscles (4 animals). The distribution of intramembranous charge movement was recorded in all cases and did not change significantly in the silenced cells (Supplemental Table S3). The observed breaks in the Ca2+ transients were not the consequence of failure of voltage clamp, as there was no indication of any such failure in the records of membrane current.
The anomalous buffering properties of YS muscle fibres are not due to a change in Casq content
The functional similarities, in time course of calcium transients and altered buffering properties, of YS mutant myofibres and cells with calsequestrin content made lower by gene silencing, suggest the reduction of calsequestrin content as a possible explanation for the changes in the YS. Calsequestrin content was compared between WT and YS separately in three types of muscles (EDL, soleus and diaphragm). The measurements are documented in Fig. 7, which shows, at the top, representative Western blots and at the bottom the average densities in muscles of six WT and six YS. No significant differences in calsequestrin content between WT and YS mice were found in any of these muscles.
Figure 7. Calsequestrin content of wild-type and Y522S mutant muscles.

Top, Western blot images from three muscles in one wild-type (WT) and one mutant mouse (YS). Bottom, mean values and SEM for six muscles of each type and mouse strain of the optical density normalized by the GAPDH value in the same muscle. The differences between WT and YS were not significant in any case.
Discussion
[Ca2+]SR is greatly reduced in the YS mutant
We applied newly available measurements to characterize functionally adult murine skeletal muscle cells with the mutation Y524S in their RyR1 channel (corresponding to Y522S in humans). A first finding was that the resting SR [Ca2+] is much lower, 260 μm on average (SEM 54 μm), vs. 470 μm (56 μm) in the WT. This first direct measure of [Ca2+]SR in a MH muscle serves to explain the increase in [Ca2+]c observed in the YS (Durham et al. 2008; Andronache et al. 2009) and other MH models since López et al. (1986). Indeed, the Cell Boundary Theorem (Ríos, 2010; Friel & Tsien, 1992) requires that a steady increase in cytosolic [Ca2+] be justified by changes at the plasma membrane. Steady SR depletion is expected to activate store-operated Ca2+ entry, thus increasing [Ca2+]c.
Previous measures of Ca2+ releasable in YS cells by various stimuli gave a range of results. In YS knock-in mice there was no change in the amount releasable by caffeine (Chelu et al. 2006) and a minor reduction in release by depolarization (Andronache et al. 2009). RyR-null myotubes transiently expressing the YS RyR1 showed a major decrease in release by caffeine (Avila & Dirksen, 2001). The present results help clarify the variability by showing both a major reduction in the directly measured resting [Ca2+]SR and an increase in the depletion achievable by depolarization. According to the present set of results these changes tend to compensate, resulting in similar releasable amounts in mutant and WT cells. Different conditions, including changes in temperature (Durham et al. 2008), may alter these features differently, explaining the variability in previous reports.
The permeability to Ca2+ of the SR membrane is greatly increased in the mutant
The measurement of [Ca2+]SR made possible for the first time in YS cells the direct calculation of release permeability, P (eqn (3)). Peak P, compared in Fig. 2A, was substantially increased in the YS by about the same ratio as that in which resting [Ca2+]SR was decreased, resulting in approximately equal average values of peak flux. P(t) remained greater in the YS during the pulse, leading to a greater degree of depletion. While in the WT [Ca2+]SR stabilized at 150–200 μm during a long-lasting depolarization, in the YS the final level reached by depletion was on average 80 μm. This increase in P plus the changes in resting [Ca2+]SR and releasable fraction combine to explain the well-documented conservation of a stable basal function in spite of the major reduction in SR load.
The situation in the YS mutant appears similar to that in mice with R163C, another MH-linked mutation in RyR1 (Yang et al. 2006). Indeed [Ca2+]c is elevated at rest in RC myotubes and adult fibres (Feng et al. 2011). While no direct measurement is available, an increase in [Ca2+]c is usually accompanied (and probably determined) by a decrease in [Ca2+]SR (e.g. Eltit et al. 2013). In spite of the probable reduction in [Ca2+]SR, the Ca2+ transients in response to electrical stimulation are similar (Feng et al. 2011), which in turn requires increased P. This ‘compensated deficit’ in SR load thus emerges as a motif, common to RyR mutations that determine MH susceptibility via gain of RyR channel function.
As is true in the WT, the decay or ‘termination’ of release flux in the YS mutant results from SR depletion and channel closing. The combination in the YS of increased P and low starting SR load led to a  that decayed rapidly. The altered
  resulted in a Ca2+ transient of characteristic shape, which instead of the second rise visible in the WT cells displayed a decaying phase that could be sharp.
In the same strain of mice it has been shown that the activation of flux is shifted to lower Vm by about 8 mV while the activation of the membrane voltage sensor (as reflected in the Vm dependence of intramembranous charge movement) is equally shifted (Andronache et al. 2009). Impressed by this observation, we confirmed that the shifts are similar (Supplemental Tables S1 and S2). The result implies that the intrinsic sensitivity of the channel to signals from the Vm sensor is not changed detectably, an intriguing conclusion given that the mutation undoubtedly shifts the channels towards the open state. This conundrum is addressed later.
The mutant may have reduced Ca2+-dependent inactivation of the RyR
A striking aspect of the observed effects of the mutation is their similarity with those of BAPTA. Indeed, in 5 mm cytosolic BAPTA peak P increased greatly in the WT, to values similar to those of the YS in Reference conditions, while the presence of BAPTA abolished the difference in P between YS and WT (Fig. 2C). The mutation and BAPTA mutually occlude rather than compound their effects, an indication that they increase channel openness by similar mechanisms. The agreement of the effects on P is not limited to its peak; a similar hump in P(t) can be found in YS cells in Reference and WT cells in BAPTA (Fig. 3C and F). Finally, BAPTA and the YS mutation caused similar alterations in SR Ca2+ buffering.
BAPTA has an ON rate constant 100 times greater than that of EGTA (Wu et al. 1996). At the concentration used in our Reference solution EGTA does not alter the normal gating of the RyR1 (Rengifo et al. 2002; González & Ríos, 1993). Inclusion of fast reacting Ca2+ ligands such as Fura-2 (Baylor & Hollingworth, 1988) or BAPTA at concentrations as low as 0.3 mm (Posterino & Lamb, 2003) is believed to promote flux by obstructing Ca2+-dependent inactivation of RyR1. It is therefore possible that one of the primary effects of the YS mutation is to interfere with CDI. The alternative, that mutation and BAPTA increase P by different mechanisms and the increased P then determines other effects that agree qualitatively and quantitatively, seems less plausible.
The Ca2+ binding sites involved in CDI are thought to face the cytosol (Fill & Copello, 2002). Their location is placed close to the cytosolic pore opening by evidence of involvement of the permeating ions in the inhibition process (the so-called ‘feed-through’ mechanism; Jong et al. 1993; Tripathy & Meissner, 1996; Pape et al. 1998; Pizarro & Ríos, 2004).
The location of tyrosines 522 in the RyR1 tetramer is established with precision. They are in domain C of hotspot 1, at the far end of the domain relative to the centre of the tetramer, in a cytosolic vestibule 7–8 nm away from the pore (Tung et al. 2010). While none of the critical residues in this hotspot appear to be actually exposed to the cytosol, Y522 is very close to it. Replacement of a tyrosine in this location may alter a Ca2+ binding site near the pore exit or modify the allosteric consequences of Ca2+ binding nearby.
The reason for the shift in Vm dependence of the voltage sensor must be found in its link with the channel. Indeed, facilitation of channel opening, by chaotropic anions (González & Ríos, 1993) or the modulatory protein S100A1 (Prosser et al. 2009), enhances the movement of the voltage sensor in a feedback loop mediated by released Ca2+ and/or allosteric connections (Csernoch et al. 1991; Ríos et al. 1993; Prosser et al. 2009).
Some differences between the effects of the mutation and BAPTA must be noted. While the mutation shifted the movement of the Vm sensor to lower voltages, BAPTA did not. Additionally, the mutation reduced resting [Ca2+]SR more than 5 mm BAPTA (Fig. 2B). These differences may reflect additional ways in which the mutation and BAPTA modify channel function.
Ca2+ buffering ability in the YS mutant
The alterations in B, the Ca2+ buffering power of the SR in the YS, recapitulate the dynamic changes reported in BAPTA (Manno et al. 2013): B starts high and decreases during a long-lasting depolarization. Fast loss of buffering power during a depolarization coincides temporally with the characteristic break observed in the Ca2+ transients and release flux (Fig. 1A, C and E).
Ca2+ buffering in the SR is largely the role of calsequestrin (e.g. Murphy et al. 2009; Manno et al. 2013). How could a change in B, and by inference a functional change in calsequestrin, result from the primary functional alteration in the mutant – an increase in P? And how can this happen without changes in Casq content?
A possible answer is illustrated with the schematic diagram in Fig. 8. The proposal is based on evidence that calsequestrin changes conformation as it binds Ca2+ in vitro (e.g. Mitchell et al. 1988), a change later shown by Park et al. 2003, 2004) to correspond to linear polymerization, and recently demonstrated to require Ca2+ ions at interfaces formed when the protein polymerizes (Sánchez et al. 2012). The figure depicts a linear ramified polymeric calsequestrin network, stabilized by Ca2+ (red dots), and reflects the consensual role of triadin, linking calsequestrin to the RyR (reviewed by Marty et al. 2009). The stoichiometric anchoring of calsequestrin polymers near RyR channel openings is based on electron microscopic images by Boncompagni et al. (2012). Figure 8A corresponds to the initial situation in the WT as channels open, with [Ca2+]SR at its resting level. As release proceeds Ca2+ ions leave calsequestrin, which results in a less stable network, depicted in panel B as having a somewhat distorted structure. According to the Ca2+-binding curves of the protein in solution (e.g. Park et al. 2004), this moderately depleted situation results in a lowering of buffering capacity and power.
Figure 8. Imagining Ca2+-dependent states of the calsequestrin network.
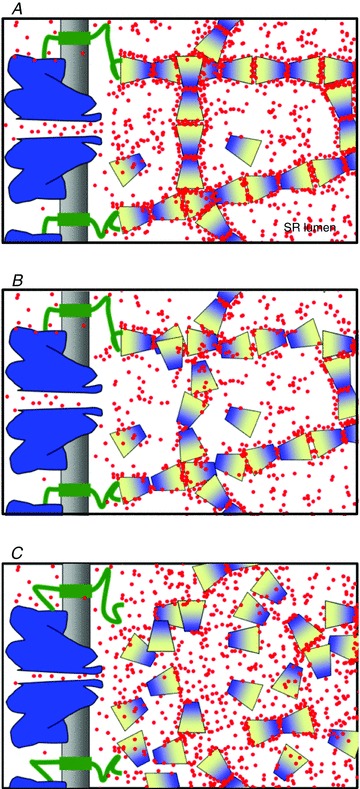
A, situation at the start of a Ca2+ release event. The RyR channel (blue) has just opened. At the resting concentration, Ca2+ in the SR (red) cross-links calsequestrin protomers into a stable polymeric network. Triadin (green) links the RyR to calsequestrin and provides anchors for the network. B, the situation after Ca2+ release. Partial depletion results in lower free and bound [Ca2+], which destabilizes the network, partially altering its structure, causing loss of Ca2+ coordination sites and leading to a reduced Ca2+ buffering power B. Manno et al. (2013) have shown that a high rate of Ca2+ release is an adjuvant to the loss of B. C, a situation of widespread collapse of the polymeric network, which leads to large-scale loss of coordination sites and passage of large amounts of the ion to free solution, is proposed to explain the transient increase in [Ca2+]SR observed here in the YS. The increased P associated with the mutation allows for an initial flux of normal magnitude, which will very rapidly deplete an SR that starts with low Ca2+ content and low B. See further discussion in the text.
Pape et al. (2007), working with frog muscle, were the first to demonstrate a decay of buffering power with progressive depletion in functioning SR. Manno et al. (2013) confirmed the observation in mammalian muscle but noted that the change in B with depletion only became significant in the presence of cytosolic BAPTA, which together with other aspects of the observation indicated that a fast rate of Ca2+ release was required to induce the change in B. A faster flux will produce greater luminal [Ca2+] gradients, and locally more pronounced and more spatially heterogeneous loss of Ca2+ from the calsequestrin network. The spatial heterogeneity is likely to destabilize the network further, enhancing the loss of binding sites.
If the reduction in free [Ca2+]SR and the loss of bound Ca2+ are sufficiently rapid, the calsequestrin network might collapse, i.e. undergo a large-scale change in structure, pictured in Fig. 8C. This would result in the sudden disappearance of a large set of Ca2+ binding sites, with the consequent passage of bound Ca2+ to free solution (a luminal Ca2+ transient). This mechanism was proposed to explain calsequestrin-dependent transient increases in luminal [Ca2+] since they were first observed in vesicular preparations (Ikemoto et al. 1991) and also when found in frog skeletal muscle (Launikonis et al. 2006). While such luminal Ca2+ transients have been observed under a number of stimuli, they are not the rule in mammalian muscle, as shown by the present measurements in the wild-type, and in recent work by various laboratories (Sztretye et al. 2011b; Canato et al. 2011; Wang et al. 2012), which found that the decay of [Ca2+]SR was monotonic.
Luminal Ca2+ transients are found again here, this time in YS mutants. Similar to the observations of Launikonis et al. (2006), the luminal transients in the YS are accompanied by a characteristic feature in the cytosolic Ca2+ transient: a sudden rise, with a sharp termination, not associated with any change in plasma membrane current. Surprisingly, cytosolic Ca2+ transients with essentially the same characteristics were found in adult fibres with acute silencing of the Casq1 gene, causing severe but incomplete reduction in the protein endowment. It is likely that these sharp cytosolic events reflect similar luminal Ca2+ increases.
At first sight, the circumstances in YS mutant and Casq1-silenced cells would seem to be very different. Most importantly, and as shown with Fig. 7, the calsequestrin content of the YS mutant cells is not reduced as it is in the Casq1-silenced myofibres. They, however, share one condition, a disproportion between P, which is normal in the silenced cell and enhanced in the mutant, and B, which is greatly reduced in the silenced cell, as well as in the YS by virtue of the lower resting [Ca2+]SR.
We therefore propose that the unusual Ca2+ transients observed in the YS mutant and the Casq1-silenced cells have as shared cause a collapse of the large-scale polymeric network of calsequestrin due in turn to the imbalance between the ability to release Ca2+ and extant SR Ca2+ buffering power. That these transients remain infrequent is consistent with the lack of electron microscopic evidence of major changes in the SR luminal structures after depleting interventions (C. Franzini-Armstrong, personal communication).
The pathogenesis of an MH event
An emerging consensus associates MH susceptibility to ‘gain of function’ mutations in RyR1, which increase the channel's tendency to open and/or delay its closure (Dirksen & Avila, 2004; Avila, 2005). Although the details of the pathogenesis of the MH events are poorly understood, an MH event is characterized by uncontrolled Ca2+ release (reviewed by Melzer et al. 1995). The present results indicate that a failure of CDI may contribute to the MH response in the YS model.
The Y522S mutation is associated with MH with central cores (Chelu et al. 2006). A pressing question about the pathogenesis of inheritable RyR1 diseases is why cores associate with some, but not all, MH-inducing mutations. Cores may reflect the damaging effects of chronically elevated local [Ca2+]c (e.g. Lamb & Cellini, 1999; MacLennan & Zvaritch, 2011) and/or increased oxidative/nitrosative stress by reactive oxygen and nitrogen species (Durham et al. 2008; Lanner et al. 2012). The YS mice appear to be the most sensitive of the current mouse models of MH to heat and also appear to show severe Ca2+ store depletion (present results) which is strongly temperature dependent (Durham et al. 2008; Lanner et al. 2012). Sustained changes associated with the YS mutation (temperature-dependent increases in cytosolic calcium, decreased [Ca2+]SR and resulting conformational changes in calsequestrin and triadin) may alter, directly or via interactions with the SR, interfibrillar mitochondrial function, and activate proteolytic enzymes to a greater extent in the YS mice than in other mouse MH models, leading to the formation of cores. Further studies and comparisons of the current mouse models of MH without cores, MH with cores and CCD without MH are needed to fully elucidate mechanisms of core formation. Particularly challenging will be the elucidation of the mechanisms whereby MH mutations that increase Ca2+ leak and the CCD mutations that partially decrease Ca2+ efflux both produce central cores and are associated with impaired muscle function in humans.
Diseases of the couplon
The present work has general consequences regarding the diseases that affect Ca2+ release in striated muscles. As stated before, not just mutations in RyR2 but several in calsequestrin 2 (Priori & Chen, 2011) and at least one in triadin (Roux-Buisson et al. 2012) are linked with CPVT. Extending the cardiac–skeletal parallel, MH-like events have been demonstrated in mice devoid of calsequestrin (Protasi et al. 2011). These associations suggest the operation of a common pathogenetic pathway whereby similar phenotypes arise from defects, not only in different locations within the RyR, but also in different members of the chain of proteins, the couplon, that control Ca2+ release. The striking parallel demonstrated in the present work between the changes in Ca2+ signalling induced by the Y522S mutation in the RyR1 and the knock-down of calsequestrin 1, supports the existence of couplon-wide noxogenic aetiologies whose mechanisms remain to be established in detail.
Acknowledgments
None.
Glossary
- BAPTA
1,2-bis(o-aminophenoxy)ethane-N,N,N′,N′-tetraacetic acid
- BTS
n-benzyl-p-toluene sulphonamide
- Casq
calsequestrin gene, used also for the protein
- CCD
central core disease
- CDI
Ca2+-dependent inactivation
- CPVT
cathecolaminergic polymorphic ventricular tachycardia
- DHPR
dihydropiridine receptor
- D4cpv
D4 circularly permuted Venus
- EDL
extensor digitorum longus
- FDB
flexor digitrorum brevis
- FRET
Förster resonant energy transfer
- MH
malignant hyperthermia
- RyR
ryanodine receptor
- SR
sarcoplasmic reticulum
- WT
wild-type
Additional information
Competing interests
None declared.
Author contributions
All experiments were carried out in the Department of Molecular Biophysics and Physiology, Rush University. C.M. and L.F. executed and analysed the experiments; L.R. constructed the plasmids and executed the silencing experiments; P.V. and A.N. initiated the expression and silencing experiments; C.S.L. executed the analysis of protein content and final editing; G.M. designed, tested and provided the silencer; S.P. and J.Z. developed the methods, analysed data and co-wrote the paper; S.L.H. planned the experiments, provided YS mice, determined protein content, analysed, and co-wrote the paper; E.R. designed and executed the experiments, and co-wrote the paper. All authors contributed analysis and discussion, and all approved the final submission.
Funding
This work was supported by grants from the NIH (AR049184 and AR032808 to E.R.; AR053349 and AR041802 to S.L.H., AR057404 to J.Z., AR018687 to G.M.), Telethon GGP11141 to P.V. and A.N., and MDA 4351 to J.Z.
Author's present address
S. Pouvreau: CNRS UMR 5297, Interdisciplinary Institute for Neuroscience, University of Bordeaux, F-33000 Bordeaux, France.
Supplementary material
Figure S1
Figure S2
Table S1
Table S2
Table S3
References
- Andronache Z, Hamilton SL, Dirksen RT, Melzer W. A retrograde signal from RyR1 alters DHP receptor inactivation and limits windows Ca2+ release in muscle fibers of Y522S RyR1 knock-in mice. Proc Natl Acad Sci U S A. 2009;106:4531–4536. doi: 10.1073/pnas.0812661106. [DOI] [PMC free article] [PubMed] [Google Scholar]
- Avila G. Intracellular Ca2+ dynamics in malignant hyperthermia and ventral core disease: established concepts, new cellular mechanisms involved. Cell Calcium. 2005;37:121–127. doi: 10.1016/j.ceca.2004.08.001. [DOI] [PubMed] [Google Scholar]
- Avila G, Dirksen RT. Functional effects of central core disease mutations in the cytoplasmic region of the skeletal muscle ryanodine receptor. J Gen Physiol. 2001;118:277–290. doi: 10.1085/jgp.118.3.277. [DOI] [PMC free article] [PubMed] [Google Scholar]
- Baylor SM, Hollingworth S. Fura-2 calcium transients in frog skeletal muscle fibres. J Physiol. 1988;403:151–192. doi: 10.1113/jphysiol.1988.sp017244. [DOI] [PMC free article] [PubMed] [Google Scholar]
- Boncompagni S, Rossi AE, Micaroni M, Hamilton SL, Dirksen RT, Franzini-Armstrong C, Protasi F. Characterization and temporal development of cores in a mouse model of malignant hyperthermia. Proc Natl Acad Sci U S A. 2009;106:21996–22001. doi: 10.1073/pnas.0911496106. [DOI] [PMC free article] [PubMed] [Google Scholar]
- Boncompagni S, Thomas M, Lopez JR, Allen PD, Yuan Q, Kranias EG, Franzini-Armstrong C, Pérez CF. Triadin/Junctin double null mouse reveals a differential role for Triadin and Junctin in anchoring CASQ to the jSR and regulating Ca2+ homeostasis. PLoS One. 2012;7:e39962. doi: 10.1371/journal.pone.0039962. [DOI] [PMC free article] [PubMed] [Google Scholar]
- Canato M, Scorzeto M, Giacomello M, Protasi F, Reggiani C, Stienen GJ. Massive alterations of sarcoplasmic reticulum free calcium in skeletal muscle fibers lacking calsequestrin revealed by a genetically encoded probe. Proc Natl Acad Sci U S A. 2011;107:22326–22331. doi: 10.1073/pnas.1009168108. [DOI] [PMC free article] [PubMed] [Google Scholar]
- Chelu MG, Goonasekera SA, Durham WJ, Tang W, Lueck JD, Riehl J, Pessah IN, Zhang P, Bhattacharjee MB, Dirksen RT, Hamilton SL. Heat- and anesthesia-induced malignant hyperthermia in an RyR1 knock-in mouse. FASEB J. 2006;20:329–330. doi: 10.1096/fj.05-4497fje. [DOI] [PubMed] [Google Scholar]
- Csernoch L, Pizarro G, Uribe I, Rodriguez M, Rios E. Interfering with calcium release suppresses I gamma, the “hump” component of intramembranous charge movement in skeletal muscle. J Gen Physiol. 1991;97:845–884. doi: 10.1085/jgp.97.5.845. [DOI] [PMC free article] [PubMed] [Google Scholar]
- Dirksen RT, Avila G. Distinct effects on Ca2+ handling caused by malignant hyperthermia and central core disease mutations in RyR1. Biophys J. 2004;87:3193–3204. doi: 10.1529/biophysj.104.048447. [DOI] [PMC free article] [PubMed] [Google Scholar]
- Durham WJ, Aracena-Parks P, Long C, Rossi AE, Goonasekera SA, Boncompagni S, Galvan DL, Gilman CP, Baker MR, Shirokova N, Protasi F, Dirksen R, Hamilton SL. RyR1 S-nitrosylation underlies environmental heat stroke and sudden death in Y522S RyR1 knockin mice. Cell. 2008;133:53–65. doi: 10.1016/j.cell.2008.02.042. [DOI] [PMC free article] [PubMed] [Google Scholar]
- Eltit JM, Bannister RA, Moua O, Altamirano F, Hopkins PH, Pessah IN, Molinski TF, López JR, Beam KG, Allen PD. Malignant hyperthermia susceptibility arising from altered resting coupling between the skeletal muscle L-type Ca2+ channel and the type 1 ryanodine receptor. Proc Natl Acad Sci U S A. 2012;109:7923–7928. doi: 10.1073/pnas.1119207109. [DOI] [PMC free article] [PubMed] [Google Scholar]
- Eltit JM, Ding X, Pessah IN, Allen PD, Lopez JR. Nonspecific sarcolemmal cation channels are critical for the pathogenesis of malignant hyperthermia. FASEB J. 2013;27:991–1000. doi: 10.1096/fj.12-218354. [DOI] [PMC free article] [PubMed] [Google Scholar]
- Estéve E, Eltit JM, Bannister RA, Liu K, Pessah IN, Beam KG, Allen PD, López JR. A malignant hyperthermia-inducing mutation in RyR1 (R163C): alterations in Ca2+ entry, release, and retrograde signaling to the DHPR. J Gen Physiol. 2010;135:619–628. doi: 10.1085/jgp.200910328. [DOI] [PMC free article] [PubMed] [Google Scholar]
- Feng W, Barrientos GC, Cherednichenko G, Yang T, Padilla IT, Truong K, Allen PD, Lopez JR, Pessah IN. Functional and biochemical properties of ryanodine receptor type 1 channels from heterozygous R163C malignant hyperthermia-susceptible mice. Mol Pharmacol. 2011;79:420–431. doi: 10.1124/mol.110.067959. [DOI] [PMC free article] [PubMed] [Google Scholar]
- Fill M, Copello JA. Ryanodine receptor calcium release channel. Physiol Rev. 2002;82:893–922. doi: 10.1152/physrev.00013.2002. [DOI] [PubMed] [Google Scholar]
- Friel DD, Tsien RW. A caffeine-and ryanodine-sensitive Ca2+ store in bullfrog sympathetic neurons modulates effects of Ca2+ entry on [Ca2+]i. J Physiol. 1992;450:217–246. doi: 10.1113/jphysiol.1992.sp019125. [DOI] [PMC free article] [PubMed] [Google Scholar]
- González A, Ríos E. Perchlorate enhances transmission in skeletal muscle excitation-contraction coupling. J Gen Physiol. 1993;102:373–421. doi: 10.1085/jgp.102.3.373. [DOI] [PMC free article] [PubMed] [Google Scholar]
- Ikemoto N, Antoniu B, Kang JJ, Meszaros LG, Ronjat M. Intravesicular calcium transient during calcium release from sarcoplasmic reticulum. Biochemistry. 1991;30:5230–5237. doi: 10.1021/bi00235a017. [DOI] [PubMed] [Google Scholar]
- Jong DS, Pape PC, Chandler WK, Baylor SM. Reduction of calcium inactivation of sarcoplasmic reticulum calcium release by fura-2 in voltage-clamped cut twitch fibers from frog muscle. J Gen Physiol. 1993;102:333–370. doi: 10.1085/jgp.102.2.333. [DOI] [PMC free article] [PubMed] [Google Scholar]
- Lamb GD, Cellini MA. High intracellular [Ca2+] alters sarcoplasmic function in skinned skeletal muscle fibres of the rat. J Physiol. 1999;15:815–827. doi: 10.1111/j.1469-7793.1999.0815n.x. [DOI] [PMC free article] [PubMed] [Google Scholar]
- Lanner JT, Georgiou DK, Dagnino-Acosta A, Ainbinder A, Cheng Q, Joshi AD, Chen Z, Yarotskyy V, Oakes JM, Lee CS, Monroe TO, Santillán A, Dong K, Goodyear L, Ismailov II, Rodney GG, Dirksen RT, Hamilton SL. AICAR prevents heat-induced sudden death in RyR1 mutant mice independent of AMPK activation. Nat Med. 2012;18:244–251. doi: 10.1038/nm.2598. [DOI] [PMC free article] [PubMed] [Google Scholar]
- Launikonis BS, Zhou J, Royer L, Shannon TR, Brum G, Ríos E. Depletion “skraps” and dynamic buffering inside the cellular calcium store. Proc Natl Acad Sci U S A. 2006;103:2982–2987. doi: 10.1073/pnas.0511252103. [DOI] [PMC free article] [PubMed] [Google Scholar]
- López JR, Alamo LA, Jones DE, Papp L, Allen PD, Gergely J, Sreter FA. [Ca2+]i in muscles of malignant hyperthermia susceptible pigs determined in vivo with Ca2+ selective microelectrodes. Muscle Nerve. 1986;9:85–86. [PubMed] [Google Scholar]
- MacLennan DH, Zvaritch E. Mechanistic models for muscle diseases and disorders originating in the sarcoplasmic reticulum. Biochem Biophys Acta. 2011;1813:948–964. doi: 10.1016/j.bbamcr.2010.11.009. [DOI] [PubMed] [Google Scholar]
- Manno C, Sztretye M, Figueroa L, Allen PD, Ríos E. Dynamic measurement of the calcium buffering properties of the sarcoplasmic reticulum in mouse skeletal muscle. J Physiol. 2013;591:423–442. doi: 10.1113/jphysiol.2012.243444. [DOI] [PMC free article] [PubMed] [Google Scholar]
- Marty I, Faure J, Fourest-Lieuvin A, Vassilopoulos S, Oddoux S, Brocard J. Triadin: what possible function 20 years later. J Physiol. 2009;58:3117–3121. doi: 10.1113/jphysiol.2009.171892. [DOI] [PMC free article] [PubMed] [Google Scholar]
- Melzer W, Herrmann-Frank A, Lüttgau HC. The role of Ca2+ ions in excitation-contraction coupling of skeletal muscle fibres. Biochim Biophys Acta. 1995;1241:59–116. doi: 10.1016/0304-4157(94)00014-5. [DOI] [PubMed] [Google Scholar]
- Melzer W, Ríos E, Schneider MF. A general procedure for determining the rate of calcium release from the sarcoplasmic reticulum in skeletal muscle fibers. Biophys J. 1987;51:849–863. doi: 10.1016/S0006-3495(87)83413-6. [DOI] [PMC free article] [PubMed] [Google Scholar]
- Mitchell RD, Simmerman HK, Jones LR. Ca2+ binding effects on protein conformation and protein interactions of canine cardiac calsequestrin. J Biol Chem. 1988;263:1376–1381. [PubMed] [Google Scholar]
- Murphy RM, Larkins NT, Mollica JP, Beard NA, Lamb GD. Calsequestrin content and SERCA determine normal and maximal Ca2+ storage levels in sarcoplasmic reticulum of fast- and slow-twitch fibres of rat. J Physiol. 2009;15:443–460. doi: 10.1113/jphysiol.2008.163162. [DOI] [PMC free article] [PubMed] [Google Scholar]
- Palmer AE, Jin C, Reed JC, Tsien RY. Bcl-2-mediated alterations in endoplasmic reticulum Ca2+ analyzed with an improved genetically encoded fluorescent sensor. Proc Natl Acad Sci U S A. 2004;101:17404–17409. doi: 10.1073/pnas.0408030101. [DOI] [PMC free article] [PubMed] [Google Scholar]
- Pape PC, Fénelon K, Lamboley CRH, Stachura D. Role of calsequestrin evaluated from changes in free and total calcium concentrations in the sarcoplasmic reticulum of frog cut skeletal muscle fibres. J Physiol. 2007;581:319–367. doi: 10.1113/jphysiol.2006.126474. [DOI] [PMC free article] [PubMed] [Google Scholar]
- Pape PC, Jong DS, Chandler WK. Effects of partial sarcoplasmic reticulum calcium depletion on calcium release in frog cut muscle fibers equilibrated with 20 mM EGTA. J Gen Physiol. 1998;112:263–295. doi: 10.1085/jgp.112.3.263. [DOI] [PMC free article] [PubMed] [Google Scholar]
- Park H, Park IY, Kim E, Youn B, Fields K, Dunker AK, Kang C. Comparing skeletal and cardiac calsequestrin structures and their calcium binding: a proposed mechanism for coupled calcium binding and protein polymerization. J Biol Chem. 2004;279:18026–18033. doi: 10.1074/jbc.M311553200. [DOI] [PubMed] [Google Scholar]
- Park H, Wu S, Dunker AK, Kang C. Polymerization of calsequestrin. Implications for Ca2+ regulation. J Biol Chem. 2003;278:16176–16182. doi: 10.1074/jbc.M300120200. [DOI] [PubMed] [Google Scholar]
- Pizarro G, Ríos E. How source content determines intracellular Ca2+ release kinetics. Simultaneous measurement of [Ca2+] transients and [H+] displacement in skeletal muscle. J Gen Physiol. 2004;124:239–258. doi: 10.1085/jgp.200409071. [DOI] [PMC free article] [PubMed] [Google Scholar]
- Posterino GS, Lamb GD. Effect of sarcoplasmic reticulum Ca2+ content on action potential-induced Ca2+ release in rat skeletal muscle fibres. J Physiol. 2003;551:219–237. doi: 10.1113/jphysiol.2003.040022. [DOI] [PMC free article] [PubMed] [Google Scholar]
- Priori SG, Chen SRW. Inherited dysfunction of sarcoplasmic reticulum Ca2+ handling and arrhythmogenesis. Circ Res. 2011;108:871–883. doi: 10.1161/CIRCRESAHA.110.226845. [DOI] [PMC free article] [PubMed] [Google Scholar]
- Prosser B, Hernández-Ochoa E, Zimmer D, Schneider M. The Qγ component of intra-membrane charge movement is present in mammalian muscle fibres, but suppressed in the absence of S100A1. J Physiol. 2009;587:4523–4541. doi: 10.1113/jphysiol.2009.177238. [DOI] [PMC free article] [PubMed] [Google Scholar]
- Protasi F, Paolini C, Canato M, Reggiani C, Quarta M. Lessons from calsequestrin-1 ablation in vivo: much more than a Ca2+ buffer after all. J Muscle Res Cell Motil. 2011;32:257–270. doi: 10.1007/s10974-011-9277-2. [DOI] [PubMed] [Google Scholar]
- Rengifo J, Rosales R, Gonzalez A, Cheng H, Stern MD, Ríos E. Intracellular Ca2+ release as irreversible Markov process. Biophys J. 2002;83:2511–2521. doi: 10.1016/S0006-3495(02)75262-4. [DOI] [PMC free article] [PubMed] [Google Scholar]
- Ríos E. The cell boundary theorem: a simple law of the control of cytosolic calcium concentration. J Physiol Sci. 2010;60:81–84. doi: 10.1007/s12576-009-0069-z. [DOI] [PMC free article] [PubMed] [Google Scholar]
- Ríos E, Karhanek M, Ma J, González A. An allosteric model of the molecular interactions of excitation-contraction coupling in skeletal muscle. J Gen Physiol. 1993;102:449–481. doi: 10.1085/jgp.102.3.449. [DOI] [PMC free article] [PubMed] [Google Scholar]
- Roux-Buisson N, Cacheux M, Fourest-Lieuvin A, Fauconnier J, Brocard J, Denjoy I, Durand P, Guicheney P, Kyndt F, Leenhardt A, Le Marec H, Lucet V, Mabo P, Probst V, Monnier N, Ray PF, Santoni E, Trémeaux P, Lacampagne A, Fauré J, Lunardi J, Marty I. Absence of triadin, a protein of the calcium release complex, is responsible for cardiac arrhythmia with sudden death in human. Hum Mol Genet. 2012;21:2759–2767. doi: 10.1093/hmg/dds104. [DOI] [PMC free article] [PubMed] [Google Scholar]
- Royer L, Pouvreau S, Ríos E. Evolution and modulation of intracellular calcium release during long-lasting, depleting depolarization in mouse muscle. J Physiol. 2008;586:4609–4629. doi: 10.1113/jphysiol.2008.157990. [DOI] [PMC free article] [PubMed] [Google Scholar]
- Royer L, Sztretye M, Manno C, Pouvreau S, Zhou J, Knollmann BC, Protasi F, Allen PD, Ríos E. Paradoxical buffering of calcium by calsequestrin demonstrated for the calcium store of skeletal muscle. J Gen Physiol. 2010;136:325–338. doi: 10.1085/jgp.201010454. [DOI] [PMC free article] [PubMed] [Google Scholar]
- Samsó M, Wagenknecht T, Allen PD. Internal structure and visualization of transmembrane domains of the RyR1 calcium release channel by cryo-EM. Nat Struct Mol Biol. 2005;12:539–544. doi: 10.1038/nsmb938. [DOI] [PMC free article] [PubMed] [Google Scholar]
- Sánchez EJ, Lewis KM, Danna BR, Kang C. High-capacity Ca2+ binding of human skeletal calsequestrin. J Biol Chem. 2012;287:11592–11601. doi: 10.1074/jbc.M111.335075. [DOI] [PMC free article] [PubMed] [Google Scholar]
- Schuhmeier RP, Melzer W. Voltage-dependent Ca2+ fluxes in skeletal myotubes determined using a removal model analysis. J Gen Physiol. 2004;123:33–51. doi: 10.1085/jgp.200308908. [DOI] [PMC free article] [PubMed] [Google Scholar]
- Stern MD, Pizarro G, Ríos E. Local control model of excitation-contraction coupling in skeletal muscle. J Gen Physiol. 1997;110:415–440. doi: 10.1085/jgp.110.4.415. [DOI] [PMC free article] [PubMed] [Google Scholar]
- Sztretye M, Yi J, Figueroa L, Zhou J, Royer L, Ríos E. D4cpv-calsequestrin: a sensitive ratiometric biosensor targeted to the calcium store of skeletal muscle. J Gen Physiol. 2011a;138:211–229. doi: 10.1085/jgp.201010591. [DOI] [PMC free article] [PubMed] [Google Scholar]
- Sztretye M, Yi J, Figueroa L, Zhou J, Royer L, Allen P, Brum G, Ríos E. Measurement of RyR permeability reveals a role of calsequestrin in termination of SR Ca2+ release in skeletal muscle. J Gen Physiol. 2011b;138:231–247. doi: 10.1085/jgp.201010592. [DOI] [PMC free article] [PubMed] [Google Scholar]
- Tripathy A, Meissner G. Sarcoplasmic reticulum luminal Ca2+ has access to cytosolic activation and inactivation sites of skeletal muscle Ca2+ release channel. Biophys J. 1996;70:2600–2615. doi: 10.1016/S0006-3495(96)79831-4. [DOI] [PMC free article] [PubMed] [Google Scholar]
- Tung CC, Lobo PA, Kimlicka L, Petegem F. The amino-terminal disease hotspot of ryanodine receptors forms a cytoplasmic vestibule. Nature. 2010;468:585–588. doi: 10.1038/nature09471. [DOI] [PubMed] [Google Scholar]
- Wang Y, Xu L, Duan H, Pasek DA, Eu JP, Meissner G. Knocking down type 2 but not type 1 calsequestrin reduces calcium sequestration and release in C2C12 skeletal muscle myotubes. J Biol Chem. 2006;281:15572–15581. doi: 10.1074/jbc.M600090200. [DOI] [PubMed] [Google Scholar]
- Wang ZM, Messi ML, Delbono O. Patch-clamp recording of charge movement, Ca2+ current, and Ca2+ transients in adult skeletal muscle fibers. Biophys J. 1999;77:2709–2716. doi: 10.1016/s0006-3495(99)77104-3. [DOI] [PMC free article] [PubMed] [Google Scholar]
- Wang ZM, Tang S, Yang JJ, Delbono O. Residual sarcoplasmic reticulum Ca2+ concentration after Ca2+ release in skeletal myofibers from young adult and old mice. Pflugers Arch. 2012;463:615–624. doi: 10.1007/s00424-012-1073-3. [DOI] [PMC free article] [PubMed] [Google Scholar]
- Wu YC, Tucker T, Fettiplace R. A theoretical study of calcium microdomains in turtle hair cells. Biophys J. 1996;71:2256–2275. doi: 10.1016/S0006-3495(96)79429-8. [DOI] [PMC free article] [PubMed] [Google Scholar]
- Yang T, Riehl J, Estéve E, Matthaei KI, Goth S, Allen PD, Pessah IN, López JR. Pharmacologic and functional characterization of malignant hyperthermia in the R163C RyR1 knock-in mouse. Anesthesiology. 2006;105:1164–1175. doi: 10.1097/00000542-200612000-00016. [DOI] [PubMed] [Google Scholar]
- Yi J, Ma C, Li Y, Weisleder N, Ríos E, Ma J, Zhou J. Mitochondrial calcium uptake regulates rapid calcium transients in skeletal muscle during excitation-contraction (E-C) coupling. J Biol Chem. 2011;286:32436–32443. doi: 10.1074/jbc.M110.217711. [DOI] [PMC free article] [PubMed] [Google Scholar]
- Yuen B, Boncompagni S, Feng W, Yang T, López JR, Matthaei KI, Goth SR, Protasi F, Franzini-Armstrong C, Allen PD, Pessah IN. Mice expressing T4826I-RyR1 are viable but exhibit sex- and genotype-dependent susceptibility to malignant hyperthermia and muscle damage. FASEB J. 2012;26:1311–1322. doi: 10.1096/fj.11-197582. [DOI] [PMC free article] [PubMed] [Google Scholar]
- Zvaritch E, Depreux F, Kraeva N, Loy RE, Goonasekera SA, Boncompagni S, Kraev A, Gramolini AO, Dirksen RT, Franzini-Armstrong C, Seidman CE, Seidman JG, MacLennan DH. An Ryr1I4895T mutation abolishes Ca2+ release channel function and delays development in homozygous offspring of a mutant mouse line. Proc Natl Acad Sci U S A. 2007;104:18537–18542. doi: 10.1073/pnas.0709312104. [DOI] [PMC free article] [PubMed] [Google Scholar]
Associated Data
This section collects any data citations, data availability statements, or supplementary materials included in this article.