

Abstract
Sporadic Alzheimer’s disease (AD) patients have low amyloid-β peptide (Aβ) clearance in the central nervous system (CNS). The peripheral Aβ clearance may also be important but its role in AD remains unclear. We aimed to study the Aβ degrading proteases including insulin degrading enzyme (IDE), angiotensin converting enzyme (ACE) and others in blood. Using the fluorogenic substrate V—a substrate of IDE and other metalloproteases, we showed that human serum degraded the substrate V, and the activity was inhibited by adding increasing dose of Aβ. The existence of IDE activity was demonstrated by the inhibition of insulin, amylin or EDTA, and further confirmed by immunocapture of IDE using monoclonal antibodies. The involvement of ACE was indicated by the ability of the ACE inhibitor, lisinopril, to inhibit the substrate V degradation. To test the variations of substrate V degradation in humans, we used serum samples from a homebound elderly population with cognitive diagnoses. Compared with the elderly who had normal cognition, those with probable AD and amnestic mild cognitive impairment (amnestic MCI) had lower peptidase activities. Probable AD or amnestic MCI as an outcome remained negatively associated with serum substrate V degradation activity after adjusting for the confounders. The elderly with probable AD had lower serum substrate V degradation activity compared with those who had vascular dementia. The blood proteases mediating Aβ degradation may be important for the AD pathogenesis. More studies are needed to specify each Aβ degrading protease in blood as a useful biomarker and a possible treatment target for AD.
Keywords: Aβ, degradation, protease, insulin degrading enzyme, angiotensin convertingenzyme, serum, alzheimer’s disease
Introduction
The hallmark of Alzhiemer’s disease (AD) is the presence of extracellular amyloid-β peptide (Aβ) in the form of brain amyloid plaques and angiopathy [1]. The actual amount of neurotoxic Aβ in the brain is determined by the balance between the production of Aβ from the amyloid precursor protein (APP) processing and the degradation and clearance of Aβ after it is produced. Early onset AD patients have either increased overall Aβ production, especially the highly amyloidogenic, 42-amino-acid form of Aβ (Aβ42). However, the majority of AD cases is sporadic and late onset, and does not show increased Aβ production. Unlike early onset AD, sporadic AD patients have decreased clearance of Aβ in the central nervous system (CNS) [2]. Since Aβ can pass through the blood brain barrier (BBB) into the blood [3], and plasma Aβ levels are associated with the risk of AD [4], the peripheral Aβ clearance may also be important but its role in AD remains unclear. Using APP transgenic mice, an artificially engineered secreted protease, neprelysin, into blood can lower the AD pathology in the brain [5]. Thus the natural existing proteases in blood which can mediate the Aβ degradation could be of interest and importance in the AD pathogenesis.
Several proteases are shown to degrade Aβ including insulin degrading enzyme (IDE) [6–9], angiotensin converting enzyme (ACE) [10, 11], neprilysin and endothelin-converting enzyme-1 (ECE-1), but it is unclear whether all of them are present in blood. Neprilysin effectively degrades Aβ in vivo [12], however, most studies show that neprilysin is present within cells and thus may not exist in blood naturally. ECE–1 is shown to degrade Aβ [13] and could be a candidate protease to degrade Aβ in blood. Although ACE is well documented to be present in blood, it is unclear whether blood ACE mediates the Aβ degradation. Using cell cultures, IDE is found outside the cell and in the rough endoplasmic reticulum (RER) and the plasma membrane [8] [14, 15]. We identified intact IDE in human cerebral spinal fluid (CSF) [8], but it is still unknown whether IDE is secreted in human serum to be involved in the Aβ metabolism.
Substrate V, which is a short peptide, mimics Aβ to be an effective substrate of IDE in the cell culture [16] and can also serve as a substrate for recombinant ACE, ECE and neprilysin (manufacture information). In this study we used the fluorogenic substrate V, together with inhibitor profiling, to establish assays to examine the presence of these specific protease activities in human serum. Using homebound elderly subjects who had specific clinical diagnoses for cognitive impairments in a cross-sectional study, we aimed to explore whether serum protease activity, if proved to exist, is associated with the diagnosis of AD and the prodromal stage of AD. The homebound elderly population in the Boston area which we have been studying has high rates of dementia including AD and mild cognitive impairment (MCI) [17].
Materials
Materials
Fluorogenic substrate V, Mca-RPPGFSAFK (Dnp)-OH and recombinant human IDE (R&D System, Inc. Minneapolis, MN, USA), synthetic peptides of amylin, Aβ1–40 (Ana Spec, CA, USA) and insulin (Sigma, MO, USA), and the protease inhibitors of phosphoramidon disodium salt and lisinopril (Sigma, MO, USA) were obtained.
Characterizing Protease Activities Mediating Aβ Degradation in Human Serum
To characterize protease activity in human serum, we added 10 μM fluorogenic substrate V, Mca-RPPGFSAFK (Dnp)-OH [16].[18] to incubate with different amount of serum in the presence of PBS at 37°C for various periods of time. Fluorometry with excitation at 320 nm and emission at 405 nm was used to measure the fluorescent intensity. Each human serum sample was duplicated for each data point when using the NAME study samples described below.
The inhibition of IDE activity was examined by pre-incubation of insulin (10 μM) or amylin (10 μM) or EDTA (0.5 mM) at 37°C for 3 hours followed by adding 10 μM fluorogenic substrate V to be further incubated, and the fluorescent intensity was measured. Similarly, the activity of ECE was detected by pre-incubation of 1 or 10 μM phosphoramidon inhibitor; the activity of ACE was detected by pre-incubation of ACE inhibitor, lisinopril (10 μM). To prove that this substrate V assay could be used to evaluate Aβ degradation mediated by these proteases, we pre-incubated serum with 10 ng/ml synthetic Aβ1–40 at 37°C for 3 hours followed by adding substrate V and the continuation of incubation to examine the inhibition by Aβ. To calculate the inhibition, we used the plateau level of the fluorescent intensity with 6 μl of serum in the experiment as 100%. The relative levels of the fluorescent intensities in the absence of serum or in the presence of different inhibitors were divided by the plateau level and the percentages were calculated accordingly (Figures 2, 3B and 4).
Figure 2. Inhibition of substrate V degradation by A.
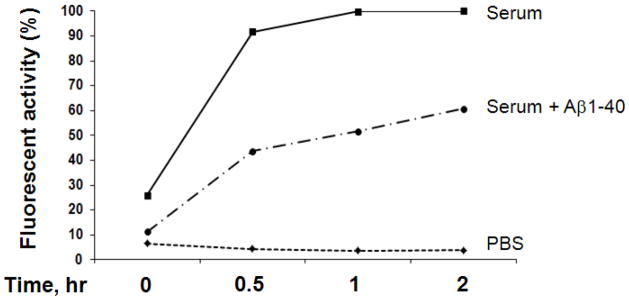
β
6 μl human serum was pre-incubated with Aβ1–40 (10 ng/ml) at 37°C for 3 hours then followed by adding substrate V for continuation of different time points and the generated fluorescence were measured.
Figure 3. Characterization of IDE in human serum.

Decreasing amounts of serum were detected for IDE using the human IDE specific antibody, 6H9, in Western Blot, and the cytosol IDE was used as a positive control (A). 6 μl human serum was pre-incubated with or insulin (10 μM) or amylin (10 μM) at 37°C for 3 hours then followed by adding substrate V for continuation of different time points and the generated fluorescence were measured (B). IDE molecules from different amounts serum were immunocaptured by IDE antibody, 6A1, followed by adding and incubating with substrate V at 37°C for 3 hours, and the generated fluorescence was measured in the presence of different inhibitors. The background fluorescence without serum was used as the standard 1 and the times of enhanced fluorescence generated by the presence of serum relative to the background were calculated and illustrated. Insulin, amylin, Aβ1–40 or EDTA was applied to the assay to observe the specific inhibition of IDE (C).
Figure 4. Characterization of IDE in human serum samples.

A set of 4 serum samples (6 μl) with low vs. a set of 4 serum samples (6 μl) with high substrate V degradation were compared (A). IDE molecules from these serum samples (50 μl) were immunocaptured by IDE antibody, 6A1, followed by adding and incubating with substrate V at 37°C for 3 hours, and the generated fluorescence was measured (B). These samples were detected for IDE using the human IDE specific antibody, 6H9, in Western Blot (C).
The presence of serum IDE was visualized by using Western Blot with human IDE specific antibody, 6H9, and the recombinant IDE (lane 1) was used as a control (Figure 3A). To specifically determine whether Aβ degrading activity in serum was IDE, plates were coated with IDE 6A1 antibody [19] overnight at 4°C. Serum samples (50 μl) were loaded and incubated overnight at 4°C followed by washing with ice-cold PBS for 6 times for the immunocapture of IDE and then adding the fluorogenic substrate V to further incubate at 37°C for overnight before the measurement of the fluorescent intensity. To confirm the specific IDE activity, the immunocaptured IDE was pre-incubations with EDTA, insulin, amylin or Aβ at 37°C for 3 hours before adding substrate V in the assay described above. Each sample assay was repeated 3 times for each data point. To evaluate the relative increase of IDE activity, we treated the background fluorescence (in the absence of serum) as one and the relative increase of fluorescent intensity with immunocaptured IDE to the background level was calculated under each experimental condition (Figure 3C).
Other measurements
A 244 bp of the ApoE gene, which included the two polymorphic sites was amplified by PCR using a robotic Thermal Cycler (ABI 877, Perkin-Elmer/ Applied Biosystems). The PCR products were digested with 5 units of Hha I, and the fragments were separated by electrophoresis. The allelic fragments were: E2,; E3, and E4. ApoE4 was defined by E4/4, E3/4 or E2/4. Plasma insulin concentrations were measured by radioimmunoassay in the clinical laboratory at Tufts Medical Center. ELISA was used to measure amylin concentration in plasma according to the manufacture’s instructions (LINCO Research, St. Charles, Missouri).
Study Sample and Diagnoses
We studied a subgroup of 352 subjects, who underwent clinical evaluation by physicians, including brain MRI, from a population-based study, the Nutrition, Aging and Memory in the Elderly (NAME) study [20]. The NAME study was based on the clients of four homecare agencies for the city of Boston. Anyone receiving homecare services is registered with one of these agencies if he/she lives in the city of Boston, has an annual income < $18,890 and needs homecare service. All homebound elders aged 60 and older receiving services from the four agencies were invited to participate in the study. Of all eligible subjects, 66% enrolled in the study, and gave informed consent approved by the Institutional Review Boards of Tufts University New England Medical Center [21] and Boston University. Those with Mini-Mental State Examination (MMSE) ≤ 10 or verbal IQ < 75 were not eligible to continue in the study. 1262 subjects completed the neuropsychological evaluation during the home visits and were asked whether they would be willing to participate in the second phase of the study, which was to undergo brain MRI. Of this number, 352 agreed and were recruited.
Diagnosis of Dementia
The diagnosis of dementia was based on the DSM-IV criteria. NINCDS-ADRDA guidelines [22] were used to determine if the criteria was met for a diagnosis of possible or probable AD. Possible AD is marked by differences in clinical features and course in addition to the MRI imaging data so that the etiology of dementia is not certain for AD compared with probable AD. The major feature of possible AD in our study sample was the presence of cerebrovascular pathology. NINDS-AIREN criteria was used for the diagnosis of possible or probable vascular dementia [23].
Diagnosis of MCI
The diagnostic criteria for MCI were based on Petersen et al. 1999 guidelines with some modifications to broaden the concept of MCI [24]: 1) no dementia; 2) self-reported forgetfulness in daily activities or for recent events; 3) normal general cognitive functioning as assessed by the MMSE, that is, a score less than 1 SD below the mean of an age- and education-matched sample after exclusion of present dementia at entry; 4) objective memory impairment or impairment in other cognitive domains as assessed by performance on neuropsychological tests not more than 1.5 SD from the mean of an age- and education-matched sample; 5) ability to independently perform basic activities of daily living. The neuropsychological battery included WMS-III Word List Learning, WMS-III Logical Memory, verbal fluency, WAIS-III Block Design, WAIS-III Digit Span, and Trails A and Trails B. Those with memory impairment only or cognitive impairment including memory and other domains were considered to have amnestic MCI; those without forgetfulness and with impairments in other cognitive domains, such as executive and visuospatial dysfunction, were considered to have non-amnestic MCI.
Definition of the Controls
Subjects were considered cognitively intact if they were not demented and scored no more than 1 SD below the mean of age and education defined strata on MMSE and no more than 1.5 SD below the mean of age and education defined strata on the neuropsychological tests.
Brain MRI and volumetric measurements
MRI scans were performed on a 1.5 Tesla magnet (Siemens’ Symphony; Islin, NJ). All subjects had the following imaging protocol: 1) Intermediate (TE=20 ms) and T2-weighted (TE=80 ms) conventional spin-echo axial images (TR=3000 ms); 2) Fluid Attenuation Inversion Recovery (FLAIR) axial images; 3) Magnetization Prepared Rapid Acquisition Gradient Echo (MPRAGE) coronal 3D images with section thickness of 1.5 mm [25].
The study radiologist evaluated images for the presence of brain infarcts including large and small vessel infarcts. Large vessel infarcts were defined as infarcts larger than 1.5 cm in size or in a major vascular territory such as cortex [25]. Small vessel infarcts were in the subcortical region and defined as a focal brain lesion hyperintense on T2-weighted images with a minimum diameter of 3 mm and a maximum diameter of 1.5 cm.
All Images were analyzed using image analysis software (AnalyzeDirect, Inc. Overland, KS) by trained readers/analysts who were blinded to the subjects’ clinical status and under the supervision of a board-certified neuroradiologist (R.B.) [25]. The margins of hippocampus and amygdala were traced by a mouse-driven cursor on consecutive images of MPRAGE 3D sequence on which these structures were seen. For volume measurement, ANALYZE software was used to count the number of voxels within each slice and multiplied by voxel volume to derive a numeric value in cubic millimeters. Measurements were made on both sides. The boundaries of amygdala were defined by gray/white matter borders, by CSF in the uncal cistern, or by uncal recess of the temporal horn or the alveus covering the hippocampal head, as appropriate. The anterior boundaries of the hippocampus were defined by the dentate gyrus and the subiculum, and were separated from the amygdala by visualizing either the shape of hippocampal digitations and the uncal recess of the temporal horn or by the high signal-intensity generated by the white matter of alveus. The posterior boundary of the hippocampus was chosen at the level where both cruces of the fornix were seen [25]. The volumes (left + right sides) of amygdala or hippocampus were normalized by the total intracranial volume to compensate for variations in total brain size [25]. The measurements of hippocampal and amygdala volumes had an inter-reader correlation of 0.92 (p<0.001).
Statistical Analysis
Statistical analysis was performed using SAS (version 9.1, SAS Institute Inc., Cary, North Carolina). To compare Aβ degradation and other key variables between the control subgroup and another diagnostic subgroup, mean ± SD and T-test were used for the variables with a normal distribution, and median (Q1, Q3) and Wilcoxon rank sum test were used for the variables with a skewed distribution. Chi-square test was applied to evaluate frequencies. Multivariate linear regression was performed to evaluate the association between a diagnosis as an outcome and serum substrate V degradation after adjusting for potential confounding by age, gender, ethnicity, BMI, education and ApoE4. For all analyses, level of significance was α = 0.05.
Results
Amino acid sequences of insulin, amylin, Aβ and substrate V, Mca-RPPGFSAFK, are compared (Figure 1A). The cleavage sites of Aβ by IDE and ACE in the alignment of the substrate V sequences are shown. The fluorogenic substrate V was incubated with decreasing amounts of serum from 95 to 1.5 μl at 37°C for different periods of time, but only 0 and 24 hours were shown (Figure 1B). The conditioned medium (CM) of BV-2 microglial cells, which release a high level of IDE to degrade Aβ [8], was used as a positive control. Relative to the time 0, a large magnitude of fluorescence was generated at 24 hours when 1.5–12 μl serum was used in this experiment. In contrast, when 24–95 μl serum was used, there was little or no difference in the fluorescence generated between time 0 and 24 hours. This could be attributed by the endogenous fluorogenic activity in serum which caused high background fluorescence or due to some endogenous inhibitors of proteases in serum to inhibit fluorescence generation. To examine whether this substrate V assay could reflect the degradation of Aβ in serum, serum (6 μl) was pre-incubated with synthetic Aβ1–40 (10 ng/ml) followed by adding substrate V for additional incubation. We observed a decrease of fluorescence (40%) in a time-dependent pattern compared to the absence of Aβ in the pre-incubation (Figure 2).
Figure 1. Serum activity of substrate V degradation.

The sequences of insulin, amylin and Aβ1–40 along with the sequence of substrate V are shown and compared (A). Cleavage sites of Aβ1–40 by IDE (yellow) and ACE (red) are illustrated. Different amounts of serum were incubated with substrate V at 37°C for time 0 and 24 hours (24 hr) and the degradation activity assessed by the fluorescence generation (B). BV-2 condition medium (CM) was used as a positive control.
To illustrate the presence of IDE in human serum, different amounts of serum were loaded and the specific band was shown with human IDE specific antibody, 6H9, in a western blot (Figure 3A), to be consistent with the cytosol IDE in size. To further show that IDE was involved in the substrate V degradation, serum (6 μl) was pre-incubated with 10 μM of insulin or amylin, both are the substrates of IDE, followed by adding substrate V to examine the degradation. We observed a marked decrease of fluorescence in a time-dependent pattern (Figure 3B). To confirm that IDE is present in serum and serves as a secreted protease to degrade Aβ, we used a 96 well plate coated with the IDE specific antibody, 6A1 [19], to do an immunocapture of IDE in human serum, followed by incubation with substrate V at 37°C for different times. The result of this experiment revealed a dose-dependent fluorogenic activity in serum and inhibition by Aβ1–40 (Figure 3C). The immunocaptured IDE activity was inhibited by pre-incubation of EDTA, insulin, and amylin, further confirming that the fluorescence generated was indeed mediated by IDE in human serum. Another IDE antibody, 6H9, was used to confirm this result, in contrast, an unrelated antibody did not show any activity in the immunocapture assay (data not shown).
A set of 4 serum samples with low vs. another set of 4 serum samples with high substrate V degradation activities were chosen and compared (Figure 4A). The immunocaptured IDE activities from these samples (Figure 4B) and the Western Blot of these samples (Figure 4C) were paralleled to their serum substrate V degradation abilities. However, while the average of serum substrate V degradation in the high activity samples were more than double the one in the low activity samples, the average of immunocaptured IDE activity in the high activity samples was only approximately 20% more than the one in the low activity samples, suggesting other serum protease(s) involved in the substrate V degradation. The substrate V serves as a substrate for other metelloproteases including ACE, ECE-1 and neprilysin, and we applied a variety of specific inhibitors to this assay to differentiate the activities of these proteases in serum. Lisinopril (10 μM), an ACE inhibitor, was applied to the reaction and revealed significant inhibition of substrate V degradation (Figure 5A), indicating the involvement of ACE in the assay. In contrast, phosphoramidon (1 μM), a specific inhibitor for ECE-1 and NEP, did not inhibit the degradation of substrate V in this assay (Figure 5B). Other metalloprotease inhibitors such as EDTA (Figure 5B) also inhibited the serum degradation in this assay. Additionally, the MMP inhibitor, FN-439, did not inhibit this activity (data not shown). All of this data suggested that both IDE and ACE were the major proteases in serum to mediate the degradation of substrate V.
Figure 5. Characterization of ACE and other protease activities in human serum.

6 μl human serum was pre-incubated with ACE inhibitor, Lisinopril, at 37°C for 3 hours then followed by adding substrate V for continuation of different time points and the generated fluorescence were measured (A). 6 μl human serum was pre-incubated with phospheramidon, the inhibitor of neprilysin and ECE-1, or EDTA at 37°C for 3 hours then followed by adding substrate V for continuation of different time points and the generated fluorescence were measured (B).
To study whether the protease activity of substrate V degradation reflecting the Aβ degradation would reveal variations in human samples for an AD diagnosis, we performed this substrate V assay using human serum samples with different clinical diagnoses. The individuals with the serum samples were from a population-based study, the NAME study, and were examined by physicians to receive a consensus diagnosis on cognition (n = 365) [20]. The clinical diagnoses included the control with normal cognition (n = 159), amnestic MCI (n = 19), probable AD (n = 16), possible AD (n = 32) and vascular dementia (n = 24) (Table 1). These subjects had a brain MRI, and the brain volumetric measurements were consistent with the diagnoses of amnestic MCI and probable AD (Table 2). Compared to the elderly with normal cognitive function, those with probable AD were older, and a higher percentage of these subjects were African Americans and had lower education. Compared with the control group, there were more males in the group of amnestic MCI. There were no differences of ApoE4 alleles, BMI, diabetes, ACE inhibitor or insulin use, or concentrations of IDE substrates including insulin and amylin across all the diagnostic groups.
Table 1.
General information of the study sample
| N = 365
|
|
|---|---|
| Age, year, Mean ± SD | 73.2 ± 8.3 |
| Female, n/total (%) | 266/365 (73%) |
| African American, n/total (%) | 130/365 (36%) |
| High School and above, years, n/total (%) | 274/364 (75%) |
| ApoE4, n/total (%) | 89/355 (25%) |
| BMI, Mean ± SD | 30.9 ± 7.9 |
| Diabetes, n/total (%) | 111/351 (32%) |
| ACE inhibitor use, n/total (%) | 136/362 (38%) |
| Insulin use, n/total (%) | 20/362 (6%) |
| Amnestic MCI, n/total (%) | 19/364 (5%) |
| Non-Amnestic MCI, n/total (%) | 101/365 (28%) |
| Dementia, n/total (%) | 89/365 (24%) |
| Probable AD, n/total (%) | 16/89 (18%) |
| Possible AD, n/total (%) | 32/89 (36%) |
| Vascular dementia, n/total (%) | 24/89 (26%) |
| Other dementia, n/total (%) | 17/89 (19%) |
Table 2.
Comparisons among those with normal cognition, amnestic MCI and probable AD in the homebound elderly
| Normal controls N =159 |
Amnestic MCI N =19 |
Probable AD N = 16 |
Vas Dementia N =22 |
|
|---|---|---|---|---|
| Age, year, Mean ± SD | 72.0 ± 7.9 | 75.6 ± 8.3 | 80.5 ± 9.4** | 73.4 ± 7.8 |
| Female, n/total (%) | 121/159 (76%) | 8/16 (50%)* | 12/16 (75%) | 10/22 (45%)** |
| African American, n/total (%) | 43/159 (27%) | 3/16 (19%) | 9/16 (56%) | 7/22 (32%) |
| High School and above, n/total (%) | 122/159 (77%) | 14/16 (88%) | 7/15 (47%)*** | 18/22 (82%) |
| ApoE4 , n/total (%) | 34/155 (22%) | 5/15 (33%) | 6/16 (38%) | 4/21 (19%) |
| BMI, Mean ± SD | 30.8 ± 7.8 | 32.6 ± 8.8 | 28.5 ± 4.7 | 29.7 ± 3.5 |
| Medical Condition | ||||
| Diabetes, n/total (%) | 48/155 (31%) | 6/16 (38%) | 4/16 (25%) | 10/21 (48%) |
| Insulin use, n/total (%) | 9/156 (6%) | 1/16 (6%) | 1/16 (6%) | 0/21 (0%) |
| Insulin, pM/L, median (IQR) | 73.2 (47.3, 119.0) | 86.2 (33.8, 153.5) | 73.3 (26.2, 94.8) | 80.9 (42.4, 143.7) |
| Amylin, median, pg/ml, median (IQR) | 22.3 (11.2, 43.1) | 19.3 (11.8, 65.5) | 18.7 (11.2, 38.9) | 28.1 (10.1, 52.2) |
| ACE inhibitor use, n/total (%) | 58/159 (36) | 5/16 (31%) | 6/16 (38%) | 11/22 (50%) |
| Neuropsychological Scores | ||||
| MMSE Score, mean ± SD | 27.1 ± 2.5 | 25.9 ± 2.6* | 20.7 ± 3.4*** | 23.5 ± 2.2*** |
| LM Delayed Recall, mean ± SD | 23.7 ± 8.8 | 13.8 ± 7.9*** | 5.9 ± 5.7*** | 12.7 ± 7.7*** |
| WLL Delayed Recall, mean ± SD | 5.3 ± 2.8 | 1.9 ± 2.0*** | 0.9 ± 1.3*** | 1.9 ± 2.2*** |
| Trails B, mean ± SD | 147.0 ± 68.3 | 164.7 ± 81.1 | 284.5 ± 37.3*** | 245.4 ± 70.2*** |
| Brain Volumes | ||||
| Total brain volume, L, mean ± SD | 1.1 ± 0.1 | 1.0 ± 0.1 | 1.0 ± 0.1 | 1.0 ± 0.1 |
| With large vessel infarcts, n/total (%) | 11/151 (7%) | 0/16 (0%) | 1/17 (7%) | 8/21 (38%)*** |
| With small vessel infarcts, n/total (%) | 24/151 (16%) | 0/16 (0%) | 1/15 (7%) | 12/21 (57%)*** |
| Hippocampal volume, ml, mean ± SD | 5.2 ± 0.8 | 5.4 ± 1.0 | 4.3 ± 0.8** | 5.1 ± 0.8 |
| Amygdala volume, ml, mean ± SD | 4.0 ± 0.8 | 3.9 ± 0.9 | 2.8 ± 0.6*** | 4.0 ± 0.9 |
Mean ± SD with t Test or n/total (%) with Chi-Square test is presented. To compared with subjects with normal cognition,
P ≤ 0.05;
P ≤ 0.001;
P ≤ 0.0001 are shown for significance
The fluorescence generated by adding substrate V to the serum samples was measured and plotted for each participant and compared by diagnostic status (Figure 6). The average serum substrate V degradation for 24 hours (mean ± SD) in the probable AD group (40752.9 ± 7584.5, p = 0.0001) or in the amnestic MCI group (43720.6 ± 6129.9, p = 0.02) was significantly lower than in the control group (48138.4 ± 8651.3). One serum sample was measured in each batch of measurements and used as a control, equivalent to 1 unit (U), to adjust all the samples. Multivariate regression analysis showed that probable AD (β = −0.194, SE = 0.077, p = 0.01) or amnestic MCI (β = −0.182, SE = 0.084, p = 0.03) as an outcome remained negatively associated with adjusted serum substrate V degradation (U) after adjusting for age, gender, ethnicity, education, ApoE4, BMI and infarcts (Table 3A). In the same model, adding ACE inhibitor use or diabetes and insulin use did not affect the relationship between probable AD and substrate V degradation; adding the concentrations of insulin and amylin strengthened the relationship (β = −0.214, SE = 0.079, p = 0.007) (Table 3B).
Figure 6. Measurements of substrate V degradation activity in probable AD, amnestic MCI and the controls.

6 μl serum samples were incubated with substrate V at 37°C for 24 hours and the generated fluorescence were measured. The average number from the duplicates of each individual sample in the subgroups of the control, amnestic MCI and probable AD was calculated and illustrated.
Table 3.
| Table 3A. The association between serum substrate V degradation and amnestic MCI, or probable AD or vascular dementia
| |||||||||
|---|---|---|---|---|---|---|---|---|---|
| Amnestic MCI (N = 295) | Probable AD (N = 295) | Vascular Dementia (N = 294) | |||||||
| β Estimate | SE | P value | β Estimate | SE | P value | β Estimate | SE | P value | |
| Age, year | + 0.002 | 0.002 | 0.13 | + 0.004 | 0.001 | 0.003 | − 0.001 | 0.003 | 0.80 |
| Female | − 0.091 | 0.029 | 0.002 | + 0.021 | 0.027 | 0.44 | − 0.091 | 0.053 | 0.09 |
| African American | − 0.010 | 0.008 | 0.26 | + 0.008 | 0.007 | 0.29 | + 0.009 | 0.015 | 0.54 |
| School, year | + 0.001 | 0.004 | 0.87 | − 0.013 | 0.004 | 0.001 | + 0.001 | 0.007 | 0.88 |
| BMI | + 0.005 | 0.002 | 0.002 | − 0.002 | 0.002 | 0.12 | + 0.002 | 0.003 | 0.30 |
| ApoE4 | + 0.017 | 0.029 | 0.56 | + 0.032 | 0.026 | 0.24 | + 0.004 | 0.053 | 0.95 |
| Infarcts, number | − 0.025 | 0.012 | 0.03 | − 0.018 | 0.011 | 0.098 | + 0.148 | 0.021 | <0.0001 |
| Substrate V degradation, 1U | − 0.182 | 0.084 | 0.03 | − 0.194 | 0.077 | 0.01 | − 0.048 | 0.152 | 0.75 |
| Table 3B. The association between serum substrate V degradation and probable AD as an outcome
| |||||||||
|---|---|---|---|---|---|---|---|---|---|
| Probable AD (N = 294) | Probable AD (N = 292) | Probable AD (N = 277) | |||||||
| β Estimate | SE | P value | β Estimate | SE | P value | β Estimate | SE | P value | |
| Substrate V degradation, 1U | − 0.195 | 0.077 | 0.01 | − 0.197 | 0.078 | 0.01 | − 0.214 | 0.079 | 0.007 |
| ACE inhibitor use | + 0.017 | 0.024 | 0.49 | + 0.015 | 0.024 | 0.54 | − 0.020 | 0.025 | 0.43 |
| Diabetes | - | - | - | + 0.002 | 0.029 | 0.95 | + 0.004 | 0.023 | 0.90 |
| Insulin use | - | - | - | + 0.026 | 0.053 | 0.62 | + 0.024 | 0.054 | 0.66 |
| Insulin | - | - | - | - | - | - | + 0.00004 | 0.00008 | 0.61 |
| Amylin | - | - | - | - | - | - | + 0.00007 | 0.0001 | 0.59 |
One serum sample was measured in each batch of measurements and used as a control to adjust all the samples. The control serum degradation activity/in each measurement =1 and was equivalent to 1 unit (U). 3B was adjusted for age, gender, race, school, BMI, ApoE4 and infarct numbers.
The average serum substrate V degradation (mean ± SD) in the probable AD group was significantly lower when compared with the vascular dementia group (40752.9 ± 7584.5 vs. 48680.2 ± 5830.0, p = 0.002) (Figure 7). After adjusting for age, gender, ethnicity, education, ApoE4 and BMI, multivariate regression analysis showed that unlike probable AD, vascular dementia was not associated with adjusted serum degradation activity, but with brain infarcts (Table 3A). In the same model, the infarct number was negatively associated with amnestic MCI as an outcome of this study sample.
Figure 7. Measurements of substrate V degradation activity in probable AD and vascular dementia.

6 μl serum samples were incubated with substrate V at 37°C for 24 hours and the generated fluorescence were measured. The average number from the duplicates of each individual sample in the subgroups of probable AD vs. vascular dementia was calculated and illustrated.
Discussion
Considering that there will be 16–18 million AD patients by 2050 in the US alone, it is necessary and pressing to develop some simple diagnostic or screen tests using a peripheral blood sample for the disease. Although the current substrate V assay may not yet serve as a diagnosis test for the disease, our data at least suggested that the serum Aβ degradation activity is worthy and needed to be further studied for AD as Aβ clearance in CNS is impaired in sporadic AD [2]. To the best of our knowledge, this study was the first to show that IDE and ACE are the major proteases in serum to mediate substrate V degradation, which can reflect the Aβ degradation mediated by these proteases. Elderly patients with probable AD and prodromal stage of AD had lower substrate V degradation in serum than those with normal cognition, probably indicating low serum Aβ degradation in the disease. Additionally, the serum substrate V degradation assay may be useful to help differentiate AD from vascular dementia.
Our data demonstrated that IDE is one of the proteases to mediate Aβ degradation in serum (Figure 2C). IDE has been shown to degrade Aβ [6, 8] and to influence brain Aβ levels in vivo [26]. Our previous study showed the presence of IDE in human CSF [8] and the data from this study demonstrated the existence of IDE in serum (Figure 3). Since extracellular Aβ aggregation is the hallmark of AD pathology and Aβ is not found in cytosol, extracellular IDE may play a key role in the clearance of Aβ and can relate to the AD pathology. IDE can be secreted through an exosome [27] and is regulated by nerve growth factor in PC12 cells [14]. The statin treatment enhances IDE secretion without affecting its expression [28]. ApoE is a secreted lipid protein in the extracellular compartment and enhances IDE activity [29], and the major risk factor of AD. Compared to ApoE 2 or ApoE3 alleles, ApoE4 has the least enhancement to IDE activity.
Our study demonstrated the involvement of ACE in the serum Aβ degradation (Figure 5). ACE degrades Aβ and reduces Aβ aggregation [10]; ACE also converts Aβ42 to Aβ40 [30]. While some studies have demonstrated that blood ACE activity is associated with AD [31] and the age of AD onset [32], other studies do not show the difference between AD and the controls [33]. One study shows that long term (6 months) use of ACE inhibitor, Captapril, increases Aβ deposition in the brain of the APP transgenic mice [34].
As substrate V was degraded by the proteases like IDE and ACE that were inhibited by adding Aβ, we were able to establish a simple and non-invasive assay and demonstrate that there is Aβ degradation activity mediated by these proteases in human serum (Figures 1 and 2). Other studies have shown that impaired clearance of Aβ in AD is probably caused by decreased catabolism of Aβ via reduced proteolysis or microglial phagocytosis, or by impaired transport across the blood-brain barrier into the blood [35]. Our study showed that, compared to the elderly with normal cognition, those with amnestic MCI and probable AD had lower Aβ degradation activity in blood (Figures 6 and 7). Minors et al. found that the immunocaptured IDE activity from the AD brain tissue is higher, not lower, than the controls [36]. The same study failed to find any difference in the ACE activity between AD and the controls. One possibility is that Aβ catabolizing proteases interact with other factors to cause AD. For example, other substrates of IDE, like insulin and amylin in type 2 diabetes, could compete with Aβ for the IDE degradation, but the immunocaptured IDE cannot illustrate the competition for the enzyme. The presence of ACE inhibitor, which is a common antihypertensive medication, or its effects on ACE activity in the brain, can also not be observed in the immunocapture assay. While some genetic studies show that AD is related to IDE and ACE polymorphisms, other studies do not show the same relationship [37], suggesting that the interaction between these genes and other factors may be crucial for the disease.
In this study sample vascular dementia (Figure 7) had higher serum substrate V degradation than those with probable AD with no or very little cerebrovascular pathology. Increased ACE expression leads to cardiovascular pathology [38], which is associated with cerebrovascular pathology and vascular dementia. Endothelial cells express IDE which mediates Aβ degradation [39]. One study shows that cerebral ischemic insult to rats results in increased expression of IDE [40]. Another study shows that statin increases IDE secretion [28], and many patients with vascular diseases are treated with statins. The homebound elderly population we used for this study had high rates of cerebrovascular and cardiovascular pathologies [17]. Although it is unclear if ACE or IDE is increased in cerebrovascular pathology, the serum substrate V degradation assay could be useful to differentiate AD from vascular dementia. However, this assay may be limited in its ability to detect AD comorbid with cerebrovascular pathology.
This study has other limitations. Substrate V is not specific for one particular protease, but the advantage of substrate V is to specifically rule in few proteases for the Aβ degradation in blood. The assay could not detect all the proteases involved in the Aβ degradation. Some elderly with normal cognition still had low substrate V degradation in our study sample (Figure 6); thus this may not serve as a diagnostic assay and without a longitudinal study we cannot yet conclude that this assay can be a prognostic biomarker of AD. Nevertheless, our discoveries have found the existence of IDE plus ACE to be involved in the Aβ catabolism in human serum, which may lead to a new target for the AD treatment. One recent study illustrates that engineered recombinant neprelysin which can be secreted into blood can lower the brain AD pathology in APP transgenic mice [5]. Our study warrants prospective studies to examine whether peripheral substrate V degradation mediated by IDE and ACE is related to brain pathology, and predicts the onset of cognitive decline and AD in this and other populations.
Acknowledgments
The authors are grateful to Dr. Marshal Folstein for his support and insight on this research. We thank the NAME study staff and the Boston homecare agencies for their hard work and acquisition of subjects. We also thank Max Wallack for editing the manuscript. This work was supported by grants from NIA, K23 AG-022476 and RO1 AG031171 (W.Q.Q).
References
- 1.Selkoe DJ. Biochemistry and molecular biology of amyloid beta-protein and the mechanism of Alzheimer’s disease. Handb Clin Neurol. 2008;89:245–260. doi: 10.1016/S0072-9752(07)01223-7. [DOI] [PubMed] [Google Scholar]
- 2.Mawuenyega KG, Sigurdson W, Ovod V, Munsell L, Kasten T, Morris JC, Yarasheski KE, Bateman RJ. Decreased clearance of CNS beta-amyloid in Alzheimer’s disease. Science. 330:1774. doi: 10.1126/science.1197623. [DOI] [PMC free article] [PubMed] [Google Scholar]
- 3.Deane R, Wu Z, Sagare A, Davis J, Du Yan S, Hamm K, Xu F, Parisi M, LaRue B, Hu HW, Spijkers P, Guo H, Song X, Lenting PJ, Van Nostrand WE, Zlokovic BV. LRP/amyloid beta-peptide interaction mediates differential brain efflux of Abeta isoforms. Neuron. 2004;43:333–344. doi: 10.1016/j.neuron.2004.07.017. [DOI] [PubMed] [Google Scholar]
- 4.Graff-Radford NR, Crook JE, Lucas J, Boeve BF, Knopman DS, Ivnik RJ, Smith GE, Younkin LH, Petersen RC, Younkin SG. Association of low plasma Abeta42/Abeta40 ratios with increased imminent risk for mild cognitive impairment and Alzheimer disease. Arch Neurol. 2007;64:354–362. doi: 10.1001/archneur.64.3.354. [DOI] [PubMed] [Google Scholar]
- 5.Liu Y, Studzinski C, Beckett T, Murphy MP, Klein RL, Hersh LB. Circulating neprilysin clears brain amyloid. Mol Cell Neurosci. 2010;45:101–107. doi: 10.1016/j.mcn.2010.05.014. [DOI] [PMC free article] [PubMed] [Google Scholar]
- 6.Kurochkin IV, Goto S. Alzheimer’s beta-amyloid peptide specifically interacts with and is degraded by insulin degrading enzyme. FEBS Lett. 1994;345:33–37. doi: 10.1016/0014-5793(94)00387-4. [DOI] [PubMed] [Google Scholar]
- 7.McDermott JR, Gibson AM. Degradation of Alzheimer’s beta-amyloid protein by human and rat brain peptidases: involvement of insulin-degrading enzyme. Neurochem Res. 1997;22:49–56. doi: 10.1023/a:1027325304203. [DOI] [PubMed] [Google Scholar]
- 8.Qiu WQ, Walsh DM, Ye Z, Vekrellis K, Zhang J, Podlisny MB, Rosner MR, Safavi A, Hersh LB, Selkoe DJ. Insulin-degrading enzyme regulates extracellular levels of amyloid beta-protein by degradation. J Biol Chem. 1998;273:32730–32738. doi: 10.1074/jbc.273.49.32730. [DOI] [PubMed] [Google Scholar]
- 9.Shen Y, Joachimiak A, Rosner MR, Tang WJ. Structures of human insulin-degrading enzyme reveal a new substrate recognition mechanism. Nature. 2006;443:870–874. doi: 10.1038/nature05143. [DOI] [PMC free article] [PubMed] [Google Scholar]
- 10.Hu J, Igarashi A, Kamata M, Nakagawa H. Angiotensin-converting enzyme degrades Alzheimer amyloid beta-peptide (A beta); retards A beta aggregation, deposition, fibril formation; and inhibits cytotoxicity. J Biol Chem. 2001;276:47863–47868. doi: 10.1074/jbc.M104068200. [DOI] [PubMed] [Google Scholar]
- 11.Hemming ML, Selkoe DJ. Amyloid beta-protein is degraded by cellular angiotensin-converting enzyme (ACE) and elevated by an ACE inhibitor. J Biol Chem. 2005;280:37644–37650. doi: 10.1074/jbc.M508460200. [DOI] [PMC free article] [PubMed] [Google Scholar]
- 12.Iwata N, Tsubuki S, Takaki Y, Watanabe K, Sekiguchi M, Hosoki E, Kawashima-Morishima M, Lee HJ, Hama E, Sekine-Aizawa Y, Saido TC. Identification of the major Abeta1–42-degrading catabolic pathway in brain parenchyma: suppression leads to biochemical and pathological deposition. Nat Med. 2000;6:143–150. doi: 10.1038/72237. [DOI] [PubMed] [Google Scholar]
- 13.Gao W, Eisenhauer PB, Conn K, Lynch JA, Wells JM, Ullman MD, McKee A, Thatte HS, Fine RE. Insulin degrading enzyme is expressed in the human cerebrovascular endothelium and in cultured human cerebrovascular endothelial cells. Neurosci Lett. 2004;371:6–11. doi: 10.1016/j.neulet.2004.07.034. [DOI] [PubMed] [Google Scholar]
- 14.Vekrellis K, Ye Z, Qiu WQ, Walsh D, Hartley D, Chesneau V, Rosner MR, Selkoe DJ. Neurons regulate extracellular levels of amyloid beta-protein via proteolysis by insulin-degrading enzyme. J Neurosci. 2000;20:1657–1665. doi: 10.1523/JNEUROSCI.20-05-01657.2000. [DOI] [PMC free article] [PubMed] [Google Scholar]
- 15.Leissring MA, Farris W, Wu X, Christodoulou DC, Haigis MC, Guarente L, Selkoe DJ. Alternative translation initiation generates a novel isoform of insulin-degrading enzyme targeted to mitochondria. Biochem J. 2004 doi: 10.1042/BJ20041081. [DOI] [PMC free article] [PubMed] [Google Scholar]
- 16.Ralat LA, Ren M, Schilling AB, Tang WJ. Protective role of Cys-178 against the inactivation and oligomerization of human insulin-degrading enzyme by oxidation and nitrosylation. J Biol Chem. 2009;284:34005–34018. doi: 10.1074/jbc.M109.030627. [DOI] [PMC free article] [PubMed] [Google Scholar]
- 17.Qiu WQ, Dean M, Liu T, George L, Gann M, Cohen J, Bruce ML. Physical and Mental Health of Homebound Older Adults: An Overlooked Population. J Am Geriatr Soc. 2011 doi: 10.1111/j.1532-5415.2010.03161.x. [DOI] [PMC free article] [PubMed] [Google Scholar]
- 18.Lan X, Xu J, Kiyota T, Peng H, Zheng JC, Ikezu T. HIV-1 Reduces A{beta}-Degrading Enzymatic Activities in Primary Human Mononuclear Phagocytes. J Immunol. 186:6925–6932. doi: 10.4049/jimmunol.1100211. [DOI] [PMC free article] [PubMed] [Google Scholar]
- 19.Delledonne A, Kouri N, Reinstatler L, Sahara T, Li L, Zhao J, Dickson DW, Ertekin-Taner N, Leissring MA. Development of monoclonal antibodies and quantitative ELISAs targeting insulin-degrading enzyme. Mol Neurodegener. 2009;4:39. doi: 10.1186/1750-1326-4-39. [DOI] [PMC free article] [PubMed] [Google Scholar]
- 20.Scott TM, Peter I, Tucker KL, Arsenault L, Bergethon P, Bhadelia R, Buell J, Collins L, Dashe JF, Griffith J, Hibberd P, Leins D, Liu T, Ordovas JM, Patz S, Price LL, Qiu WQ, Sarnak M, Selhub J, Smaldone L, Wagner C, Wang L, Weiner D, Yee J, Rosenberg I, Folstein M. The Nutrition, Aging, and Memory in Elders (NAME) study: design and methods for a study of micronutrients and cognitive function in a homebound elderly population. Int J Geriatr Psychiatry. 2006;21:519–528. doi: 10.1002/gps.1503. [DOI] [PubMed] [Google Scholar]
- 21.Qiu WQ, Sun X, Selkoe DJ, Mwamburi DM, Huang T, Bhadela R, Bergethon P, Scott TM, Summergrad P, Wang L, Rosenberg I, Folstein M. Depression is associated with low plasma Abeta42 independently of cardiovascular disease in the homebound elderly. Int J Geriatr Psychiatry. 2007;22:536–542. doi: 10.1002/gps.1710. [DOI] [PubMed] [Google Scholar]
- 22.McKhann G, Drachman D, Folstein M, Katzman R, Price D, Stadlan EM. Clinical diagnosis of Alzheimer’s disease: report of the NINCDS-ADRDA Work Group under the auspices of Department of Health and Human Services Task Force on Alzheimer’s Disease. Neurology. 1984;34:939–944. doi: 10.1212/wnl.34.7.939. [DOI] [PubMed] [Google Scholar]
- 23.Roman GC, Tatemichi TK, Erkinjuntti T, Cummings JL, Masdeu JC, Garcia JH, Amaducci L, Orgogozo JM, Brun A, Hofman A, et al. Vascular dementia: diagnostic criteria for research studies. Report of the NINDS-AIREN International Workshop. Neurology. 1993;43:250–260. doi: 10.1212/wnl.43.2.250. [DOI] [PubMed] [Google Scholar]
- 24.Petersen RC, Smith GE, Waring SC, Ivnik RJ, Tangalos EG, Kokmen E. Mild cognitive impairment: clinical characterization and outcome. Arch Neurol. 1999;56:303–308. doi: 10.1001/archneur.56.3.303. [DOI] [PubMed] [Google Scholar]
- 25.Scott TM, Tucker KL, Bhadelia A, Benjamin B, Patz S, Bhadelia R, Liebson E, Price LL, Griffith J, Rosenberg I, Folstein MF. Homocysteine and B vitamins relate to brain volume and white-matter changes in geriatric patients with psychiatric disorders. Am J Geriatr Psychiatry. 2004;12:631–638. doi: 10.1176/appi.ajgp.12.6.631. [DOI] [PubMed] [Google Scholar]
- 26.Leissring MA, Farris W, Chang AY, Walsh DM, Wu X, Sun X, Frosch MP, Selkoe DJ. Enhanced proteolysis of beta-amyloid in APP transgenic mice prevents plaque formation, secondary pathology, and premature death. Neuron. 2003;40:1087–1093. doi: 10.1016/s0896-6273(03)00787-6. [DOI] [PubMed] [Google Scholar]
- 27.Zhao J, Li L, Leissring MA. Insulin-degrading enzyme is exported via an unconventional protein secretion pathway. Mol Neurodegener. 2009;4:4. doi: 10.1186/1750-1326-4-4. [DOI] [PMC free article] [PubMed] [Google Scholar]
- 28.Tamboli IY, Barth E, Christian L, Siepmann M, Kumar S, Singh S, Tolksdorf K, Heneka MT, Lutjohann D, Wunderlich P, Walter J. Statins promote the degradation of extracellular amyloid {beta}-peptide by microglia via stimulation of exosome-associated insulin-degrading enzyme (IDE) secretion. J Biol Chem. 2010;285:37405–37414. doi: 10.1074/jbc.M110.149468. [DOI] [PMC free article] [PubMed] [Google Scholar]
- 29.Jiang Q, Lee CY, Mandrekar S, Wilkinson B, Cramer P, Zelcer N, Mann K, Lamb B, Willson TM, Collins JL, Richardson JC, Smith JD, Comery TA, Riddell D, Holtzman DM, Tontonoz P, Landreth GE. ApoE promotes the proteolytic degradation of Abeta. Neuron. 2008;58:681–693. doi: 10.1016/j.neuron.2008.04.010. [DOI] [PMC free article] [PubMed] [Google Scholar]
- 30.Zou K, Maeda T, Watanabe A, Liu J, Liu S, Oba R, Satoh Y, Komano H, Michikawa M. Abeta42-to-Abeta40- and angiotensin-converting activities in different domains of angiotensin-converting enzyme. J Biol Chem. 2009;284:31914–31920. doi: 10.1074/jbc.M109.011437. [DOI] [PMC free article] [PubMed] [Google Scholar]
- 31.Vardy ER, Rice PJ, Bowie PC, Holmes JD, Catto AJ, Hooper NM. Plasma angiotensin-converting enzyme in Alzheimer’s disease. J Alzheimers Dis. 2009;16:609–618. doi: 10.3233/JAD-2009-1002. [DOI] [PubMed] [Google Scholar]
- 32.Akatsu H, Ogawa N, Kanesaka T, Hori A, Yamamoto T, Matsukawa N, Michikawa M. Higher activity of peripheral blood angiotensin-converting enzyme is associated with later-onset of Alzheimer’s disease. J Neurol Sci. 2011;300:67–73. doi: 10.1016/j.jns.2010.09.030. [DOI] [PubMed] [Google Scholar]
- 33.Casal JA, Robles A, Tutor JC. Serum markers of monocyte/macrophage activation in patients with Alzheimer’s disease and other types of dementia. Clin Biochem. 2003;36:553–556. doi: 10.1016/s0009-9120(03)00093-6. [DOI] [PubMed] [Google Scholar]
- 34.Zou K, Yamaguchi H, Akatsu H, Sakamoto T, Ko M, Mizoguchi K, Gong JS, Yu W, Yamamoto T, Kosaka K, Yanagisawa K, Michikawa M. Angiotensin-converting enzyme converts amyloid beta-protein 1–42 (Abeta(1–42)) to Abeta(1–40), and its inhibition enhances brain Abeta deposition. J Neurosci. 2007;27:8628–8635. doi: 10.1523/JNEUROSCI.1549-07.2007. [DOI] [PMC free article] [PubMed] [Google Scholar]
- 35.Fan J, Donkin J, Wellington C. Greasing the wheels of Abeta clearance in Alzheimer’s disease: the role of lipids and apolipoprotein E. Biofactors. 2009;35:239–248. doi: 10.1002/biof.37. [DOI] [PubMed] [Google Scholar]
- 36.Miners JS, Kehoe PG, Love S. Immunocapture-based fluorometric assay for the measurement of insulin-degrading enzyme activity in brain tissue homogenates. J Neurosci Methods. 2008;169:177–181. doi: 10.1016/j.jneumeth.2007.12.003. [DOI] [PubMed] [Google Scholar]
- 37.Bertram L, McQueen MB, Mullin K, Blacker D, Tanzi RE. Systematic meta-analyses of Alzheimer disease genetic association studies: the AlzGene database. Nat Genet. 2007;39:17–23. doi: 10.1038/ng1934. [DOI] [PubMed] [Google Scholar]
- 38.Ferrari R, Guardigli G, Ceconi C. Secondary prevention of CAD with ACE inhibitors: a struggle between life and death of the endothelium. Cardiovasc Drugs Ther. 2010;24:331–339. doi: 10.1007/s10557-010-6244-x. [DOI] [PubMed] [Google Scholar]
- 39.Lynch JA, George AM, Eisenhauer PB, Conn K, Gao W, Carreras I, Wells JM, McKee A, Ullman MD, Fine RE. Insulin degrading enzyme is localized predominantly at the cell surface of polarized and unpolarized human cerebrovascular endothelial cell cultures. J Neurosci Res. 2006;83:1262–1270. doi: 10.1002/jnr.20809. [DOI] [PubMed] [Google Scholar]
- 40.Hiltunen M, Makinen P, Peraniemi S, Sivenius J, van Groen T, Soininen H, Jolkkonen J. Focal cerebral ischemia in rats alters APP processing and expression of Abeta peptide degrading enzymes in the thalamus. Neurobiol Dis. 2009;35:103–113. doi: 10.1016/j.nbd.2009.04.009. [DOI] [PubMed] [Google Scholar]