

Abstract
Many neurological conditions are caused by immensely heterogeneous gene mutations. The diagnostic process is often long and complex with most patients undergoing multiple invasive and costly investigations without ever reaching a conclusive molecular diagnosis. The advent of massively parallel, next-generation sequencing promises to revolutionize genetic testing and shorten the ‘diagnostic odyssey’ for many of these patients. We performed a pilot study using heterogeneous ataxias as a model neurogenetic disorder to assess the introduction of next-generation sequencing into clinical practice. We captured 58 known human ataxia genes followed by Illumina Next-Generation Sequencing in 50 highly heterogeneous patients with ataxia who had been extensively investigated and were refractory to diagnosis. All cases had been tested for spinocerebellar ataxia 1–3, 6, 7 and Friedrich’s ataxia and had multiple other biochemical, genetic and invasive tests. In those cases where we identified the genetic mutation, we determined the time to diagnosis. Pathogenicity was assessed using a bioinformatics pipeline and novel variants were validated using functional experiments. The overall detection rate in our heterogeneous cohort was 18% and varied from 8.3% in those with an adult onset progressive disorder to 40% in those with a childhood or adolescent onset progressive disorder. The highest detection rate was in those with an adolescent onset and a family history (75%). The majority of cases with detectable mutations had a childhood onset but most are now adults, reflecting the long delay in diagnosis. The delays were primarily related to lack of easily available clinical testing, but other factors included the presence of atypical phenotypes and the use of indirect testing. In the cases where we made an eventual diagnosis, the delay was 3–35 years (mean 18.1 years). Alignment and coverage metrics indicated that the capture and sequencing was highly efficient and the consumable cost was ∼£400 (€460 or US$620). Our pathogenicity interpretation pathway predicted 13 different mutations in eight different genes: PRKCG, TTBK2, SETX, SPTBN2, SACS, MRE11, KCNC3 and DARS2 of which nine were novel including one causing a newly described recessive ataxia syndrome. Genetic testing using targeted capture followed by next-generation sequencing was efficient, cost-effective, and enabled a molecular diagnosis in many refractory cases. A specific challenge of next-generation sequencing data is pathogenicity interpretation, but functional analysis confirmed the pathogenicity of novel variants showing that the pipeline was robust. Our results have broad implications for clinical neurology practice and the approach to diagnostic testing.
Keywords: ataxia, genetics, autosomal dominant cerebellar ataxia, autosomal recessive cerebellar ataxia, diagnosis
Introduction
Ataxias are a highly heterogeneous group of neurological disorders affecting individuals of all age groups. The most common ataxias are those caused by trinucleotide repeat expansions and include spinocerebellar ataxias 1, 2, 3, 6, 7 and 17, and Friedreich’s ataxia, but causal point mutations have been described in a wide variety of other genes. The repeat expansions can be easily and cheaply tested using standard PCR methods and most patients with ataxia have this testing done even when the clinical phenotype makes the diagnosis unlikely. Genetic testing is available for few other genes because development of Sanger-based (dideoxy) DNA sequencing, the gold standard for detecting mutations at the base pair level, is expensive on an individual gene basis. Thus a large proportion of patients with ataxia never have a molecular diagnosis made (Muzaimi et al., 2004; Kraft et al., 2005; Anheim et al., 2010). This may be due to limited test availability, but it is also possible that many novel genes associated with ataxia remain to be discovered. In the past few years, next-generation sequencing (NGS; high-throughput massively parallel sequencing) has allowed an unprecedented increase in our ability to sequence large numbers of genes at an equivalent cost to traditional Sanger sequencing. Although there have been several reports using NGS in a diagnostic setting, including one pilot study of five patients with ataxia (Hoischen et al., 2010), most studies include patients with very homogeneous clinical features (Shanks et al., 2012) or a modest number of genes requiring analysis (Fokstuen et al., 2011; De Keulenaer et al., 2012; Schrauwen et al., 2013) and there are no reports examining the realities of introducing NGS for highly varied disorders into clinical practice. As obtaining a specific molecular diagnosis has significant implications for patient management including genetic counselling, prognosis, long-term investigations and development of therapeutic strategies, we decided to investigate a heterogeneous group of patients with ataxia who were a diagnostic challenge and are representative of the range of cases referred for serial genetic testing.
We recruited 50 patients from independent UK families with ataxia who did not have a molecular diagnosis. All cases had standard testing for spinocerebellar ataxias 1–3, 6, 7 and Friedreich’s ataxia. In addition, all the patients had a vast array of other investigations as appropriate, including multiple standard biochemical tests (e.g. plasma amino acids, urine organic acids), specialist biochemical tests (e.g. ubiquinone, phytanic acid, hexosaminidase), invasive investigations (e.g. muscle biopsy, lumbar puncture) and other genetic tests (e.g. FRAXA, mitochondrial genes). Patients were only included if ataxia was considered to be the main clinical feature and, to enrich for genetic aetiologies, we only included patients with a family history or an age of onset below 50 years. We performed targeted capture on a total of 58 genes known to be associated with human ataxia and an additional 59 genes considered to be good candidates from functional data or animal models. NGS was then performed on the Illumina GAII platform and where necessary functional experimental analysis was performed to confirm the pathogenicity of novel mutations. In addition, we noted the time to diagnosis and the investigations that were performed prior to successful diagnosis using NGS. Our findings have significant implications for diagnostics and research into ataxia but can also be applied to other inherited neurological disorders and can be used to develop models for introduction of NGS services into diagnostic laboratories.
Materials and methods
Patients
Patients were recruited from throughout the UK and consent for participation in the study was obtained according to the Declaration of Helsinki and approved by the Central Oxford Research Ethics Committee and the Research and Development Department of the Oxford Radcliffe Hospitals NHS Trust, Oxford. Inclusion criteria were ataxia as the main clinical feature and either presence of a family history of ataxia or age of onset below 50 years. All cases had been tested for spinocerebellar ataxia 1–3, 6, 7 and Friedrich’s ataxia and had multiple other biochemical, genetic and invasive tests. In any cases where a mitochondrial disorder was suspected (e.g. when retinitis pigmentosa was present), then all available mitochondrial genetic testing and muscle biopsies had also been performed. All patients or their parents provided written consent for the study.
Targeted capture using SureSelect enrichment
The exonic and 25 bp intronic flanking sequences of 118 genes were selected for targeted capture and sequencing (Supplementary Table 1). These included genes known to be associated with ataxia in humans as the predominant phenotype (42 genes, 786 exons), genes causing ataxia in rodent models (18 genes, 514 exons), or good candidate genes based on function (35 additional transfer RNA synthetase genes, 580 exons). We included all the transfer RNA synthetase genes because at the time of the capture design there was emerging evidence that mutations in these were particularly involved in neurological phenotypes including ataxia, including mitochondrial transfer RNA synthetase genes (e.g. RARS2 causing infantile encephalopathy with particular effect on the cerebellum, and DARS2 causing leukoencephalopathy with brainstem and spinal cord involvement, LBSL; Scheper et al., 2007), cytoplasmic transfer RNA synthetase genes (e.g. Aars causing cerebellar ataxia in a mouse model) and bifunctional genes (GARS and YARS causing autosomal dominant Charcot–Marie–Tooth disease; Antonellis and Green 2008). Indeed since the original capture design at least six further mitochondrial transfer RNA synthetases have been associated with neurological disorders (YARS2, HARS2, EARS2, FARS2; Riley et al., 2010; Pierce et al., 2011; Elo et al., 2012; Steenweg et al., 2012), including two associated with ataxia (MARS2 and SARS2) (Belostotsky et al., 2011; Bayat et al., 2012). Several other genes associated with ataxia as part of the phenotype (six genes, 79 exons) and several speculative genes based on function (seven genes, 167 exons) were also included. Ten genes (243 exons) associated with Joubert syndrome, a specific ataxia disorder associated with the ‘molar tooth sign’ on MRI were included and results will be presented in a separate paper. The gene accession numbers and coordinates, were downloaded from the UCSC database, and 120-mer baits with 2× tiling were designed using the Agilent eArray web-based design tool.
Libraries were prepared according to Agilent’s protocol for SureSelect Target Enrichment for Illumina Paired-End Multiplexed Sequencing Version 1.0 (May 2010). One of 12 unique barcodes (Illumina Multiplexing Sample Preparation Oligonucleotides) was added to each sample. Groups of 12 sample libraries were sequenced per lane of a flow cell. Library quality was assessed using the Agilent DNA High-Sensitivity Bioanalyzer kit, and library quantity was assessed using the High-Sensitivity Qubit Fluorometer (Invitrogen).
Illumina sequencing
Samples were sequenced on lanes producing 51 bp paired-end reads. The amount (in pM) of library sample run was determined by quantitative PCR so that the same cluster density was present in each lane.
Sequence read mapping and variant calling
Sequence reads were aligned to the human reference genome (GRCh37/hg19) using STAMPY (Lunter and Goodson, 2011) with the option of using BWA (Li and Durbin, 2009) as a pre-mapper to speed up calculations. Single nucleotide variants were identified using the SAMTOOLS software package (Li et al., 2009b) with custom modifications. Small insertion/deletions were identified using DINDEL (Albers et al., 2011).
Variant annotation
Variants were annotated with respect to gene and transcripts using the Ensembl Variant Effect Predictor (VEP) tool (release 62, April 2011) (Flicek et al., 2011). For each variant, the VEP reports its functional consequences (non-synonymous coding, splice site, intronic, etc.) and checks if the mutation is already present in dbSNP (Build 132) (Sherry et al., 2001).
Variant filtering
Regions of interest were defined as exons plus 25 bp of intronic flanking sequences. All variants within the region of interest were filtered using an algorithm which ensured that all essential splice variants were retained in the analysis while common (minor allele frequency >5%) single nucleotide variants were removed, before analysis with standard pathogenicity prediction programs including PolyPhen2 (Adzhubei et al., 2010), SIFT (Sim et al., 2012), MutPred (Li et al., 2009a) and the mutation interpretation software Alamut which incorporates five splice prediction programs (http://www.interactive-biosoftware.com/). Relatively stringent criteria were used such that pathogenicity had to be predicted by all three Bioinformatics programs (Shanks et al., 2012). This strategy was designed to maximize true positives and minimize false positives. Potential pathogenic variants were compared with the clinical data provided to determine the likely relationship between the variants and the phenotype.
Coverage analysis
Sequence coverage was calculated with custom scripts and the BEDTOOLS package (Quinlan and Hall, 2010). We calculated the average fold coverage over the target regions and the percentage of nucleotide positions covered by at least 5, 10, 20, 30, 50 and 100 reads. In order to evaluate the success of the capture experiment, we also calculated the percentage of reads that mapped to the target regions out of the total number of reads (‘reads on target’).
DNA extraction and Sanger sequencing validation
All potential mutations were validated by Sanger sequencing using standard protocols. Primer sequences for the validations are found in Supplementary Table 2. PCR products were used as templates for sequencing with BigDye® Terminator reagents (Life Technologies) on a 3730xl DNA Sequencing Analyzer (Life Technologies). The sequence traces were aligned to the gene-specific reference sequence (NCBI build 37) with Sequencher 4.10.1 (Gene Codes).
Pathogenicity analysis of PRKCG
Both cysteine domains were aligned using the European Bioinformatics Institute ClustalW online alignment tool (http://www.ebi.ac.uk/Tools/msa/clustalw2/), and the TEXshade alignment shading software (Beitz, 2000) was used to create the graph. The cysteine domains were overlaid with the published 3D structure Cys domain (PDB 1TBN; Xu, 1997) and the residues correlating to the known mutations were marked in MacPyMol. HEK293T cells were transfected with the indicated enhanced GFP-tagged PKCg constructs using Fugene (Roche) according to manufacturer’s instructions. Thirty-eight hours post-transfection, cells were fixed with 4% paraformaldehyde for 20 min, permeabilized with 0.4% Triton™ X-100/PBS and mounted with 4',6-diamidino-2-phenylindole (DAPI) (Vectashield® mounting medium, Vectorlabs).
Results
Clinical characteristics of patients
The clinical and genetic characteristics of the 50 patients can be found in Supplementary Table 3. Twenty-two patients (44%) had a clear family history, of which 12 showed autosomal dominant inheritance (mostly ADCA type III; Harding and Deufel, 1993). Childhood-onset (≤18 years of age) or congenital cases represented 54% of cases (27/50) and 40% (20/50) had additional neurological features that included spasticity, epilepsy, cognitive impairment/decline, neuropathy or retinitis pigmentosa. The majority of cases (38/50) displayed a progressive phenotype, including eight childhood-onset/congenital cases and all adult (n = 24) and adolescent (n = 6) onset cases.
The majority of patients were not under review by paediatric neurologists, reflecting the long delay in diagnosis in many cases. In those patients in whom we were able to make a molecular diagnosis, the number of years from disease onset to diagnosis ranged from 3–35 years, with a mean of 18.1 years and a total of 163 years (Supplementary Table 3).
Sequencing metrics
The regions of interest represented 2369 exons ± 25 bp flanking sequencing, totalling 603 248 bases. The designed capture bait pool covered 95.2% of region of interest bases (Supplementary Table 4).
Sequencing metrics including alignment and coverage are shown in Table 1. Fifty-eight per cent of reads were on target with a mean coverage of 216 reads per base. Ninety-four per cent of regions of interest had >5× coverage, 91% had ≥20× coverage and 73% had coverage of ≥100-fold. Two samples had lower coverage, suggesting that the capture for these samples was less efficient (Table 1 and Supplementary Fig. 1).
Table 1.
Sequencing metrics
| Alignment % |
% ROI coverage > 5 × |
% ROI coverage > 10× |
% ROI coverage > 20× |
% ROI coverage > 30× |
% ROI coverage > 50× |
% ROI coverage > 100× |
Mean base coverage per sample |
||||||||
|---|---|---|---|---|---|---|---|---|---|---|---|---|---|---|---|
| Mean | Range | Mean | Range | Mean | Range | Mean | Range | Mean | Range | Mean | Range | Mean | Range | Mean | Range |
| 57.4 | 28.5–62.7 | 93.6 | 92.7–94.1 | 92.8 | 91.0–93.6 | 91.0 | 86.8–92.9 | 89.5 | 83.7–92. | 84.6 | 75.7–90.7 | 73.2 | 45.2–87 | 215.3 | 88.7–471.3 |
Percentage and range of alignment as an average for all 50 samples in region of interest (ROI). Also shown is the mean percentage of exons covered at greater than 5×, 10×, 20×, 30×, 50× and 100× coverage, and the range in values. Finally, the mean base coverage in all samples is shown with the range in values across the patient samples.
Identification of pathogenic variants and characteristics of patients
Over 5000 variants were identified in the 50 patients. After filtering, ∼150 variants remained, which we examined using our Bioinformatics pipeline in addition to validation by Sanger sequencing, and literature searches. Thirteen were considered to be clearly pathogenic and 9/13 were previously undescribed. We validated the majority of these using a variety of functional assays and in one case an animal model (Lise et al., 2012) (Figs 2–4). The pathogenic mutations were found in nine cases (18%) (Table 2). In eight of these nine cases the age of onset was ≤18 years (Fig. 1A, B and Table 2) but most of them are now adults reflecting the long delay in diagnosis. Every patient had numerous outpatient investigations and two were admitted to specialist centres to determine the cause of the condition. These investigations routinely included multiple biochemical tests, with lumbar puncture and skin biopsy having been performed in some cases. It is not possible to obtain a formal costing for these investigations, but it is likely to far exceed the ∼£400 for the consumables of the targeted capture and NGS of this study.
Figure 2.

Pathogenicity analysis of H36R in PKRCG. (A) The Histidine at position 36 is located in the first cysteine-rich domain. The equivalent Histidine H101, located in the second cysteine rich-domain is associated with several known spinocerebellar ataxia 14 (SCA14) mutations (Alonso et al., 2005). (B) Comparison of the 3D structure of the cysteine-rich domains in PRKCG shows the located of H36R and other known mutations including H101Y, H101Q and H101R. (C) Comparison of HEK cells expressing wild-type (left) and H36R (right) with visible inclusions in the cells with the mutated SCA14 protein. (D) Susceptibility to aggregation in the H36R mutant compared with wild-type, reported in several SCA14 mutations (Seki et al., 2005). At least 200 cells per transfection were counted in three independent experiments. ANOVA and Bonferroni’s multiple comparison test: wild-type versus H36R P < 0.005; wild-type versus H101Q P < 0.005; wild-type versus G128D not significant; wild-type versus C150F P < 0.005.
Figure 3.
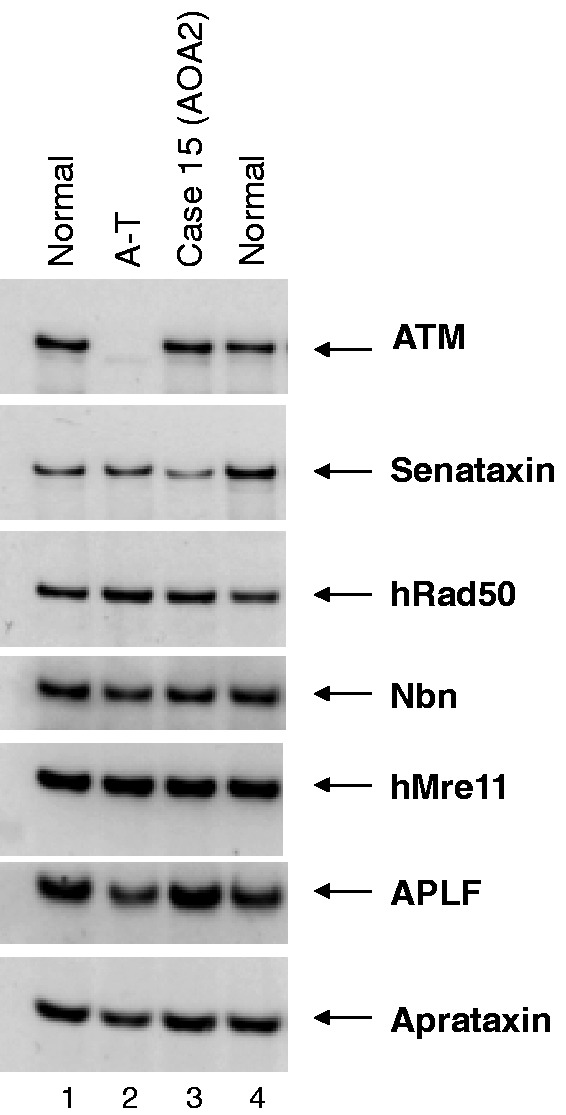
Western blot of Case 15. Patient had adolescent onset ataxia with an eye movement disorder, sensorimotor neuropathy, pes cavus, amyotrophy and raised alpha fetoprotein. Lane 3 shows Case 15, with a normal-sized senataxin band. The blot was reported to be normal and the patient highly unlikely to have ataxia with oculomotor apraxia type 2, although in retrospect the band may be of reduced intensity. Two mutations in SETX were detected using the ataxia NGS panel: F1756S and 7100+2 T>C (splice mutation). Also see Supplementary Fig. 2.
Figure 4.

(A) Splice predictions for MRE11 c414+4_314+7 show loss of donor site of exon 4 in four splice prediction programs [Alamut version 2.3 (Interactive Biosoftware, Rouen, France)]. (B) Retrospective western blot of Case 37 (Lane 6) showing a slight reduction of MRE11 but a clearer reduction of the interacting proteins hRAD50 and Nbs1, which is consistent with a diagnosis of ataxia-telangiectasia-like disorder caused by mutations in MRE11. Ataxia NGS panel identified two mutations, N117S and a splice mutation 314+4_314+7del. The normal size of MRE11 protein in the patient lane suggests that N117S produces a normally sized but abnormally functioning product, also reported by Stewart et al. (1999).
Table 2.
Clinical details and evidence for pathogenicity of mutation positive cases
| Case | Clinical features | Imaging | Previous investigations | Mutation | Mutations known or novel | Evidence for pathogenicity | Comment |
|---|---|---|---|---|---|---|---|
| 3 | Age of onset 17 years. No other neurological features. No FH initially reported, advised possible recessive inheritance with low recurrence risk. FH subsequently found and 50% recurrence risk advised. | Cerebellar atrophy on MRI | Four out-patient appointments | TTBK2 (SCA11), heterozygote: R444TfsX7 | known | Previously reported mutation: identified in a family from Devon, England (Houlden et al., 2007). | Patient not known to be connected to previous family. |
| 5 | Age of onset 40s. Affected mother reported to have a rapidly progressive disorder. Dominant FH. | Cerebellar atrophy on MRI | Multiple out-patient investigations. | PRKCG, (SCA14) (Chen et al., 2003; Yabe et al., 2003; Alonso et al., 2005; Seki et al., 2005): heterozygote: H36R | Novel | Bioinformatics: PolyPhen2 Probably damaging, MutPred Probably damaging | No other family members available for segregation analysis. Extensive bioinformatics and functional assays required to confirm pathogenicity. |
| In vitro analysis; see Fig. 2 | |||||||
| 14 | Age of onset 12 years. Slowly progressive ataxia and a sensorimotor neuropathy. Similarly affected sibling. | Cerebellar atrophy on MRI | AFP elevated | SETX (AOA2) (Izatt et al., 2004), compound heterozygote: H2243Qfs*27 and V2390I. | Two novel | Bioinformatics: one frameshift and other in crucial Helicase domain. | Western blot normal, but mutations detected on sequencing. |
| Western blotting: reported as normal (Fig. 3) | |||||||
| 15 | Age of onset 17 years. Progressive cerebellar syndrome, marked amyotrophy, sensorimotor neuropathy. Similarly affected sibling. | Cerebellar atrophy on MRI | AFP elevated, normal Senataxin expression on western blotting (Fig. 4). Two hospital admissions to specialists units. | SETX (AOA2), compound heterozygote: F1756S and 7100+2 T>C (splice mutation). | One known, one novel | Previously reported mutation (F1756S) (Izatt et al., 2004; Moreira et al., 2004). | Clinical diagnosis of AOA2 was suspected but no sequencing available to confirm. |
| Bioinformatics: on splice prediction, see Supplementary Fig. 2. | |||||||
| 16 | Congenital ataxia, squint and learning difficulties. Parents consanguineous, two identically affected cousins. | Normal MRI | Investigations of cousins for past 20 years. Patient had multiple out-patient appointments. | SPTBN2 (SPARCA1), homozygote: C627X (Lise et al., 2012) | Novel | Previously reported dominant mutations in SCA5 (Ikeda et al., 2006). | The homozygous stop codon strongly suspected to be the cause of the ataxia, but the recessive syndrome not reported before; significant downstream analysis required |
| Whole-genome sequencing and analysis of mouse model. Conclusion that the stop codon causes a novel syndrome, now known as SPARCA1 (Spectrin-associated Autosomal Recessive Cerebellar Ataxia, type 1, Lise et al., 2012). | |||||||
| 29 | Progressive cerebellar ataxia with spasticity from age 37. Mild cognitive decline. | Cerebellar atrophy and non-specific white matter abnormalities | Multiple out-patient assessments, muscle biopsy | DARS2: 536G>A, heterozygote: R179H | Known | Previously reported mutation (Scheper et al., 2007). Very low carrier rate of the mutation in the population. Clinical phenotype consistent with Leukoencephalopathy with brainstem and spinal cord involvement (LBSL) | No second mutation found, but may be due to intronic mutations (Scheper et al., 2007). Further work required to search for an intronic splice mutation. |
| 37 | Normal early development but by age 2 years had progressive balance disorder with dystonia and myoclonic jerks. Now aged 25. | Marked atrophy of cerebellar vermis by age 12. | Two in-patient assessments at specialist centres including complex biochemistry, ubiquinone, lumbar puncture, skin biopsy, chromosome and DNA analysis (including AOA1 and AOA2 on a research basis). | MRE11A (Ataxia-Telangiectasia-Like Disorder (Stewart et al., 1999): compound heterozygote: N117S and splice mutation, 314+4_314+7del. | One known, one novel | Previously reported mutation: N117S (Stewart et al., 1999) | ATLD very rare, easily detectable using NGS |
| Bioinformatics: four programs predict effect on splicing (Fig. 4A) | |||||||
| In vitro analysis: Western blotting shows abnormal Nbs1, which is an effect of MRE11 mutations (Fig. 4B) | |||||||
| 45 | Congenital cerebellar ataxia associated with mild learning difficulties, working diagnosis of ‘ataxic cerebral palsy’. | Normal MRI brain aged 3 | Multiple out-patient investigations including blood and urine biochemistry and for DNA repair disorders. | KCNC3 (SCA13): heterozygote: T428I | Novel | Previously reported dominant mutations in the same domain of KCNC3 cause SCA13 (Waters et al., 2006; Figueroa et al., 2010; Minassian et al., 2012) | Significant implications for offspring recurrence risk which is 50%. |
| Bioinformatics: highly conserved nucleotide, highly conserved amino acid, Grantham score: 89 [0-215], Align GVGD: C65 (GV: 0.00 - GD: 89.28) | |||||||
| SIFT: Deleterious (score: 0.00); PolyPhen2: probably damaging (0.982); MutPred | |||||||
| T428 in protein domain involved in ion transport through voltage-dependent potassium channel. | |||||||
| 50 | Progressive ataxia and spasticity from the age of 3 years, now aged 38. Further deterioration in 20s. | Atrophy of cerebellar vermis and upper cervical cord (Supplementary Fig. 2) | In-patient assessment at specialist centre including complex biochemistry, muscle biopsy, skin biopsy, other genetic tests e.g. FRAXA, Hexosaminidase A, LHON mitochondrial mutations | SACS (Autosomal Recessive Spastic Ataxia of Charlevoix-Saguenay)(Engert et al., 2000), compound heterozygote: Q4010X, P4539S | Two novel | Bioinformatics: Q4010X a stop codon, P4539S located in highly conserved HEPN domain and noted to be a critical residue (Kozlov et al., 2011). Clinical review of the patient confirmed phenotype consistent with ARSACS although optic atrophy unusual. | Genetic testing for ARSACS is not available in the UK despite prevalence estimates suggesting that it is one of the commoner autosomal recessive ataxias (Figueroa et al., 2010). |
AFP = Alpha feto-protein; FH = Family history.
Figure 1.

Clinical features of cases. (A) Total number of cases analysis with or without pathogenic mutations categorized by age of onset, family history and progression. (B) Percentage of mutation-positive cases analysed by age of onset, family history and progression.
Figure 1A and B show the patients classified by clinical features and mutation status. We found that the most likely predictors of detecting a mutation were: an adolescent age of onset, a complex phenotype, a family history and a progressive disorder. The highest detection rate was therefore in the progressive adolescent-onset cases with a family history where three of four (75%) had a molecular diagnosis made. However, one notable exception were those cases of ataxia plus retinitis pigmentosa where no mutations were identified.
A more detailed examination of the gene-positive cases revealed the value of using the ataxia NGS panel (Table 2). In three cases (Cases 14, 14 and 37) the clinical phenotype included an ataxia with a prominent eye movement disorder (sometimes known as ataxia-telangiectasia-like disorder, because of the neurological similarities with ataxia-telangiectasia). The most common gene mutations associated with ataxia-telangiectasia-like disorder are in aprataxin (APTX; Moreira et al., 2001) and senataxin (SETX; causing ataxia with oculomotor apraxia type 2; Németh et al., 2000; Izatt et al., 2004; Moreira et al., 2004). In Case 14 the diagnosis of ataxia with oculomotor apraxia type 2 had not previously been made because of lack of availability of genetic testing, however Case 15 was more complex. The diagnosis of ataxia with oculomotor apraxia type 2 was suspected on clinical grounds (adolescent onset ataxia, an eye movement disorder, raised alpha fetoprotein) but a western blot to screen for mutations in SETX was found to be normal (Fig. 3). However, on NGS testing two mutations were identified in SETX; a known missense mutation, F1756S, and a clear splice variant in intron 23 (Supplementary Fig. 2). The western blot probably appeared normal because the missense allele would produce a normal sized protein product whereas the splice variant either produced an abnormal protein size that was missed, or induced nonsense-mediated decay resulting in no protein produced from that allele, thus leading to a false negative result. In Case 37, the phenotype was also an ataxia-telangiectasia-like disorder with ataxia and a prominent eye movement disorder. The diagnosis of ataxia with oculomotor apraxia type 2 was considered but excluded by sequencing on a research basis. Mutations in MRE11 also cause an ataxia-telangiectasia-like disorder phenotype (Stewart et al., 1999) but sequencing of the MRE11 gene was not available. Our analysis identified one known missense mutation, N117S [shown to be pathogenic by Stewart et al. (1999)] and one novel splice mutation, 314+4_314+7del in MRE11. Bioinformatics predicted a damaging splice mutation and retrospectively a western blot confirmed the pathogenicity of these mutations (Fig. 4).
There were three cases with additional spasticity and in two we found mutations. Case 29 had an adult onset ataxia with spasticity and subtle cognitive decline, but an MRI with non-specific white matter abnormalities. A single known pathogenic mutation was found in the mitochondrial transfer RNA synthetase DARS2. Mutations in DARS2 are associated with leukoencephalopathy with brainstem and spinal cord involvement (Scheper et al., 2007). The clinical phenotype includes a slowly progressive cerebellar ataxia and spasticity with dorsal column dysfunction associated with MRI signal abnormalities in the while matter. Deterioration of motor skills usually starts in childhood or adolescence, but occasionally not until adulthood. The phenotype in our patient is unusual but nevertheless non-specific and mutations in this specific gene would not have been considered likely in this patient. Case 50 had a childhood onset gait disorder that deteriorated in adulthood. The key features included ataxia and spasticity. Optic atrophy was also noted. Mutations in SACSIN were identified, one a clearly pathogenic stop codon, Q4010X, and a missense mutation, P4539S, in the crucial HEPN functional domain (Kozlov et al., 2011). Mutations in SACSIN cause ARSACS (autosomal recessive spastic ataxia of Charlevoix-Saguenay) which was originally reported in Quebec and Tunisia (Engert et al., 2000), and although recognized elsewhere genetic testing is not available in the UK. The phenotype is usually an early-onset spastic ataxia with a sensorimotor neuropathy, although some cases present later.
Results of analysis in two of our cases with ataxia plus mental retardation were particularly surprising. Case 45, described as having ataxic cerebral palsy, had mild learning difficulties, a non-progressive ataxia and no family history. A novel de novo variant, T428I, in KCNC3 was identified. Mutations in KCNC3 cause spinocerebellar ataxia 13, an autosomal dominant ataxic disorder (Waters et al., 2006; Figueroa et al., 2010; Minassian et al., 2012). To our knowledge de novo variants have not been associated with spinocerebellar ataxia 13 or indeed any ataxic disorders and illustrates the value of high throughput screening as this gene would not have been analysed in any other way. In Case 16 a homozygous stop codon was found in SPTBN2. Heterozygous mutations in SPTBN2 are known to cause spinocerebellar ataxia 5 (Ikeda et al., 2006), but recessive mutations in this gene had not previously been described. Our discovery prompted extensive research analysis that resulted in the description of a novel recessive ataxia disorder (spectrin associated autosomal recessive ataxia type 1, SPARCA1) associated with mental retardation (Lise et al., 2012).
The cohort also included cases of non-specific late adolescent or adult onset ataxia without other neurological features and in two cases we identified mutations. In Case 3 a mutation was found in TTBK2 associated with spinocerebellar ataxia 11. The mutation is the same as that found in a family from South West England, suggesting that our case may link with this family (Houlden et al., 2007). In Case 5 a novel mutation, H36R, in PRKCG, causing SCA14 (Chen et al., 2003; Yabe et al., 2003) was found. Bioinformatics analysis predicted that this missense mutation was pathogenic, but as it had not previously been described and family members were not initially available for segregation analysis, we performed functional studies which confirmed its pathogenicity (Fig. 2).
Discussion
We used next-generation sequencing as a tool to investigate heterogeneous patients with ataxia without a molecular diagnosis in order to determine the feasibility of implementing this technology for diagnostic services and research. Our results have shown that even in a highly heterogeneous cohort of challenging patients likely to be representative of cases referred to Molecular Diagnostics laboratories, we were able to make a diagnosis in a significant number of patients. The most significant obstacle we identified was interpretation of pathogenic variants. In seven of nine cases we found at least one novel variant, which was predicted to be pathogenic based on our bioinformatics analysis. To confirm that these variants were pathogenic we performed extensive functional analysis in three cases and demonstrated that they had a pathogenic effect as expected, providing confidence in the use of bioinformatics programs and our pathogenicity assessment pipeline and suggesting that a diagnostic service laboratory would be able to interpret many variants without access to complex experimental procedures. These results have led us to set up genetic testing for ataxias within our own Molecular Diagnostic Laboratory and the experience we have obtained can be applied to many other neurological disorders in which there is phenotypic and genotypic heterogeneity. The total costs including analysis and reporting times will compare very favourably with the costs of single gene tests: currently a single test using Sanger sequencing is ∼£700 and the Ataxia NGS panel of >50 genes is ∼£1000; recommended reporting times for Sanger sequencing are currently 8 weeks compared with 16 weeks for NGS panels but this is likely to decrease as additional experience is gained with the new technology (document from the Clinical Molecular Genetics Society Professional Guidelines for Reporting Times, 26 October 2012).
Although the numbers are too small to draw major statistical conclusions our results represent a notable increase in diagnostic success rate and illustrate the potential for NGS to make a more rapid diagnosis, which has implications for health service economics and patient satisfaction. In the vast majority of the cases, the diagnosis was not made because of lack of available testing combined with unusual phenotypes (SACS), mechanisms (i.e. de novo mutation in KCNC3) or knowledge of the syndrome (SPTBN2). In some cases the phenotypes were too non-specific to select genes for testing (e.g. pure ataxia caused by mutations in TTBK2 and PRKCG) and in other cases the phenotype was more recognizable but associated with mutations in several genes (e.g. ataxia-telangiectasia-like disorder with mutations in SETX and MRE11; ataxia and spasticity with mutations in DARS2 and SACS). In one case the mutation was de novo and would be almost impossible to identify without NGS. Genetic testing using NGS is therefore an efficient and cost-effective alternative to other testing methods even in highly heterogeneous ataxia cases and therefore is likely to have significant clinical utility.
Even after NGS testing many patients still did not have a molecular diagnosis made and there may be several explanations for this. We analysed a phenotypically heterogeneous cohort, and some patients had other neurological features (e.g. spasticity, neuropathy, retinitis pigmentosa), which overlap with other diagnostic categories such as mitochondrial disorders, hereditary spastic paraparesis and neurodegenerative metabolic conditions. These conditions should always be considered in the differential of a patient with ataxia and appropriate investigations performed. However, the majority of patients in this cohort were extensively investigated before referral and most common genetic causes of these conditions had already been ruled out. One patient (Case 39), presenting with a pure cerebellar atrophy, was found to have a neuronal ceroid lipofuscinosis caused by mutations in a known gene using Sanger sequencing. A further patient, Case 43, presented with cerebellar atrophy, cognitive decline and retinitis pigmentosa and was found on exome sequencing to have an exceptionally rare neuronal ceroid lipofuscinosis caused by mutations in CTSD (Siintola et al., 2006; Steinfeld et al., 2006). Four other patients have been investigated with exome sequencing on a research basis and no mutations in known genes have been found. New ataxia genes have been identified since the original design and could have been missed; these have been added to the newer designs (Vermeer et al., 2010; Corbett et al., 2011; Doi et al., 2011; Gulsuner et al., 2011; Bourassa et al., 2012; Guergueltcheva et al., 2012; Onat et al., 2012; Winkelmann et al., 2012; Zanni et al., 2012), however, the mitochondrial genome was not included in the capture. The reasons for this include its size, services being offered elsewhere, and difficulties with analysis, although recent new Bioinformatics tools for analysing the mitochondrial genome from exome data are beginning to address this latter issue (Picardi and Pesole, 2012; Guo et al., 2013). Mutations may be missed because GC-rich regions are inefficiently captured by all current techniques and there may be regions of low coverage due to low complexity or inefficient design. Our metrics indicated generally efficient capture and good depth of coverage for target regions. Nevertheless, newer capture techniques have been introduced and will improve these metrics further. Our bioinformatics pipeline used stringent criteria to classify sequence variants as pathogenic, and the functional data support the accuracy of these data (few false positive mutations as shown by confirmation using functional assays). However, the false negative rate is unknown and it is possible that some truly pathogenic mutations were misclassified as benign. Additional work is in progress to analyse the negative cases using exome sequencing and copy number variation analysis. Another possibility is that all sequencing technologies have very limited ability to detect copy number variants, such as larger deletions and insertions. Mutations in MARS2 (Bayat et al., 2012) and CAMT1 (Thevenon et al., 2012) have recently been reported in ataxia, and in both cases high density single nucleotide polymorphism arrays or array comparative hybridization were required. There are many new bioinformatic programs attempting to address these issues, but at present, in both clinical practice or research, single nucleotide polymorphism arrays or array comparative hybridization should be performed if no diagnosis is made using sequencing. Many groups are evaluating exome sequencing for diagnostics as the number of genes investigated is much larger. However, although exome capture appears an attractive option, the large number of variants identified (in excess of 20 000/subject) may require sequencing of additional family members for filtering which will increase the cost and expand the amount of experimental analysis necessary to confirm pathogenicity (Qi et al., 2012; Wooderchak-Donahue et al., 2012). In addition, exome capture suffers from highly variable coverage, cannot be optimized for specific genes of interest, does not include introns, which are likely to be a rich source of disease-associated variation and as noted above present difficulties with analysis of the mitochondrial genome (Picardi and Pesole, 2012; Guo et al., 2013). In the future whole genome sequencing, which avoids any capture phase, has more even coverage and is better suited for copy number variation detection, is likely to supersede any form of sequencing with capture (targeted or exome). It is also possible that ‘third generation’ sequencing technology which has the potential to detect trinucleotide repeat expansions will offer a more comprehensive solution for molecular diagnosis (Loomis et al., 2013).
Meanwhile, if the proportion of mutations in known genes is applicable to our entire group then up to 50% of the cases might have mutations in known genes that are amenable to targeted screening. This approach represents a very cost-effective and efficient method that can be applied using new, rapid sequencing technology (MiSeq or Ion Torrent, for example) and offer a diagnosis within a few days. However, very importantly, it is highly likely that novel ataxia genes have not yet been discovered and will continue to be identified on a research basis, either by exome/genome sequencing or other technologies. This work should provide the impetus to continue the search for these unknown genes.
In summary, we illustrate the success and challenges of using NGS in one complex group of neurological disorders and suggest that our experience is likely to be applicable to many other conditions such as peripheral neuropathy, spasticity, dementia, parkinsonism and dystonia.
Supplementary Material
Acknowledgements
We thank the High-Throughput Genomics Group at the Wellcome Trust Centre for Human Genetics (funded by Wellcome Trust grant reference 090532/Z/09/Z and MRC Hub grant G0900747 91070) for the generation of the Sequencing data.
Glossary
Abbreviation
- NGS
next-generation sequencing
Funding
AtaxiaUK; the Oxford Partnership Comprehensive Biomedical Research Centre funded by the Department of Health NIHR Biomedical Research Centre Programme; the Thames Valley Dementia and Neurodegenerative Diseases NetworkUK.; CNPq (National Council for Scientific and Technological Development)–Brazil. E.B. is a Royal Society Research Fellow.
Supplementary material
Supplementary material is available at Brain online.
References
- Adzhubei IA, Schmidt S, Peshkin L, Ramensky VE, Gerasimova A, Bork P, et al. A method and server for predicting damaging missense mutations. Nat Methods. 2010;7:248–9. doi: 10.1038/nmeth0410-248. [DOI] [PMC free article] [PubMed] [Google Scholar]
- Albers CA, Lunter G, MacArthur DG, McVean G, Ouwehand WH, Durbin R. Dindel: accurate indel calls from short-read data. Genome Res. 2011;21:961–73. doi: 10.1101/gr.112326.110. [DOI] [PMC free article] [PubMed] [Google Scholar]
- Alonso I, Costa C, Gomes A, Ferro A, Seixas AI, Silva S, et al. A novel H101Q mutation causes PKCgamma loss in spinocerebellar ataxia type 14. J Hum Genet. 2005;50:523–9. doi: 10.1007/s10038-005-0287-z. [DOI] [PubMed] [Google Scholar]
- Anheim M, Fleury M, Monga B, Laugel V, Chaigne D, Rodier G, et al. Epidemiological, clinical, paraclinical and molecular study of a cohort of 102 patients affected with autosomal recessive progressive cerebellar ataxia from Alsace, Eastern France: implications for clinical management. Neurogenetics. 2010;11:1–12. doi: 10.1007/s10048-009-0196-y. [DOI] [PubMed] [Google Scholar]
- Antonellis A, Green ED. The role of aminoacyl-tRNA synthetases in genetic diseases. Annu Rev Genomics Hum Genet. 2008;9:87–107. doi: 10.1146/annurev.genom.9.081307.164204. [DOI] [PubMed] [Google Scholar]
- Bayat V, Thiffault I, Jaiswal M, Tétreault M, Donti T, Sasarman F, et al. Mutations in the mitochondrial methionyl-tRNA synthetase cause a neurodegenerative phenotype in flies and a recessive ataxia (ARSAL) in humans. PLoS Biol. 2012;10:e1001288. doi: 10.1371/journal.pbio.1001288. [DOI] [PMC free article] [PubMed] [Google Scholar]
- Beitz E. TEXshade: shading and labeling of multiple sequence alignments using LATEX2 epsilon. Bioinformatics. 2000;16:135–9. doi: 10.1093/bioinformatics/16.2.135. [DOI] [PubMed] [Google Scholar]
- Belostotsky R, Ben-Shalom E, Rinat C, Becker-Cohen R, Feinstein S, Zeligson S, et al. Mutations in the mitochondrial seryl-tRNA synthetase cause hyperuricemia, pulmonary hypertension, renal failure in infancy and alkalosis, HUPRA syndrome. Am J Hum Genet. 2011;88:193–200. doi: 10.1016/j.ajhg.2010.12.010. [DOI] [PMC free article] [PubMed] [Google Scholar]
- Bourassa CV, Meijer IA, Merner ND, Grewal KK, Stefanelli MG, Hodgkinson K, et al. VAMP1 mutation causes dominant hereditary spastic ataxia in Newfoundland families. Am J Hum Genet. 2012;91:548–52. doi: 10.1016/j.ajhg.2012.07.018. [DOI] [PMC free article] [PubMed] [Google Scholar]
- Chen DH, Brkanac Z, Verlinde CL, Tan XJ, Bylenok L, Nochlin D, et al. Missense mutations in the regulatory domain of PKC gamma: a new mechanism for dominant nonepisodic cerebellar ataxia. Am J Hum Genet. 2003;72:839–49. doi: 10.1086/373883. [DOI] [PMC free article] [PubMed] [Google Scholar]
- Corbett MA, Schwake M, Bahlo M, Dibbens LM, Lin M, Gandolfo LC, et al. A mutation in the Golgi Qb-SNARE gene GOSR2 causes progressive myoclonus epilepsy with early ataxia. Am J Hum Genet. 2011;88:657–63. doi: 10.1016/j.ajhg.2011.04.011. [DOI] [PMC free article] [PubMed] [Google Scholar]
- De Keulenaer S, Hellemans J, Lefever S, Renard JP, De Schrijver J, Van de Voorde H, et al. Molecular diagnostics for congenital hearing loss including 15 deafness genes using a next generation sequencing platform. BMC Med Genomics. 2012;5:17. doi: 10.1186/1755-8794-5-17. [DOI] [PMC free article] [PubMed] [Google Scholar]
- Doi H, Yoshida K, Yasuda T, Fukuda M, Fukuda Y, Morita H, et al. Exome sequencing reveals a homozygous SYT14 mutation in adult-onset, autosomal-recessive spinocerebellar ataxia with psychomotor retardation. Am J Hum Genet. 2011;89:320–7. doi: 10.1016/j.ajhg.2011.07.012. [DOI] [PMC free article] [PubMed] [Google Scholar]
- Elo JM, Yadavalli SS, Euro L, Isohanni P, Götz A, Carroll CJ, et al. Mitochondrial phenylalanyl-tRNA synthetase mutations underlie fatal infantile Alpers encephalopathy. Hum Mol Genet. 2012;21:4521–9. doi: 10.1093/hmg/dds294. [DOI] [PubMed] [Google Scholar]
- Engert JC, Bérubé P, Mercier J, Doré C, Lepage P, Ge B, et al. ARSACS, a spastic ataxia common in northeastern Quebec, is caused by mutations in a new gene encoding an 11.5-kb ORF. Nat Genet. 2000;24:120–5. doi: 10.1038/72769. [DOI] [PubMed] [Google Scholar]
- Figueroa KP, Minassian NA, Stevanin G, Waters M, Garibyan V, Forlani S, et al. KCNC3: phenotype, mutations, channel biophysics-a study of 260 familial ataxia patients. Hum Mutat. 2010;31:191–6. doi: 10.1002/humu.21165. [DOI] [PMC free article] [PubMed] [Google Scholar]
- Flicek P, Amode MR, Barrell D, Beal K, Brent S, Chen Y, et al. Ensembl 2011. Nucleic Acids Res. 2011;39:D800–6. doi: 10.1093/nar/gkq1064. [DOI] [PMC free article] [PubMed] [Google Scholar]
- Fokstuen S, Munoz A, Melacini P, Iliceto S, Perrot A, Ozcelik C, et al. Rapid detection of genetic variants in hypertrophic cardiomyopathy by custom DNA resequencing array in clinical practice. J Med Genet. 2011;48:572–6. doi: 10.1136/jmg.2010.083345. [DOI] [PubMed] [Google Scholar]
- Guergueltcheva V, Azmanov DN, Angelicheva D, Smith KR, Chamova T, Florez L, et al. Autosomal-recessive congenital cerebellar ataxia is caused by mutations in metabotropic glutamate receptor 1. Am J Hum Genet. 2012;91:553–64. doi: 10.1016/j.ajhg.2012.07.019. [DOI] [PMC free article] [PubMed] [Google Scholar]
- Gulsuner S, Tekinay AB, Doerschner K, Boyaci H, Bilguvar K, Unal H, et al. Homozygosity mapping and targeted genomic sequencing reveal the gene responsible for cerebellar hypoplasia and quadrupedal locomotion in a consanguineous kindred. Genome Res. 2011;21:1995–2003. doi: 10.1101/gr.126110.111. [DOI] [PMC free article] [PubMed] [Google Scholar]
- Guo Y, Li J, Li CI, Shyr Y, Samuels DC. MitoSeek: extracting mitochondria information and performing high-throughput mitochondria sequencing analysis. Bioinformatics. 2013;29:1210–1. doi: 10.1093/bioinformatics/btt118. [DOI] [PMC free article] [PubMed] [Google Scholar]
- Harding AE, Deufel T. Inherited ataxias. New York, NY, USA: Raven Press; 1993. [Google Scholar]
- Hoischen A, Gilissen C, Arts P, Wieskamp N, van der Vliet W, Vermeer S, et al. Massively parallel sequencing of ataxia genes after array-based enrichment. Hum Mutat. 2010;31:494–9. doi: 10.1002/humu.21221. [DOI] [PubMed] [Google Scholar]
- Houlden H, Johnson J, Gardner-Thorpe C, Lashley T, Hernandez D, Worth P, et al. Mutations in TTBK2, encoding a kinase implicated in tau phosphorylation, segregate with spinocerebellar ataxia type 11. Nat Genet. 2007;39:1434–6. doi: 10.1038/ng.2007.43. [DOI] [PubMed] [Google Scholar]
- Ikeda Y, Dick KA, Weatherspoon MR, Gincel D, Armbrust KR, Dalton JC, et al. Spectrin mutations cause spinocerebellar ataxia type 5. Nat Genet. 2006;38:184–90. doi: 10.1038/ng1728. [DOI] [PubMed] [Google Scholar]
- Izatt L, Németh AH, Meesaq A, Mills KR, Taylor AM, Shaw CE, et al. Autosomal recessive spinocerebellar ataxia and peripheral neuropathy with raised alpha-fetoprotein. J Neurol. 2004;251:805–12. doi: 10.1007/s00415-004-0427-y. [DOI] [PubMed] [Google Scholar]
- Kozlov G, Denisov AY, Girard M, Dicaire MJ, Hamlin J, McPherson PS, et al. Structural basis of defects in the sacsin HEPN domain responsible for autosomal recessive spastic ataxia of Charlevoix-Saguenay (ARSACS) J Biol Chem. 2011;286:20407–12. doi: 10.1074/jbc.M111.232884. [DOI] [PMC free article] [PubMed] [Google Scholar]
- Kraft S, Furtado S, Ranawaya R, Parboosingh J, Bleoo S, McElligott K, et al. Adult onset spinocerebellar ataxia in a Canadian movement disorders clinic. Can J Neurol Sci. 2005;32:450–8. doi: 10.1017/s0317167100004431. [DOI] [PubMed] [Google Scholar]
- Li B, Krishnan VG, Mort ME, Xin F, Kamati KK, Cooper DN, et al. Automated inference of molecular mechanisms of disease from amino acid substitutions. Bioinformatics. 2009a;25:2744–50. doi: 10.1093/bioinformatics/btp528. [DOI] [PMC free article] [PubMed] [Google Scholar]
- Li H, Durbin R. Fast and accurate short read alignment with Burrows-Wheeler transform. Bioinformatics. 2009;25:1754–60. doi: 10.1093/bioinformatics/btp324. [DOI] [PMC free article] [PubMed] [Google Scholar]
- Li H, Handsaker B, Wysoker A, Fennell T, Ruan J, Homer N, et al. The Sequence Alignment/Map format and SAMtools. Bioinformatics. 2009b;25:2078–9. doi: 10.1093/bioinformatics/btp352. [DOI] [PMC free article] [PubMed] [Google Scholar]
- Lise S, Clarkson Y, Perkins E, Kwasniewska A, Sadighi Akha E, Schnekenberg RP, et al. Recessive mutations in SPTBN2 implicate beta-III spectrin in both cognitive and motor development. PLoS Genet. 2012;8:e1003074. doi: 10.1371/journal.pgen.1003074. [DOI] [PMC free article] [PubMed] [Google Scholar]
- Loomis EW, Eid JS, Peluso P, Yin J, Hickey L, Rank D, et al. Sequencing the unsequenceable: expanded CGG-repeat alleles of the fragile X gene. Genome Res. 2013;23:121–8. doi: 10.1101/gr.141705.112. [DOI] [PMC free article] [PubMed] [Google Scholar]
- Lunter G, Goodson M. Stampy: a statistical algorithm for sensitive and fast mapping of Illumina sequence reads. Genome Res. 2011;21:936–9. doi: 10.1101/gr.111120.110. [DOI] [PMC free article] [PubMed] [Google Scholar]
- Minassian NA, Lin MC, Papazian DM. Altered Kv3.3 channel gating in early-onset spinocerebellar ataxia type 13. J Physiol. 2012;590(Pt 7):1599–614. doi: 10.1113/jphysiol.2012.228205. [DOI] [PMC free article] [PubMed] [Google Scholar]
- Moreira MC, Barbot C, Tachi N, Kozuka N, Uchida E, Gibson T, et al. The gene mutated in ataxia-ocular apraxia 1 encodes the new HIT/Zn-finger protein aprataxin. Nat Genet. 2001;29:189–93. doi: 10.1038/ng1001-189. [DOI] [PubMed] [Google Scholar]
- Moreira MC, Klur S, Watanabe M, Németh AH, Le Ber I, Moniz JC, et al. Senataxin, the ortholog of a yeast RNA helicase, is mutant in ataxia-ocular apraxia 2. Nat Genet. 2004;36:225–7. doi: 10.1038/ng1303. [DOI] [PubMed] [Google Scholar]
- Muzaimi MB, Thomas J, Palmer-Smith S, Rosser L, Harper PS, Wiles CM, et al. Population based study of late onset cerebellar ataxia in south east Wales. J Neurol Neurosurg Psychiatry. 2004;75:1129–34. doi: 10.1136/jnnp.2003.014662. [DOI] [PMC free article] [PubMed] [Google Scholar]
- Németh AH, Bochukova E, Dunne E, Huson SM, Elston J, Hannan MA, et al. Autosomal recessive cerebellar ataxia with oculomotor apraxia (ataxia-telangiectasia-like syndrome) is linked to chromosome 9q34. Am J Hum Genet. 2000;67:1320–6. doi: 10.1016/s0002-9297(07)62962-0. [DOI] [PMC free article] [PubMed] [Google Scholar]
- Onat OE, Gulsuner S, Bilguvar K, Nazli Basak A, Topaloglu H, Tan M, et al. Missense mutation in the ATPase, aminophospholipid transporter protein ATP8A2 is associated with cerebellar atrophy and quadrupedal locomotion. Eur J Hum Genet. 2012;21:281–5. doi: 10.1038/ejhg.2012.170. [DOI] [PMC free article] [PubMed] [Google Scholar]
- Picardi E, Pesole G. Mitochondrial genomes gleaned from human whole-exome sequencing. Nat Methods. 2012;9:523–4. doi: 10.1038/nmeth.2029. [DOI] [PubMed] [Google Scholar]
- Pierce SB, Chisholm KM, Lynch ED, Lee MK, Walsh T, Opitz JM, et al. Mutations in mitochondrial histidyl tRNA synthetase HARS2 cause ovarian dysgenesis and sensorineural hearing loss of Perrault syndrome. Proc Natl Acad Sci USA. 2011;108:6543–8. doi: 10.1073/pnas.1103471108. [DOI] [PMC free article] [PubMed] [Google Scholar]
- Qi XP, Du ZF, Ma JM, Chen XL, Zhang Q, Fei J, et al. Genetic diagnosis of autosomal dominant polycystic kidney disease by targeted capture and next-generation sequencing: Utility and limitations. Gene. 2012;516:93–100. doi: 10.1016/j.gene.2012.12.060. [DOI] [PubMed] [Google Scholar]
- Quinlan AR, Hall IM. BEDTools: a flexible suite of utilities for comparing genomic features. Bioinformatics. 2010;26:841–2. doi: 10.1093/bioinformatics/btq033. [DOI] [PMC free article] [PubMed] [Google Scholar]
- Riley LG, Cooper S, Hickey P, Rudinger-Thirion J, McKenzie M, Compton A, et al. Mutation of the mitochondrial tyrosyl-tRNA synthetase gene, YARS2, causes myopathy, lactic acidosis, and sideroblastic anemia—MLASA syndrome. Am J Hum Genet. 2010;87:52–9. doi: 10.1016/j.ajhg.2010.06.001. [DOI] [PMC free article] [PubMed] [Google Scholar]
- Scheper GC, van der Klok T, van Andel RJ, van Berkel CG, Sissler M, Smet J, et al. Mitochondrial aspartyl-tRNA synthetase deficiency causes leukoencephalopathy with brain stem and spinal cord involvement and lactate elevation. Nat Genet. 2007;39:534–9. doi: 10.1038/ng2013. [DOI] [PubMed] [Google Scholar]
- Schrauwen I, Sommen M, Corneveaux JJ, Reiman RA, Hackett NJ, Claes C, et al. A sensitive and specific diagnostic test for hearing loss using a microdroplet PCR-based approach and next generation sequencing. Am J Med Genet A. 2013;161:145–52. doi: 10.1002/ajmg.a.35737. [DOI] [PubMed] [Google Scholar]
- Seki T, Adachi N, Ono Y, Mochizuki H, Hiramoto K, Amano T, et al. Mutant protein kinase Cgamma found in spinocerebellar ataxia type 14 is susceptible to aggregation and causes cell death. J Biol Chem. 2005;280:29096–106. doi: 10.1074/jbc.M501716200. [DOI] [PubMed] [Google Scholar]
- Shanks ME, Downes SM, Copley RR, Lise S, Broxholme J, Hudspith KA, et al. Next-generation sequencing (NGS) as a diagnostic tool for retinal degeneration reveals a much higher detection rate in early-onset disease. Eur J Hum Genet. 2012;21:274–80. doi: 10.1038/ejhg.2012.172. [DOI] [PMC free article] [PubMed] [Google Scholar]
- Sherry ST, Ward MH, Kholodov M, Baker J, Phan L, Smigielski EM, et al. dbSNP: the NCBI database of genetic variation. Nucleic Acids Res. 2001;29:308–11. doi: 10.1093/nar/29.1.308. [DOI] [PMC free article] [PubMed] [Google Scholar]
- Siintola E, Partanen S, Strömme P, Haapanen A, Haltia M, Maehlen J, et al. Cathepsin D deficiency underlies congenital human neuronal ceroid-lipofuscinosis. Brain. 2006;129(Pt 6):1438–45. doi: 10.1093/brain/awl107. [DOI] [PubMed] [Google Scholar]
- Sim NL, Kumar P, Hu J, Henikoff S, Schneider G, Ng PC. SIFT web server: predicting effects of amino acid substitutions on proteins. Nucleic Acids Res. 2012;40:W452–7. doi: 10.1093/nar/gks539. [DOI] [PMC free article] [PubMed] [Google Scholar]
- Steenweg ME, Ghezzi D, Haack T, Abbink TE, Martinelli D, van Berkel CG, et al. Leukoencephalopathy with thalamus and brainstem involvement and high lactate ‘LTBL’ caused by EARS2 mutations. Brain. 2012;135(Pt 5):1387–94. doi: 10.1093/brain/aws070. [DOI] [PubMed] [Google Scholar]
- Steinfeld R, Reinhardt K, Schreiber K, Hillebrand M, Kraetzner R, Bruck W, et al. Cathepsin D deficiency is associated with a human neurodegenerative disorder. Am J Hum Genet. 2006;78:988–98. doi: 10.1086/504159. [DOI] [PMC free article] [PubMed] [Google Scholar]
- Stewart GS, Maser RS, Stankovic T, Bressan DA, Kaplan MI, Jaspers NG, et al. The DNA double-strand break repair gene hMRE11 is mutated in individuals with an ataxia-telangiectasia-like disorder. Cell. 1999;99:577–87. doi: 10.1016/s0092-8674(00)81547-0. [DOI] [PubMed] [Google Scholar]
- Thevenon J, Lopez E, Keren B, Heron D, Mignot C, Altuzarra C, et al. Intragenic CAMTA1 rearrangements cause non-progressive congenital ataxia with or without intellectual disability. J Med Genet. 2012;49:400–8. doi: 10.1136/jmedgenet-2012-100856. [DOI] [PubMed] [Google Scholar]
- Vermeer S, Hoischen A, Meijer RP, Gilissen C, Neveling K, Wieskamp N, et al. Targeted next-generation sequencing of a 12.5 Mb homozygous region reveals ANO10 mutations in patients with autosomal-recessive cerebellar ataxia. Am J Hum Genet. 2010;87:813–9. doi: 10.1016/j.ajhg.2010.10.015. [DOI] [PMC free article] [PubMed] [Google Scholar]
- Waters MF, Minassian NA, Stevanin G, Figueroa KP, Bannister JP, Nolte D, et al. Mutations in voltage-gated potassium channel KCNC3 cause degenerative and developmental central nervous system phenotypes. Nat Genet. 2006;38:447–51. doi: 10.1038/ng1758. [DOI] [PubMed] [Google Scholar]
- Winkelmann J, Lin L, Schormair B, Kornum BR, Faraco J, Plazzi G, et al. Mutations in DNMT1 cause autosomal dominant cerebellar ataxia, deafness and narcolepsy. Hum Mol Genet. 2012;21:2205–10. doi: 10.1093/hmg/dds035. [DOI] [PMC free article] [PubMed] [Google Scholar]
- Wooderchak-Donahue WL, O'Fallon B, Furtado LV, Durtschi JD, Plant P, Ridge PG, et al. A direct comparison of next generation sequencing enrichment methods using an aortopathy gene panel- clinical diagnostics perspective. BMC Med Genomics. 2012;5:50. doi: 10.1186/1755-8794-5-50. [DOI] [PMC free article] [PubMed] [Google Scholar]
- Xu RX, Pawelczyk T, Xia TH, Brown SC. NMR structure of a protein kinase C-gamma phorbol-binding domain and study of protein-lipid micelle interactions. Biochemistry. 1997;36:10709–17. doi: 10.1021/bi970833a. [DOI] [PubMed] [Google Scholar]
- Yabe I, Sasaki H, Chen DH, Raskind WH, Bird TD, Yamashita I, et al. Spinocerebellar ataxia type 14 caused by a mutation in protein kinase C gamma. Arch Neurol. 2003;60:1749–51. doi: 10.1001/archneur.60.12.1749. [DOI] [PubMed] [Google Scholar]
- Zanni G, Calì T, Kalscheuer VM, Ottolini D, Barresi S, Lebrun N, et al. Mutation of plasma membrane Ca2+ ATPase isoform 3 in a family with X-linked congenital cerebellar ataxia impairs Ca2+ homeostasis. Proc Natl Acad Sci USA. 2012;109:14514–9. doi: 10.1073/pnas.1207488109. [DOI] [PMC free article] [PubMed] [Google Scholar]
Associated Data
This section collects any data citations, data availability statements, or supplementary materials included in this article.