

Abstract
Stereotype threat is a widely supported theory for understanding the racial achievement gap in college grade performance. However, today’s minority college students are increasingly of immigrant origins, and it is unclear whether two dispositional mechanisms that may increase susceptibility to stereotype threat are applicable to immigrants. We use survey data to examine whether and how negative ability stereotypes affect the grades of 1,865 first, second, and third generation or higher (domestic) minority students at 28 selective American colleges. Structural equation model results indicate that first generation immigrants are highly-resistant to both dispositional identity threat mechanisms we consider. Second generation immigrants experience only certain dispositional elements of identity threat. Drawing on research in social psychology, we suggest immigrants tend to resist stereotype threat in part due to the primacy of their immigrant identities and their connectedness to the opportunity structure of mainstream society.
Keywords: Education, College Performance, Stereotype Threat, Immigrants
Social scientists have long been interested in identifying the sources of the achievement gap between whites and racial minorities (Jencks and Phillips 1998). Social psychology offers one of the most empirically supported theories to explain the gap: the theory of stereotype threat. Stereotype threat occurs when negative ability stereotypes increase minority students’ cognitive psychological load and reduce their academic effort, negatively affecting academic performance. We might expect black and Hispanic1 students at elite schools to be well-positioned to resist stereotype threat, given that they have achieved academic success in secondary school and obtained admission to a selective institution. Yet stereotype threat dampens even their academic performance.
However, considerable heterogeneity exists within minority student populations at elite colleges. Today, minority immigrants comprise a rapidly increasing proportion of minorities at elite colleges, despite being generally on par with domestic minorities on most socioeconomic measures (Massey et al. 2007).2 Does stereotype threat theory apply to immigrant minorities? In a social context in which domestic minority students are the targets of negative ability stereotypes, minority immigrants negotiate the boundaries of their primary identity (“in”) group perhaps differently than their domestic minority peers. Their identities are shaped by a combination of self-categorizations and perceptions of categorizations made by members of other groups (Deaux 2006). In categorizing themselves, first generation and, possibly second generation immigrants may give primacy to their ethnic-immigrant identity rather than their racial identity. Ethnic-immigrant identities may facilitate their resilience against the potentially grade-depressing effects of negative ability racial stereotypes. On the other hand, immigrant minorities may perceive that out-group members (i.e. whites and Asians) categorize them along racial lines with domestic blacks or Hispanics. If so, second generation immigrants—more assimilated into minority identities than first generation immigrants—may experience similar reductions in effort and lowered academic performance, akin to domestic minorities.
This study considers the increasing heterogeneity of minority students at elite institutions and offers a more nuanced conception than prior research of two dispositional—rather than situational—mechanisms that may influence susceptibility to stereotype threat. That is, much of the experimental literature has focused on situational stereotype threat, where “situational” means that particular negative race-based stereotypes are “triggered” as a treatment in an experimental context, and the consequence—in terms of task performance—is then immediately measured (Crocker and Lutskey 1986; Steele 1998, 1992, 1988; Steele and Aronson 1995). In observational studies like ours, measures of stereotype threat reflect how dispositional characteristics of individuals influence susceptibility to multiple exposures of negative ability stereotypes over extended periods of time (Oyserman and Swim 2001).3 Thus, in this study, we ask:
Do immigrant minority students accept their own and others’ race-based negative ability stereotypes in the same way that lowers the grade performance of domestic blacks and Hispanics?
How can we reconcile differences in minority immigrants’ susceptibility to negativeability stereotypes with their comparably low grade performance relative to domestic minorities?
BACKGROUND
Massey and Fischer (2005) use a survey designed specifically to measure factors that may increase minority students’ susceptibility to stereotype threat across their daily academic and social encounters. They find that minority students at selective colleges simultaneously externalize and internalize negative stereotypes, as shown in the conceptual model of stereotype threat displayed in Figure 1.
Figure 1. Conceptual Model of the Externalizationand Internalization Mechanismswith Expectedthe Directions of Relationships between Concepts Based on Stereotype Threat Theory.
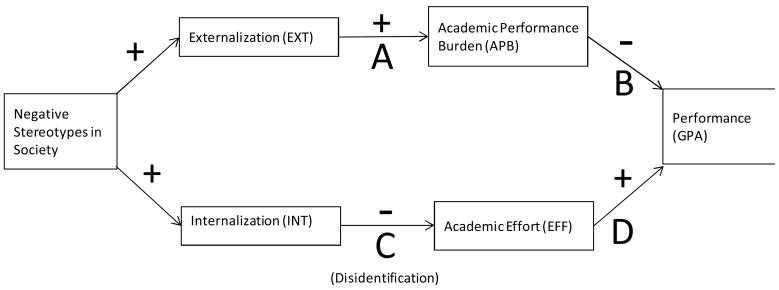
NOTE: The boxes overlaying arrowscontain positive (+) and negative (−) signs that indicate the expecteddirection of the effect based on the theory of stereotype threat. Positive signs (+) represents an expected positive relationship between the two conceptsand negative (−) signs represents an expected negative relationship.
Minority students recognize negative ability stereotypes in American society about their intelligence (Steele 1998, 1988; Steele and Aronson 1995). This recognition—externalization—places pressure on minority students to perform well in order to avoid confirming the stereotypes. The psychological stress of this added pressure is often called academic performance burden (Figure 1, path A; Steele and Aronson 1995). Performance burden tends to lead minorities to perform more poorly than they otherwise would in the absence of negative stereotypes (Figure 1, path B; Massey and Fischer 2005).
In addition to recognizing that members of other racial groups hold negative stereotypes about them, minority students may evolve to believe these stereotypes; this process is called internalization. If students who identify with their racial group begin to believe that negative stereotypes about their racial group’s intelligence are true, they may begin to reduce their academic effort (Figure 1, path C) out of a fatalistic sense that such effort is pointless. Steele and Aronson (1995) call this type of disengagement disidentification because students stop identifying academic achievement as an indication of their self-worth. Disidentification may then lead to a reduction in grades (Figure 1, path D).
Although this theoretical schema is powerful in understanding the achievement gap between majority and domestic minority students, does this model apply to immigrant minorities? We argue that the model may not apply directly. Instead, immigrant minorities negotiate their identities over time. As they assimilate into the U.S., they situate themselves and define the boundaries of their in-group relative to the American racial classification scheme and its accompanying negative stereotypes about minorities (Oyserman 2008; Oyserman, Bybee, and Terry 2003). More specifically, as voluntary migrants, first generation immigrants’ ethnic identities tend to be accompanied by a sense of self-determination and hopefulness (Conzen et al. 1992; Gans 1992). This sense of self-determination stems from and reinforces first generation immigrants’ perceptions of opportunities for upward mobility (Bean and Stevens 2003). First generation immigrants’ optimism is reinforced by their shorter duration in the United States and minimal exposure to the U.S. race-based classification system. First generation immigrants are also more likely than second generation or domestic minorities to live in ethnic enclaves with other recently-arrived immigrants (Grasmuck and Pessar 1991) and to maintain stronger ties to their home (sending) communities (Menjívar 2000; Grasmuck and Pessar 1991). As a result of these spatial and psychological buffers, members of the first generation are less likely than second generation and domestic minority students to be susceptible to negative stereotypes that dampen academic performance.
Second generation children also come from immigrant families and communities. However, the extent to which they experience susceptibility to negative ability stereotypes is debated. Some research contests the notion of downward assimilation, even among second generation Mexican-Americans born to low-skilled Mexican immigrants (Waldinger and Feliciano 2004). This research suggests that the immigrant social networks formed by the first generation reliably provide the second generation entrée into working-class jobs at higher rates than those of domestic minorities. Research also suggests that first-generation parents instill in their children strong ethnic-immigrant identities and a sense of self-determination (Deaux 1996; Fernandez-Kelly and Schauffler 1994). Other research, however, highlights that with increased duration, and thus acculturation, in the United States, second generation students become more aware of the American race-based classification system and domestic minorities’ limited opportunities for upward mobility (Tajfel 1981). To the extent ethnic-immigrant identities persist among the second generation, they may not provide as strong of a buffer against either the externalization or internalization of negative ability stereotypes as for their first generation counterparts.
The debate over the existence of a second generation decline is best addressed through empirical testing of the specific mechanisms through which decline, or resilience, may occur within specific contexts. In the context of academic performance among elite college students, we posit that stereotype susceptibility may increase with duration (i.e. generation) in the United States—much in line with theories of generational decline. One of the main distinguishing characteristics between first generation, second generation, and domestic students’ self-schemas is their unique reference groups. The reference group for most first generation immigrants is other recent immigrants and co-ethnics in their country of origin (Barrera 1980; Bean and Stevens 2003). For many in the second generation, reference groups vary based on social class and degree of residential segregation. Lower status second generation students in poor neighborhoods outside of immigrant enclaves tend to identify with domestic minorities, while higher status second generation students in middle-class neighborhoods identify with their immigrant origins (Fernandez-Kelly 1995; Suarez-Orozco and Suarez-Orozco 2001; Tajfel 1981). Resilience against negative ability stereotypes may therefore be greater among the second generation in our sample of elite college students compared to lower-status second generation immigrants.
Given the importance of reference groups when measuring perceptions of negativeability stereotypes, our hypotheses are shaped by the reference groups specified in our survey. Items in our study draw on questions about how members outside one’s racial group view members of one’s racial (as opposed to ethnic-origin) group. The reference to the broad racial group leads us to expect that most students—even those of first or second generation immigrant backgrounds—will interpret the questions as pertaining to the racial categories into which they know they are grouped by others. As Merton (1968) highlighted in his work on race as a master status in American society, mainstream classification schemes for non-European Americans tend to follow racial categories based largely on phenotypic characteristics like skin tone, hair texture and facial features (see also Waters 1999). For example, black immigrants from Haiti, Jamaica, and Nigeria are often classified uniformly as African-American while those from countries as diverse as Mexico, Colombia, and Costa Rica tend to be categorized as Hispanic or Latino despite the varied ethnic and cultural backgrounds of each group (Kasinitz et al. 2008; Waters 1996, 1999). Because Americans tend to classify others based on their racial group membership, black and Hispanic immigrants are likely aware that they are associated with broad race-based stereotypes of lower academic intelligence. Therefore, even if minority first and second generation immigrants do not identify themselves within the framework of overarching racial categories, their awareness of the race-based classification scheme dominant in the U.S. may lead them to report the levels of externalization, internalization, and performance burden they perceive for blacks or Hispanics as a whole. Thus:
Hypothesis 1: First generation, second generation, and domestic minority students report similar levels of externalization, internalization, and performance burden
However, first generation immigrants’ sense of self-determination and connection to opportunities in the mainstream society may be uniquely accompanied by the belief that hard work pays off. As a result, first, and to a lesser extent second, generation immigrants may work harder (e.g., study more hours) on average than domestic minorities (see a related discussion in Bennett and Lutz 2009; Deaux 2006; Hagy and Ordovensky Staniec 2002). Domestic minority and some second generation immigrant students, on the other hand, may believe that, beyond a certain high level of effort, factors outside of their control determine which opportunities are available to them and which are not. Though they may value educational success just as much as first generation immigrants, they may spend less time studying (Downey 2008; Downey, Ainsworth and Qian 2009). Thus:
Hypothesis 2: First and, to a lesser degree, second generation immigrants report the highest levels of academic effort compared to domestic minority students
Although we expect comparable levels of externalization across immigrant generations, we also suspect racial in-group exposure while growing-up shapes students’ perceptions of opportunities and barriers (Sanders 2002). Ethnic enclaves tend to increase ethnic-immigrant self-schemas in the first generation (Grasmuck 1984; Sanders 2002). In the second generation, higher levels of exposure to domestic minorities produce domestic minority identities (Zhou 1997a). Domestic minority students are likely to come from neighborhoods with the highest concentrations of other domestic minorities who maintain race-based (vs. ethnic) self-schemas (Iceland, Weinberg, and Steinmetz 2002; Zhou 1997a). Factors like residential segregation in domestic minority neighborhoods promote strong in-group racial identities, racially homogenous social networks, and increased social distance from whites (Charles 2003). This environment may foster a perception that whites and Asians hold negative stereotypes about blacks and Hispanics. As a result, greater exposure to a domestic minority racial in-group may be associated with higher levels of externalization. Thus:
Hypothesis 3: In-group racial exposure is not associated with higher levels of externalization for first generation immigrants, slightly higher levels for second generation immigrants, and significantly higher levels for domestic minority students
In addition to differences in reference groups, a second primary distinguishing characteristic of first and, to a lesser extent, second generation immigrants’ ethnic-immigrant compared to domestic minority identities is possession of a dual self-schema (Oyserman et al. 2003). A dual self-schema is adherence to one’s ethnic-immigrant identity in combination with connection to the opportunity structure of mainstream society (Oyserman et al. 2003). These strong ethnic-immigrant identities characteristic of minority first generation students (Waters 1999) are particularly powerful in orienting them toward high academic achievement when they are accompanied by selective acculturation into middle-class American society—as with students at elite colleges. Selective acculturation involves maintenance of strong ties to immigrants’ native culture, for example via continued fluency in their native language, coupled with the adoption of certain elements of American culture, including English fluency and understanding of mainstream social norms (Portes and Rumbaut 2001; Rong and Brown 2001). The combination of a dual self-schema and selective acculturation is central to first generation immigrants’ perceptions of opportunities for upward mobility. Perception of these opportunities is facilitated by their belief that the majority group does not hold negative stereotypes about their ethnic-immigrant group. Therefore, they are able to dissociate awareness of negative stereotypes about African-Americans and domestic Hispanics from themselves and how they are perceived. Externalization, then, does not translate into academic performance burden and decreased grade performance.
A similar dissociation process, enhanced by selective acculturation, is at play for second generation immigrants. Because their connection to their ancestral homeland is less tangible, second generation immigrants may glorify their parents’ sacrifices during the immigration process as well as imagine their families’ respected position in their origin country (Portes and Rumbaut 2001). This psychic connection to the origin country may serve as a powerful motivator. High-achieving second generation immigrants develop a sense of agency grounded in their families’ distinct history of migration, which facilitates their perceptions of themselves as distinct from the domestic minorities targeted by negative ability stereotypes (Deaux 2006). Their agency may facilitate resilience against the potentially dampening effects of stereotype externalization and performance burden on grade performance. Thus:
Hypothesis 4: Stereotype externalization does not reduce the grades of first or second generation immigrants
Self-perceptions and perceptions about one’s in-group may have an equally significant effect on grades as views on stereotypes held by other groups. However, as a result of their overall belief in the dignity of hard work for overcoming even seemingly insurmountable barriers in the United States, first generation immigrants are likely resilient against potential declines in effort and performance (Portes and Rumbaut 2001). In the second generation, however, dual self-schemas are not as strong as for first generation students. With greater duration in the U.S. and movement out of enclaves and into neighborhoods more highly-concentrated with domestic minorities, second generation students may begin to view themselves along racial lines and begin to believe that negative ability stereotypes apply to them. As a result, second generation students may come to believe increased academic effort will not allow them to overcome the larger structural barriers to success, thereby leading to a reduction in effort and, subsequently, performance. Thus:
Hypothesis 5: The effects of stereotype internalization on effort and subsequent grades increases across immigrant generations (first generation immigrants are least affected)
Despite our hypotheses, we recognize that heterogeneity among immigrants based on parental skill and social status may produce differential levels of resistance to negative stereotypes. For example, low-skilled immigrants are most likely to experience blocked educational and labor market opportunities, but first generation low-skilled immigrants’ connections to their home country, combined with their aspirations for a better life in their new home, help motivate perseverance (Zhou 1997b). Second generation low-skilled immigrants, however, must confront the reality that hard work did not pay off for their first generation parents (Zhou 1997b). Consequently, low-skilled second generation students may be more likely than high-skilled second-generation immigrants to internalize negative stereotypes, which could lead to the development of similar oppositional identities as for some poor and working-class domestic African-Americans and Hispanics. If oppositional identities bring low-skilled second generation immigrants’ faster assimilation into domestic racial identities, second generation immigrants may experience stereotype internalization despite their success relative to same-race peers who did not make it to elite colleges.
DATA AND METHODS
Sample
The data used in this study are from the National Longitudinal Survey of Freshmen (NLSF), a stratified random sample of college students who entered 28 selective, four-year colleges and universities throughout the United States in the fall of 1999. Students were interviewed in the fall of their first year to collect a retrospective history of their childhood experiences and then were re-surveyed every spring regarding their college experience. Of 4,573 students contacted, 3,924 completed the baseline face-to-face interview (response rate of 86%). Of these, 96% and 90% completed the follow-ups in the spring of 2000 and 2001, respectively. We use the baseline and these two follow up waves.
We exclude white and Asian students because stereotype threat is only relevant for explaining underperformance among minority students.4 Although excluded from our sample, we often reference whites and Asians together in our discussion of externalization, despite Asian-Americans being minorities and predominantly immigrants themselves, unlike whites. Nonetheless, both groups are unsusceptible to negative-ability stereotypes and therefore may be perceived by blacks and Hispanics as out-group propagators of negative-ability stereotypes. Our analyses therefore rely on a restricted sample of 991 black and 874 Hispanic students (n=1,865). Multiple imputation of five datasets was used to address item non-response (which ranged between 0% and 5% per item). All analyses were also replicated using complete cases only; this approach yielded the same substantive conclusions (results available upon request).
The racial and ethnic heterogeneity of Hispanics in our sample (see Appendix A1) merits some discussion. Mexicans constitute approximately 25% of Hispanics (n=236), with roughly 20% self-identifying as white-Mexican (n=188) and 5% identifying as black-Mexican (n=48). Mixed race Hispanics comprise almost 30% of the Hispanic sample (n=264) (they comprise 16% of the black sample (n=172), as shown in Appendix A2). White South Americans account of 13% of Hispanics (n=119), white Puerto Ricans roughly 7.5% (n=68), and white Cubans roughly 4% (n=35). Ideally, our analyses would reflect this heterogeneity. However, subsample sizes simply do not allow modeling using more detailed measures of race, ethnicity, and generation than those we use.
Variables
The dependent variable in our analysis is academic performance, which is measured by students’ GPA during the first two years. Our key predictors of performance—externalization, internalization, academic performance burden, and academic effort (the relevant components of stereotype threat)—are measured using a series of survey items used in prior research (see Table 1; see Massey and Fischer 2005; Owens and Massey 2010). Table 1 lists the items used as measures of each concept.
Table 1.
Indicators and Dimensions Used in the Analyses to Capture Negative Ability Stereotypes and their Effects
| Externalization (EXT) |
| 1. On a scale of 0 (treat equally) to 10 (discriminate against others), do you think Whites tend to treat members of other racial groups equally, or do they tend to discriminate against people who are not in their group? |
| 2. On a scale of 0 (treat equally) to 10 (discriminate against others), do you think Asians tend to treat members of other racial groups equally, or do they tend to discriminate against people who are not in their group? |
| 3. On a scale of 0 (total agreement) to 10 (total disagreement), to what extent do you agree that: If instructors hold negative stereotypes about certain groups, it will not affect their evaluations of individual students from that group. |
| 4. On a scale of 0 (total disagreement) to 10 (total agreement), to what extent do you agree that: If other students hold negative stereotypes about certain groups, it will not affect their evaluations of individual students from that group. |
| Internalization (INT)1 |
| 5. On a scale of 0 (hardworking) to 6 (lazy), do members of your own racial group tend to be lazy or hardworking? |
| 6. On a scale of 0 (intelligent) to 6 (unintelligent), do you think people in your own racial group tend to be unintelligent or intelligent? |
| 7. On a scale of 0 (stick with it) to 6 (give up easily), in general, do you think people of your own racial group tend to give up easily or stick with a task until the end? |
| Academic Performance Burden (APB) |
| 8. On a scale of 0 (total disagreement) to 10 (total agreement), if I let my instructors know that I am having difficulty in class, they will think less of me. |
| 9. On a scale of 0 (total disagreement) to 10 (total agreement), if I excel academically, it reflects positively on my racial or ethnic group. |
| 10. On a scale of 0 (total disagreement) to 10 (total agreement), if I do poorly academically, it reflects negatively on my racial or ethnic group. |
| 11. On a scale of 0 (total disagreement) to 10 (total agreement), I don’t want to look foolish or stupid in class. |
| 12. On a scale of 0 (total disagreement) to 10 (total agreement), if I don’t do well, people will look down on others like me. |
| Academic Effort (EFF) |
| 13. How many hours (between 0–120) do you spend studying in the average seven-day week during the academic year? |
| 14. In thinking about how hard to try in your college studies on a scale from 0 (no importance ) to 10 (utmost importance), how important for you is it to learn the course material? |
| 15. On a scale of 0 (no effort) to 10 (maximum possible effort), how hard would you say you have been trying [academically] during this past year of college? |
| 16. How many hours (between 0–120, reverse coded) do you spend watching television, listening to music for fun, attending parties, and socializing with friends outside parties during the typical seven-day week during the academic year? |
| Academic Performance (PERF) |
| 17. Students’ two-year grade-point-average (GPA) |
Internalization items were reverse-coded from their original format so higher scores correspond to more internalization.
Externalization is measured by respondents’ perceptions of discrimination by whites (v1) and Asians (v2) and the extent to which instructors’ (v3) and students’ (v4) negative stereotypes affect their assessments of individuals from particular groups (Cronbach’s alpha=.59). Internalization is measured by three items reflecting respondents’ perceptions of the work ethic (v5), intelligence (v6), and persistence in completing tasks (v7) of members of their own racial/ethnic groups (Cronbach’s alpha=.61). Academic performance burden is measured by five items reflecting respondents’ perceptions of: whether an instructor’s knowledge that the respondent is having difficulty in class will lead the instructor to think less of him/her (v8), whether excelling or doing poorly academically reflects positively (v9) or negatively (v10), respectively, on the respondent’s racial group, whether/to what extent the respondent fears looking foolish in class (v11), and whether/to what extent doing poorly in class will lead people to look down on others like him/her (v12) (Cronbach’s alpha=.67). Finally, academic effort is measured by the average number of hours the respondent studies each week (v13), how much importance the respondent places on learning course material (v14), the respondent’s subjective rating of his/her overall academic effort during the year (v15), and his/her hours of recreation (reverse-coded) (v16), including time spent watching television, listening to music for fun, attending parties, and socializing with friends outside parties during the typical college week (Cronbach’s alpha=.59).
As discussed earlier, these items measure factors that may increase dispositional susceptibility to stereotype threat. First, these survey items capture students’ average perceptions and experiences of identity threat across semesters as opposed to those based on specific situational triggers. Second, the survey items do not allow us to explicitly differentiate between ungrounded vs. experientially based perceptions of stereotype susceptibility. We cannot identify students’ precise reference when responding to a given survey item. There is likely to be substantial variation in individuals’—or groups’—points of reference. For example, some students’ responses may average over myriad experiences of exposure to negative- ability stereotypes when responding to items about whites and Asians’ treatment of other racial groups, while others reference their most vivid experiences. Students may even reference friends’ experiences with negative-ability stereotypes when answering some questions and reference their own experiences when responding to others. Given this ambiguity in each student’s reference for any given item, the most conservative interpretation of responses to these items is to posit that they reflect individual differences in vigilance to a broadly defined type of “identity threat,” rather than stereotype threat in particular.
Our models also include an “Index of Racial In-Group Exposure” consisting of the sum of four items that measure respondents’ exposure to members of their racial in-group, including: a subjective rating (from 0 to 10) of the strength of students’ identification with their black or Hispanic racial in-group, the percent of friends of the same race they had growing up (based on an average at ages 6, 13, and 18), the percent of their neighborhood that was black or Hispanic while growing up, and a (reverse-coded) subjective rating (from 0 to 10) of their social distance to whites growing up (Cronbach’s alpha=.68). These measures allow us to examine the strength of respondents’ African-American or Hispanic racial identities, which is important for understanding the extent to which students’ racial identification increases their susceptibility to stereotype threat. For example, we expect that first generation immigrants are least likely to identify as African-American or Hispanic and instead favor immigrant or ethnicity-specific identities. For them, less exposure and/or identification with blacks or Hispanics (the “in-group” targeted by the survey questions) may be associated with less vulnerability to the internalization and/or externalization of stereotypes.
In addition to these key variables, we include controls for demographic and background characteristics important in predicting educational outcomes (Bankston 2004; Coleman 1988; Kao 2004; Kao and Rutherford 2007; Harris and Sim 2002; Massey et al. 2003; Woolley et al. 2008). Controls include a multiracial identifier (to help account for heterogeneity in racial identification and experience among those who identify as mixed-race; see Brunsma 2005 for further discussion), sex, the number of siblings in one’s childhood household, an indicator for whether the student was raised in an intact, two-parent/care-taker household, and family socioeconomic status (SES), measured by parental educational attainment and percent of college paid for by family. This latter measure offers a particularly valuable indicator of family social status, because it reflects wealth. Table 2 presents descriptive statistics for all variables used in the analyses by race and immigration group.
Table 2.
Descriptive Statistics of Identity Threat Constructs, Performance, and Control Variables, by Race and Immigrant Generation
| Black | Hispanic | |||||||||||
|---|---|---|---|---|---|---|---|---|---|---|---|---|
|
| ||||||||||||
| 1st Gen | 2nd Gen | Domestic | 1st Gen | 2nd Gen | Domestic | |||||||
| Constructs of Identity Threat and their Effects | Mean | S.D. | Mean | S.D. | Mean | S.D. | Mean | S.D. | Mean | S.D. | Mean | S.D. |
| Externalization (EXT) (α=.588) | ||||||||||||
| Whites treat other races equally or discriminate (0–10) | 6.51 | (2.36) | 7.18 | (1.99) | 7.04 | (2.23) | 6.40 | (2.39) | 6.31 | (2.23) | 6.06 | (2.13) |
| Asians treat other races equally or discriminate (0–10) | 5.99 | (2.57) | 6.37 | (2.41) | 6.05 | (2.51) | 5.94 | (2.39) | 5.51 | (2.54) | 5.28 | (2.40) |
| Instructors’ stereotypes do not affect evaluations of members of stereotyped groups (0–10) | 3.38 | (2.74) | 3.28 | (3.01) | 3.03 | (2.81) | 4.15 | (3.08) | 3.98 | (2.80) | 3.76 | (2.77) |
| Students’ stereotypes do not affect evaluations of members of stereotyped groups (0–10) | 3.44 | (2.58) | 2.90 | (2.65) | 2.92 | (2.72) | 3.82 | (2.71) | 3.66 | (2.55) | 3.43 | (2.48) |
|
| ||||||||||||
| Internalization (INT) (α=.610)1 | ||||||||||||
| Own group’s intelligence (0–6) | 2.38 | (1.12) | 2.37 | (1.03) | 2.35 | (1.01) | 2.45 | (1.11) | 2.55 | (1.06) | 2.66 | (1.01) |
| Own group is hard working (0–6) | 2.51 | (1.31) | 2.46 | (1.09) | 2.51 | (1.12) | 2.46 | (1.17) | 2.41 | (1.20) | 2.38 | (1.06) |
| Own group perseveres (0–6) | 2.53 | (1.42) | 2.59 | (1.13) | 2.51 | (1.19) | 2.43 | (1.09) | 2.51 | (1.12) | 2.53 | (1.03) |
|
| ||||||||||||
| Academic Performance Burden (APB) (α=.665) | ||||||||||||
| Instructors think less of me for having difficulty in class (0–10) | 2.57 | (2.42) | 2.64 | (2.57) | 2.07 | (2.48) | 2.48 | (2.56) | 2.44 | (2.39) | 2.22 | (2.29) |
| Excelling academically reflects positively on my racial/ethnic group (0–10) | 6.53 | (2.75) | 6.61 | (3.27) | 6.81 | (3.03) | 5.78 | (3.28) | 5.61 | (3.27) | 5.54 | (3.03) |
| Doing poorly academically reflects negatively on my racial/ethnic group (0–10) | 5.76 | (3.03) | 5.45 | (3.33) | 5.87 | (3.17) | 4.86 | (3.30) | 4.59 | (3.24) | 4.37 | (2.97) |
| I don’t want to look foolish or stupid in class (0–10) | 5.79 | (2.89) | 5.94 | (3.29) | 5.50 | (3.07) | 5.38 | (3.11) | 5.27 | (2.84) | 5.00 | (2.81) |
| If I don’t do well, people will look down on others like me (0–10) | 4.82 | (2.81) | 4.78 | (3.12) | 4.24 | (2.93) | 3.66 | (2.81) | 3.63 | (2.68) | 3.29 | (2.77) |
|
| ||||||||||||
| Academic Effort (EFF) (α=.592) | ||||||||||||
| Average Number of Hours Studied in a 7 day Week/10 (0–12) | 3.09 | (1.56) | 3.01 | (1.78) | 2.61 | (1.44) | 3.20 | (1.80) | 2.78 | (1.50) | 2.75 | (1.53) |
| Importance of learning course material (0–10) | 8.70 | (1.82) | 8.47 | (1.73) | 8.27 | (1.96) | 8.81 | (1.67) | 8.32 | (1.70) | 8.16 | (1.82) |
| Self-reported [academic] effort during past year of college (0–10) | 7.07 | (1.80) | 7.11 | (1.82) | 6.98 | (1.82) | 6.90 | (1.88) | 6.79 | (1.79) | 6.87 | (1.86) |
| Average Number of Hours of Recreational Activities during a 7 day Week/10 (0–10)2 | 2.34 | (0.22) | 2.29 | (0.30) | 2.31 | (0.26) | 2.31 | (0.25) | 2.33 | (0.23) | 2.30 | (0.26) |
|
| ||||||||||||
| Academic Performance (GPA) | ||||||||||||
| Average Second and Third Semester GPA | 3.02 | (0.56) | 3.03 | (0.43) | 2.99 | (0.51) | 3.13 | (0.44) | 3.12 | (0.47) | 3.19 | (0.48) |
|
| ||||||||||||
| Control Variables | ||||||||||||
| Demographic (DEM) | ||||||||||||
| Male | 0.33 | (0.47) | 0.35 | (0.48) | 0.34 | (0.47) | 0.44 | (0.50) | 0.40 | (0.49) | 0.42 | (0.49) |
| Multiracial | 0.16 | (0.37) | 0.20 | (0.40) | 0.16 | (0.36) | 0.15 | (0.36) | 0.28 | (0.45) | 0.41 | (0.49) |
| Intact (Two-Parent) Family/Household Growing Up | 0.55 | (0.50) | 0.58 | (0.49) | 0.50 | (0.50) | 0.62 | (0.49) | 0.68 | (0.47) | 0.66 | (0.47) |
| Number of Dependents (0–18yrs) at Home in Last Year of High School | 2.12 | (1.22) | 2.01 | (1.11) | 1.84 | (1.02) | 1.85 | (1.01) | 1.92 | (1.04) | 1.95 | (0.95) |
|
| ||||||||||||
| Socio-Economic Status (SES) | ||||||||||||
| One parent has B.A. (or equivalent) | 0.13 | (0.34) | 0.17 | (0.37) | 0.17 | (0.37) | 0.16 | (0.37) | 0.14 | (0.35) | 0.19 | (0.39) |
| Two parents have B.A. (or equivalent) | 0.11 | (0.31) | 0.10 | (0.29) | 0.13 | (0.33) | 0.13 | (0.34) | 0.07 | (0.26) | 0.16 | (0.36) |
| One parent has Advanced Degree | 0.22 | (0.42) | 0.27 | (0.44) | 0.22 | (0.41) | 0.25 | (0.43) | 0.26 | (0.44) | 0.24 | (0.42) |
| Two parents have Advanced Degree | 0.16 | (0.37) | 0.22 | (0.42) | 0.14 | (0.34) | 0.17 | (0.37) | 0.14 | (0.35) | 0.17 | (0.38) |
| % of college paid for by family (%/10) | 3.91 | (3.72) | 4.37 | (3.59) | 3.67 | (3.52) | 4.61 | (4.03) | 4.70 | (3.87) | 5.04 | (3.65) |
| Average Hours of Work for Pay During First Two Years of College (/10) | 0.68 | (0.75) | 0.63 | (0.83) | 0.70 | (0.98) | 0.69 | (0.95) | 0.65 | (0.82) | 0.59 | (0.90) |
|
| ||||||||||||
| Index of Racial Ingroup Exposure (IEX) (α=.658) | ||||||||||||
| Strength of ingroup racial identity (0–10) | 3.92 | (1.80) | 4.01 | (1.96) | 4.55 | (1.85) | 3.16 | (1.76) | 3.46 | (1.84) | 3.13 | (1.78) |
| Percent of same-race friends growing up (%/10) | 5.67 | (3.44) | 4.27 | (3.34) | 5.94 | (3.38) | 3.77 | (3.61) | 2.62 | (2.90) | 2.07 | (2.59) |
| Percent black or Hispanic neighborhood composition growing up (%/10) | 4.71 | (3.10) | 4.21 | (2.90) | 4.74 | (2.87) | 5.37 | (3.19) | 3.61 | (2.90) | 2.74 | (2.59) |
| Social distance from whites growing up (0–10, reverse-coded) | 4.74 | (1.61) | 4.44 | (1.67) | 4.53 | (1.69) | 3.80 | (1.76) | 3.72 | (1.80) | 3.46 | (1.69) |
|
| ||||||||||||
| Academic Preparation (DAP) | ||||||||||||
| Number of AP Courses Taken (0–10) | 2.74 | (1.94) | 2.75 | (1.86) | 2.55 | (1.97) | 3.08 | (1.98) | 3.45 | (2.22) | 2.99 | (2.01) |
| High School GPA (0–4) | 3.65 | (0.30) | 3.60 | (0.30) | 3.58 | (0.39) | 3.72 | (0.32) | 3.70 | (0.32) | 3.74 | (0.33) |
| Self-rated preparation level (0–10) | 5.37 | (1.58) | 5.38 | (1.64) | 5.64 | (1.68) | 5.54 | (1.68) | 5.53 | (1.63) | 5.43 | (1.68) |
|
| ||||||||||||
| N (=1865) | 79 | 180 | 732 | 171 | 427 | 276 | ||||||
Responses were reverse-coded so higher scores correspond to lower ratings of intelligence, work ethic, and perseverence.
Recreational activities consist of watching television, listening to music for fun, attending parties, or spending time with friends outside parties. This indicator is reverse-coded when included in models because more recreational time is associated with less academic effort.
Methods
We use a multiple group structural equation modeling (SEM) approach in our analyses. SEM methods allow for the investigation of relationships between theoretical concepts (latent variables constructed through factor analysis) while simultaneously controlling for measurement error in observed measures (see Bollen 1989). Such an approach is important for two reasons. First, given the somewhat low Cronbach’s alphas of the key constructs in our model, SEM allows us to use factor analyses (rather than summed indexes) to measure the key constructs of our model. Second, SEM also allows us to empirically assess how well the key constructs represent the concepts of interest across race and immigrant groups.
The first issue—whether the constructs of stereotype threat in fact measure the same phenomena for each group—has generally been ignored in prior research on stereotype threat. Most studies have relied on summed indexes. However, if any differences by group in the way that the indicators reflect the constructs of interest are ignored, then differences in regression coefficients between race and immigrant groups may be biased. SEM allows us to differentiate substantive versus measurement differences. We can therefore more accurately test whether different race and immigrant generation groups experience identity threat in the same way.
To address the second issue—whether the externalization and internalization mechanisms “work” the same way for each race/immigrant group (i.e., whether regression coefficients are similar)—we disaggregate the data by immigrant generation and race into six groups: (1) first generation blacks, (2) second generation blacks, (3) domestic blacks (third generation or higher), (4) first generation Hispanics, (5) second generation Hispanics, and (6) domestic Hispanics.5 We use broad racial/ethnic categorizations because sub-group cell sizes preclude their separate analyses (see Appendix A for details).
Figure 2 shows the SEM path diagram we use to operationalize the conceptual model of stereotype threat shown in Figure 1 for each race and immigrant generation group. Each circle in Figure 2 represents a latent variable for one of the key constructs of stereotype threat theory. Double-lined arrows represent regression paths between constructs. Squares represent observed variables used to measure each latent variable (variable labels are shown in Table 1). Single-line arrows connecting observed measures to latent constructs represent measurement relationships. Dotted-line arrows indicate regression paths between control variables and latent constructs.
Figure 2. Path Diagram for Externalization and Internalization Mechanisms and Academic Performance1.

1 See Table 1 for specification of measures v1–v17.
As a preliminary step, we used factor analyses and goodness-of-fit tests to assess whether sufficient measurement error and between-group differences existed to necessitate an SEM instead of a set of regressions on summed indexes. Results established the need for an SEM approach (see Appendix B; complete results available upon request).
Our subsequent analyses employed the following strategy. First, we estimated a full multiple-group SEM model to test the general fit of the model shown in Figure 2. Our goal was to determine whether the full model fit the data well for all six race-immigrant groups. Next, we investigated whether the structural model parameters differed across race and immigrant groups. Differences in structural parameters would indicate that the model “worked” differently across groups. Third, after determining that differences in structural coefficients exist by immigrant generation, but not by race, we simultaneously estimated three separate SEM models for the immigrant generation groups, controlling on the background characteristics shown in Table 2. Finally, we ran two sensitivity analyses to establish the robustness of the relationships between latent constructs. Our goal was to ensure our results were robust to slight changes in indicator selection for each latent construct (results available upon request).6
Focusing on differences by immigrant generation, hypotheses 1 and 2 concern expected differences in levels of internalization, externalization, effort, and performance burden. We also examine whether higher levels of racial in-group exposure may be associated with higher levels of externalization (hypothesis 3). Finally, although we expect relatively uniform levels of externalization, internalization, and performance burden across groups, it is nonetheless possible that the effects of internalization on effort, externalization on performance burden, etc. vary by immigrant generation (hypotheses 4 and 5). Because prior research shows both internalization and externalization mechanisms lower the performance of domestic minority students at elite institutions, we treat domestic minorities as our comparison group.
RESULTS
Differences in Levels of Externalization, Internalization, Performance Burden, and Effort
Given first and second generation immigrants’ awareness of the salience of racial categorizations in the United States, our first hypothesis is that even first and second generation immigrants perceive similar levels of stereotypes about blacks and Hispanics. We hypothesize this recognition will translate into similar levels of externalization, internalization and performance burden for immigrant and domestic blacks and Hispanics. In other words, immigrant students’ responses will be driven by their interpretation of the survey items as referencing minorities overall. Based on the means shown in Table 2, our results support this hypothesis. We find non-significant differences (p>.05) in the means of summed indexes for externalization, internalization, and performance burden between immigrant and domestic minority students, net of controls (results available upon request). However, Hispanics report roughly 9 and 12 percent lower mean levels of externalization and performance burden, respectively, compared to blacks.
Our second “levels” hypothesis—also based on the results shown in Table 2—is that first and, to a lesser degree, second generation immigrants report higher levels of academic effort than their same-race domestic counterparts. We find some support for this hypothesis. On the basis of summed indexes consisting of the four items used to measure academic effort, effort among first generation black immigrants is 4 percent higher than that of both second generation and domestic blacks, net of controls (results available upon request). The same pattern exists for Hispanics. First generation Hispanics report roughly 4 percent higher mean levels of effort than second generation and domestic Hispanics. However, these differences by immigrant generation are modest in magnitude. We find no statistically significant differences in mean levels of academic effort between second generation immigrants and their same-race domestic counterparts.
A Parsimonious Model of Group Differences in Two Mechanisms of Identity Threat
Having established only modest differences in mean levels of externalization, internalization, performance burden and effort, between race and immigrant generation groups, we next identify a parsimonious model for capturing race and immigrant-generation differences in the associations between externalization and internalization and performance. Table 3 shows the results for the first two steps of the analyses. In the first model, all parameters were allowed to vary by race and immigrant generation. The results indicate that the model fit the data well by two of three measures of goodness-of-fit: the RMSEA was .04, and the CFI is 0.91, indicating good fit. Although the model chi-square indicated poor fit (2653.53, 1742 d.f., p<0.001), it is common for models with large sample sizes to have statistically significant chi-squares (see Bollen 1989 for discussion of model fit measures).
Table 3.
Changes in Structural Equation Model Fits by Estimation Strategies for All Six Race-Immigrant Generation Groups (N=1865)1
| Model | Chi-square (d.f.) | Diff in Chi-Square (d.f.)2 | Goodness of Fit Measures |
|---|---|---|---|
| (1) All groups estimated separately | 2653.53(1742)*** | CFI 0.91 RMSEA 0.04 |
|
| (2) Blacks and Hispanics estimated separately | 2770.84(1779) | 117.31(37)*** | CFI 0.83 RMSEA 0.04 |
| (3) Immigrant generations estimated separately | 2672.40(1755)*** | 18.87(13) | CFI 0.91 RMSEA 0.04 |
| (4) First and second generations collapsed (‘immigrant’) vs. domestics | 2761.43(1777)*** | 107.90(35)*** | CFI 0.85 RMSEA 0.04 |
| (5) Second generation and domestic students collapsed vs. first generation students | 2752.55(1778) | 99.02(36)*** | CFI 0.85 RMSEA 0.04 |
Significant at .05,
Significant at .01,
Significant at .001.
One-tailed test.
University-level fixed effects are included in all models in order to remove between-university variation, effectively fitting the model based on within-university variation between specified groups.
Difference in Chi-square statistic indicates difference from model (1) where all six race-immigrant generation groups are estimated separately.
In our second model, we constrained the structural (regression) parameters to be equal across immigrant generations but allowed them to vary across racial groups. The fit of that model was worse than that of Model 1 (chi-square=2770.84,1779 d.f., p<0.001; CFI=0.78; RMSEA=0.05). A chi-square difference test indicated that imposing these constraints significantly worsened the fit of the model (chi-square=117.31, 37 d.f., p<0.001).
In Model 3, we allowed parameters to vary across immigrant generation, but not across race. This model yielded fit measures comparable to that of Model 1 (chi-square=2672.40, 1755 d.f., p<0.001; CFI=0.91; RMSEA=0.04). A chi-square difference test between Models 1 and 3 indicated a non-significant difference (difference chi-square=18.87, 13 d.f., p>.05). In model 4, we constrained parameters to be equal for first and second generation immigrants (but free for domestic minority students). This model fit poorly (chi-square=2761.43,1777 d.f., p<0.001; CFI=0.85; RMSEA= 0.04), and a chi-square difference test comparing Model 4 to Model 1 indicated a significant loss of fit (difference chi-square=107.90, 35 d.f., p<0.001). Finally, in model 5 we constrained parameters to be equal for second generation immigrants and domestic minorities, but free for first generation immigrants. This model also yielded a poorer fit (chi-square=2752.55, 1778 d.f., p<0.001; CFI=.84; RMSEA=.04), and the chi-square difference test comparing to Model 1 indicated significant loss of fit (chi-square=99.02, 36 d.f., p<0.001). We conclude from these models that the structural (regression) parameters in the model differ across immigrant groups, but not across racial groups. This finding lends support to hypotheses three and four, which highlight our prediction that students’ experiences of the internalization and externalization mechanisms would vary significantly by immigrant generation.
To test hypotheses 3, 4, and 5 in more depth, Table 4 presents the complete results from Model 3 in Table 3, in which the regression paths in Figure 2 were allowed to vary by immigrant generation but not by race (r-square values establishing reliability, and factor loadings for assessing validity are shown in Appendix C; because no systematic patterns were found by race or immigrant generation, regression coefficients for the effects of control variables are shown in Appendix D).7 Note that, although we rely on institutional racial classifications of respondents to preserve the 5% of respondents who did not provide a racial/ethnic self-classification, model results based on student self-classification do not change substantively from those based on students’ institutional racial classification.
Table 4.
Structural Equation Model Results of Relationships Between Externalization, Internalization, Performance Burden, Effort, and Performance Based on Institution’s Racial/Ethnic Categorization1
| 1st Gen | 2nd Gen | Domestic | |
|---|---|---|---|
| Structural Parameters for Paths Between Constructs2 | |||
| Externalization → Academic Performance Burden (APB) | 0.02 (0.08) | 0.03 (0.05) | 0.10 (0.05)* |
| APB → Academic Performance (GPA) | −0.05 (0.10) | −0.01 (0.05) | −0.08 (0.04)* |
| Externalization →Academic Performance (GPA) | −0.03 (0.05) | 0.04 (0.06) | 0.07 (0.05) |
| Internalization →Academic Effort (EFF) | −0.03 (0.08) | −0.11 (0.05)* | −0.24 (0.06)*** |
| Academic Effort (EFF) → Academic Performance (GPA) | 0.10 (0.05)* | 0.18 (0.07)** | 0.27 (0.05)*** |
| Internalization → Academic Performance (GPA) | 0.11 (0.08) | 0.06 (0.05) | 0.13 (0.05)** |
| Index of Racial In-group Exposure3 as a Predictor of: | |||
| Internalization (INT) | −0.18 (0.14) | −0.10 (0.10) | −0.05 (0.05) |
| Academic Effort (EFF) | 0.19 (0.32) | 0.01 (0.09) | 0.04 (0.05) |
| Externalization (EXT) | 0.06 (0.18) | 0.22 (0.10)* | 0.31 (0.05)*** |
| Academic Performance Burden (APB) | 0.10 (0.17) | 0.09 (0.08) | 0.00 (0.05) |
| Academic Performance (GPA) | −0.64 (1.57) | −0.01 (0.09) | −0.03 (0.05) |
|
| |||
| N (=1865) | 250 | 607 | 1008 |
| Chi-squared (d.f.) | 2672.40(1755)*** | ||
| RMSEA | 0.04 | ||
| CFI | 0.91 | ||
Significant at .05,
Significant at .01,
Significant at .001.
One tailed test.
NOTES: Reporting Standardized coefficients. Standard errors in parentheses. University-level fixed effects. Effects of control variables on each construct shown in Appendix D.
Race/ethnicity based on institution classifications of “Hispanic” or “black”. A control variable is used to identify multiracial black or Hispanic students (results based on students’ racial/ethnic self-classifications do not change substantively).
Structural residual error correlations are estimated between internalization and externalization and between academic performance burden and academic effort. Measurement error correlations are estimated between indicators v6 and v7 and v10 and v11 (See Table 1 for list of variables by number). Models include controls for the demographic, prior academic performance, and social class characteristics outlined in the appendices.
The index of Racial In-group Exposure (IEX) includes: Strength of racial in-group identity (0–10), social distance from whites growing up (0–10, reverse-coded), percent of friends of same race as respondent while growing up, and percent black or Hispanic neighborhood composition growing up.
The overall model fit indexes shown in Table 4 suggest the model fits well. While the model chi-square is statistically significant (chi-square= 2672.4, d.f. =1755, p<0.001), both the RMSEA (0.040) and the CFI (0.91) suggest that the model fits quite well. The first panel of Table 4 displays estimated structural regression paths between externalization, internalization, academic performance burden, academic effort, and academic performance. The second panel presents regression coefficients for the effect of racial in-group exposure on each latent variable. Post-hoc tests indicate that the magnitudes of the coefficients are significantly different from one another across immigrant generation (results available upon request). Expected and observed directions of the structural paths are shown by immigrant generation in Figure 3.
Figure 3. Directions of Expected vs. Actual Structural Paths between Latent Constructs and Effects of Racial In-Group Exposure, by Immigrant Generation.

Note: E=expected direction of effect based on stereotype threat theory. IEX=index of racial in-group exposure (see Table 2 for index properties). 1=first generation, 2=second generation, 3=domestic students. Only significant paths are shown with a + or − sign; 0’s indicate statistically zero coefficients.
Our third hypothesis is that in-group racial exposure is not associated with an increase in externalization among first generation immigrants, is slightly positively associated for second generation immigrants, and is strongly associated for domestic minority students. We find support for this hypothesis. A one unit increase in exposure is associated with a small but non-significant 0.06 unit increase in externalization among first generation immigrants, a larger and statistically significant 0.22 unit increase in externalization among second generation immigrants, and a still larger and highly significant 0.31 unit increase in externalization among domestic minorities.
Results generally support our fourth hypothesis—that stereotype externalization does not dampen the grades of first or second generation immigrants. Although we hypothesize—and find—that the relationship between externalization and academic performance burden is statistically zero for first generation immigrants (0.02, p>0.05), we also find the same holds true for second generation immigrants (0.03, p>0.05). Furthermore, the magnitudes of association are almost identical for both groups. As expected, externalization is associated with a significant increase in performance burden for domestic minority students (0.10, p<0.05). The association between academic performance burden and grade performance is also statistically zero for both first and second generation students (−0.05 and −0.01, respectively, p>0.05). Performance burden is associated with a significant decrease in performance for domestic minorities (−0.08, p<0.05). The direct effect of externalization on academic performance is statistically zero for all groups (−0.03, 0.04, and 0.07 for first generation, second generation, and domestic students, respectively, p>0.05), indicating that externalization is associated with academic performance through the posited mechanism of academic performance burden even once measurement error has been eliminated through SEMs.
Our fifth hypothesis is that the associations between stereotype internalization, academic effort, and grades increase in magnitude across immigrant generations. As expected, we find that first generation immigrants are not affected by the potentially grade-dampening effects of stereotype internalization (−0.03, p>0.05). In fact, the only statistically significant relationship for first generation students is that between academic effort and performance (0.10, p<0.05). For second generation immigrants and domestic minorities, however, a negative association between stereotype internalization and academic effort exists. The magnitude of the negative association between internalization and effort is less than half as large for second generation immigrants (−0.11, p<0.05) as for domestic minorities (−0.24, p<0.001). Interestingly, the association between effort and performance is more than twice as strong for domestic students as for first generation immigrants, and almost twice as strong for domestic students as for second generation immigrants (0.10, p<0.05 among first generation students, 0.18, p<0.01 among second generation students, and 0.27, p<0.001 among domestic students).
Although paths from internalization to academic effort and from effort to performance are significant for both second generation immigrant and domestic students, the strength of the relationships differs for the two groups. For domestic minorities, internalization has a negative association with effort that is twice as strong as that for second generation immigrants, and a positive association between effort and performance that is also almost twice as strong as for second generation immigrants. Furthermore, for only domestic minorities, the direct relationship between internalization and performance is also positive and statistically significant (0.13, p<0.01). This residual direct effect suggests internalization does not operate exclusively through effort as it is measured here. It may operate through unobserved or unmeasured effort or through some other factor. Overall, these results indicate that internalization works as expected for domestic minorities but less well for more recent immigrant students.
Group Differences in the Overall Effects of Threat on Performance
Finally, we present predicted GPAs to exemplify more concretely the influence of the components of identity threat on students of varying immigrant generations. We calculate predicted GPAs for three hypothetical students—a first generation, second generation, and domestic minority student—under three conditions: low, medium, and high levels of identity threat. All covariates were set to their means/modes. Low, medium, and high levels of externalization, internalization, effort, and performance burden were established at three standard deviations below, at, and three standard deviations above their respective means.
Figure 4 reveals several important patterns. First, the “average” second generation student is expected to have the highest GPA (about 3.2). Second, the “average” first generation and domestic minority student are expected to have comparable, but lower GPAs (around 2.7). Third, the relationship between level of identity threat and predicted GPA differs considerably depending on immigrant generation. First generation expected GPA tends to increase with higher levels of identity threat, rising from 2.6 at low levels of threat to 2.8 at high levels of threat. Second generation GPA seems impervious to changes in level of identity threat. Third generation expected GPA tends to decrease with higher levels of identity threat, falling from 2.9 at low levels of threat, to 2.5 at high levels of threat.
Figure 4. Predicted GPAs for a Hypothetical Student1 at Low, Medium, and High Levels2 of Externalization, Internalization, Performance Burden, and Effort, by Immigrant Generation.

1The hypothetical student has the modal characteristics on each categorical variable and sample mean characteristics for all continuous variables. Specifically, she is a monoracial, first generation college-going black or Hispanic female from a non-intact family without siblings, whose parents paid the sample-mean percent of tuition and who has the mean level of in-group racial exposure and degree of academic preparation.
2Low levels of internalization, externalization, effort, and performance burden correspond to three standard deviations below the sample mean of each construct, medium levels correspond to the sample mean of each construct, and high levels correspond to three standard deviations above the sample mean of each construct.
These results are very consistent with our general hypothesis. Net of other considerations, like level of exposure to racial in-groups and socioeconomic background, domestic minority students are most susceptible to identity threat. First and second generation immigrants seem resilient to threat. Indeed, first generation immigrants appear to be motivated to do better under threat. Second generation student response to threat, in contrast, appears to be a “composite” of the response of first generation students and that of domestic minority students. One explanation may be that second generation immigrants are in a unique position to benefit from understanding structural and culture features of the US that help them navigate the education system (compared to first generation students) but simultaneously suffer from recognizing—and buying into—their position in the U.S. racial hierarchy, albeit to a lesser extent than domestic minorities.
DISCUSSION AND CONCLUSION
In this study, we ask: Are first and second generation immigrants susceptible to the same grade-lowering effects of externalization and internalization as domestic minority students? Our hypotheses suggest that they are not. Rather, we propose that first and, to a lesser extent, second generation immigrant minority students may be resilient to race-based negative ability stereotypes. Their resilience may be based on their unique ethnic-immigrant identities. Our main findings are three-fold: First, we find the importance of the factors we use to capture externalization, internalization, performance burden, and effort varies across group. This lends initial support for variation in students’ experience of each factor by race, immigrant generation, or both. Second, probing deeper, we find the biggest differences in the effects of externalization on performance burden, internalization on effort, and burden and effort on grades fall along lines of immigrant generation, not race. Third, first generation immigrants are the most resilient against the effects of both the externalization and internalization mechanisms, second generation immigrants are only resilient against the externalization mechanism but are susceptible to the internalization mechanism, and domestic minority students experience both mechanisms in line with stereotype threat theory.
These findings provide some evidence for second generation decline. They point to stereotype susceptibility as an important mechanism through which to understand how and why decline occurs, even among elite college students. Results also call into question the racial classification system that permeates much of the education and stratification research—and American society. Despite its prevalence, this system overlooks significant heterogeneity among minority students along lines of immigrant background. Our findings call for a more nuanced understanding of the intersection of race and ethnicity with immigrant generation. As America’s immigrant population expands, elite colleges and universities adjust to these demographic changes disproportionately represented in their ranks. They will need to consider alternate explanations for the similarly low grades of minority immigrants compared to domestic minority students (Massey et al. 2007).
Our first hypothesis draws on qualitative research suggesting that first generation immigrants identify least with American racial categories (Portes and Rumbaut 2006; Waters 1999). Why, then, do they experience similar levels of externalization, internalization, and performance burden as second generation and domestic minority students? Aware of the dominance of racial categorizations, we believe first generation immigrants report based on their perceptions of negative stereotypes about their racial group as a whole, which is dominated by domestic minorities. However, unlike domestic minorities, their ethnic-immigrant identities—grounded in a sense of self-determination and a perception of opportunities in the mainstream economy—lead them to believe hard work pays off. As a result, they report higher levels of academic effort than their second generation and domestic counterparts, in line with our second hypothesis. Their dual self-schema offers an important buffer against the potential effects of exposure to most negative stereotypes.
Overall, the first generation’s resilience against the effects of stereotype externalization and internalization on grades is exhibited through our finding that first generation immigrants experience an increase in grades even under high levels of exposure to negative ability racial stereotypes. However, because our study tests students’ vulnerability to dispositional triggers averaged over long periods of time (i.e., multiple semesters of college), while experimental studies test students’ vulnerability to situational triggers, we cannot rule out the possibility that even first generation immigrants may be susceptible to strong situational triggers. Our conclusions therefore extend only to immigrants’ limited dispositional sensitivities to stereotype threat when averaged over myriad exposures to stereotype threat of varying severity.
Our third hypothesis is grounded in the notion that second generation immigrants, unlike their first generation counterparts, are more assimilated into domestic minority identities. Accompanying their heightened exposure to domestic minorities, the second generation may believe they are included in the lower ability group targeted by negative stereotypes (Crocker, Major and Steele 1998; Oyserman et al. 2003). We find second generation immigrants’ greater exposure to African-Americans and Hispanics while growing up is in fact associated with an increase in second generation immigrants’ level of externalization. (Following a similar pattern, we also find in-group racial exposure is associated with the largest increase in level of externalization among domestic minority students.) Buy-in to negative stereotypes about themselves also facilitates the second generation’s susceptibility to the effects of stereotype internalization on lowered effort and, subsequently, grades. In line with our fifth hypothesis, we believe second generation immigrants experience stereotype internalization’s effects via lowered effort and decreased grade performance because greater assimilation into America’s racial classification system limits their belief in their own abilities. As a result, they are more likely to perceive limits to the payoffs of academic effort, leading to lower effort and dampened performance.
Even if second generation immigrants buy into negative stereotypes about themselves—they nonetheless believe others outside their group do not. Instead, they believe their parents’ sacrifices to migrate are warranted because others perceive them as viable candidates for opportunities in mainstream society. As such, in support of our fourth hypothesis, we find the second generation is resistant to the effects of externalization on performance burden and grades.
Interestingly, despite their experience of the effects of internalization, we find second—rather than first—generation immigrants earn the highest grades, in line with prior research (Kao and Tienda 1995, 1998; Kao and Thompson 2003; Zhou and Bankston 1998; Zhou, Lee, Vallejo, Tafoya-Estrada and Xiong 2008). Their advantage is facilitated by their parents’ sacrifices for their children, their sense of responsibility for high academic performance (Kasinitz 2008; Turney and Kao 2009), and their familiarity with the educational norms and expectations and language systems of the United States (Kao and Thompson 2003).
Although this study emphasizes the importance of considering heterogeneity within racial groups based on immigrant generation, future research should consider the following: First, although our inferences presume a difference between domestic minorities’ and first and second generation immigrants’ self-schemas and in-group identities, we lack an explicit, empirical measure of how immigrants define their in-group. Measure of identification along ethnic and immigrant (in addition to racial) lines would remedy this limitation to directly address how identifying as an immigrant may help buffer against the effects of negative stereotypes.
Second, future research would also benefit from having detailed measures of the mechanisms through which the internalization of negative stereotypes lowers academic performance. Our finding that domestic minority students invest less academic effort at higher levels of internalization is reinforced by experimental work that draws the same conclusions (Steele 1988, 1998). However, we also find these associations are not fully explained through our hypothesized paths. We find a strong direct path from internalization to performance after controlling on effort. For example, some minority students may spend less time studying because they spend more time in extracurricular and recreational activities that help create and maintain community, which combats—rather than reinforces—disidentification (Charles, Torres and Brunn 2008; Charles et al. 2009; Morgan and Mehta 2004). Extracurricular involvement may foster a sense of belonging that increases academic self-confidence and other factors that in turn are positively associated with grades, even if not through academic effort directly.
Third, future data collection efforts would benefit from larger and more ethnically-representative samples of each immigrant generation group. Although we treat Hispanics as a racial group based on the fact that Hispanics/Latinos are racialized within the American context (Cornell and Hartmann 2007; Omi and Winant 1994; Telles and Ortiz 2008), Hispanics span multiple racial categories. Similarly, even same-race students reflect tremendous heterogeneity by national origin (Tafoya 2004). Larger numbers of black Hispanics as well as of the largest ethnic background groups—such as Mexicans—spread over immigrant generations would provide greater power in our analysis, especially for the first generation immigrants for whom the posited mechanisms explain very little. Combined with measures explicitly referencing an ethnic-immigrant in-group, larger samples of black Hispanics as well as of Mexicans, Puerto Ricans, Cubans, and Caribbean versus African origin immigrant blacks would also allow for more accurate and nuanced analyses of immigrant self-schemas and their influence on the relationship between negative racial stereotypes and performance.
Acknowledgments
We thank Doug Massey and Camille Charles for generous use of the National Longitudinal Survey of Freshmen data. We also thank Marta Tienda, Delia Baldassarri and the members of the 2008–09 Empirical Seminar at Princeton University, and three anonymous reviewers for invaluable feedback. Owens acknowledges support of a Graduate Research Fellowship from the National Science Foundation during the preparation of this manuscript.
Appendix A1
Institution-Identified Hispanic Respondents’ Self-Described Racial & Ethnic Origins
| Racial & Ethnic Origin | Freq. | Percent | Cum. |
|---|---|---|---|
| Non-Hispanic White | 16 | 1.75 | 1.75 |
| Filipino | 3 | 0.33 | 2.07 |
| Indian | 1 | 0.11 | 2.18 |
| Asian, other | 1 | 0.11 | 2.29 |
| Black-Mexican | 48 | 5.24 | 7.53 |
| Black-Puerto Rican | 21 | 2.29 | 9.83 |
| Black-Cuban | 6 | 0.66 | 10.48 |
| Black-Dominican | 14 | 1.53 | 12.01 |
| Black-Central American | 12 | 1.31 | 13.32 |
| Black-South American | 19 | 2.07 | 15.39 |
| White-Mexican | 188 | 20.52 | 35.92 |
| White-Puerto Rican | 68 | 7.42 | 43.34 |
| White-Cuban | 35 | 3.82 | 47.16 |
| White-Dominican | 13 | 1.42 | 48.58 |
| White-central American | 30 | 3.28 | 51.86 |
| White-South American | 119 | 12.99 | 64.85 |
| Mixed race | 264 | 28.82 | 93.67 |
| Other | 53 | 5.79 | 99.45 |
| Refused | 3 | 0.33 | 99.78 |
| Don’t know | 2 | 0.22 | 100 |
|
| |||
| Total | 916 | 100 | |
Appendix A2
Institution-Identified Black Respondents’ Self-Described Racial & Ethnic Origins
| Racial & Ethnic Origin | Freq. | Percent | Cum. |
|---|---|---|---|
| Non-Hispanic White | 4 | 0.38 | 0.38 |
| Non-Hispanic Black | 806 | 76.69 | 77.07 |
| Indian | 4 | 0.38 | 77.45 |
| Asian, other | 2 | 0.19 | 77.64 |
| Black-Mexican | 2 | 0.19 | 77.83 |
| Black-Puerto Rican | 2 | 0.19 | 78.02 |
| Black-Cuban | 2 | 0.19 | 78.21 |
| Black-Dominican | 2 | 0.19 | 78.4 |
| Black-Central American | 9 | 0.86 | 79.26 |
| Black-South American | 4 | 0.38 | 79.64 |
| White-Puerto Rican | 1 | 0.1 | 79.73 |
| Mixed race | 172 | 16.37 | 96.1 |
| Other | 39 | 3.71 | 99.81 |
| Refused | 1 | 0.1 | 99.9 |
| Don’t know | 1 | 0.1 | 100 |
|
| |||
| Total | 1,051 | 100 | |
Appendix B
Preliminary analyses involved comparing a latent variables-based measurement modeling strategy to the traditional summed indexes approach to establish which offered a better fit to our data. First we fit four measurement models—one each for externalization, internalization, performance burden, and academic effort—allowing weights given to each indicator of each latent construct to vary for each of our six race-immigrant groups. Next, we compared these results to measurement models that are akin to summed indexes in that they assume no inter-item variability in weighting and measurement error. Based on three measures of model fit commonly used to test goodness-of-fit in structural equation models (the model chi-square, the RMSEA, and the CFI; see Bollen 1989) and t-tests to examine the significance of each indicator in adding value in the measurement of each latent construct for each of the six race-immigrant groups, we examined results from a combination of goodness-of-fit tests as well as significance tests for the factor loadings (weights) of each indicator.
We found that the latent constructs of stereotype threat theory are best modeled using latent variables via measurement models as opposed to summed indexes based on both the goodness-of-fit tests and the t-tests. Specifically, the multiple group confirmatory factor analysis measurement models of the latent constructs have good to strong fit when estimated separately for all six race-immigrant groups (results available upon request). In contrast, the summed index models did not fit well, indicating that an appropriate model should use SEM to handle measurement error and differential weighting of indicators in representing latent concepts. The second step for establishing the value-added of a latent variables approach was to examine the significance and variability in magnitudes of the indicator factor loadings for each latent construct. Results showed the significance and noticeable variation in the magnitudes of each factor loading for each latent construct, respectively indicating that each variable enhances the measurement of its latent construct and that a summed indexes approach with ordinary least squares regression does not most accurately capture the true variance of the construct it intends to proxy. The unequal weighting for each indicator of a latent construct allowed by the measurement models, on the other hand, uses the joint variance of all indicators, providing a more robust measure of each construct by controlling for the measurement error produced by each indicator on its own.
Appendix C
R-Square Values and Factor Loadings for Items in Each Latent Construct (Externalization, Internalization, Performance Burden, Effort, and GPA)
| 1st Gen | 2nd Gen | Domestic | ||||
|---|---|---|---|---|---|---|
|
| ||||||
| Constructs of Stereotype Threat | R2 | F.L. | R2 | F.L. | R2 | F.L. |
| Externalization (EXT) (α=.588) | ||||||
| Whites treat other races equally or discriminate (0–10) | 0.21 | 0.42 | 0.54 | 0.67 | 0.22 | 0.68 |
| Asians treat other races equally or discriminate (0–10) | 0.30 | 0.82 | 0.14 | 0.55 | 0.27 | 0.53 |
| Instructors’ stereotypes do not affect evaluations of members of stereotyped groups (0–10) | 0.15 | 0.32 | 0.18 | 0.18 | 0.20 | 0.22 |
| Students’ stereotypes do not affect evaluations of members of stereotyped groups (0–10) | 0.29 | 0.17 | 0.31 | 0.26 | 0.23 | 0.22 |
|
| ||||||
| Internalization (INT) (α=.610) | ||||||
| Own group’s intelligence (0–6) | 0.35 | 0.94 | 0.32 | 0.56 | 0.23 | 0.54 |
| Own group is hard working (0–6) | 0.33 | 0.51 | 0.52 | 0.72 | 0.50 | 0.67 |
| Own group perseveres (0–6) | 0.33 | 0.36 | 0.27 | 0.52 | 0.25 | 0.63 |
|
| ||||||
| Academic Performance Burden (APB) (α=.665) | ||||||
| Instructors think less of me for having difficulty in class (0–10) | 0.18 | 0.28 | 0.18 | 0.28 | 0.18 | 0.31 |
| Excelling academically reflects positively on my racial/ethnic group (0–10) | 0.13 | 0.36 | 0.18 | 0.38 | 0.13 | 0.36 |
| Doing poorly academically reflects negatively on my racial/ethnic group (0–10) | 0.24 | 0.49 | 0.21 | 0.52 | 0.10 | 0.49 |
| I don’t want to look foolish or stupid in class (0–10) | 0.27 | 0.52 | 0.24 | 0.52 | 0.21 | 0.56 |
| If I don’t do well, people will look down on others like me (0–10) | 0.40 | 1.00 | 0.20 | 0.98 | 0.38 | 0.98 |
|
| ||||||
| Academic Effort (EFF) (α=.592) | ||||||
| Average Number of Hours Studied in a 7 day Week/10 (0–12) | 0.35 | 0.10 | 0.45 | 0.45 | 0.28 | 0.43 |
| Importance of learning course material (0–10) | 0.32 | 0.12 | 0.31 | 0.40 | 0.27 | 0.44 |
| Self-reported [academic] effort during past year of college (0–10) | 0.21 | 0.55 | 0.13 | 0.74 | 0.21 | 0.79 |
| Average Number of Hours of Recreational Activities during a 7 day Week/10 (0–10)1 | 0.10 | 0.54 | 0.17 | 0.33 | 0.21 | 0.43 |
|
| ||||||
| Academic Performance (GPA) | ||||||
| Average Second and Third Semester GPA | 1.00 | 1.00 | 1.00 | 1.00 | 1.00 | 1.00 |
|
| ||||||
| N (=1865) | 250 | 607 | 1008 | |||
Note: Reporting standardized factor loadings. All factor loadings are significant at p<.001.
Appendix D
Regression Coefficients for Effects of Controls on Structural Equation Model of Relationships Between Externalization, Internalization, Academic Performance Burden, Effort, and Academic Performance
| Immigrant Generation |
Externalization | Internalization | Academic Perf. Burden |
Effort | Performance | |||||||
|---|---|---|---|---|---|---|---|---|---|---|---|---|
|
|
||||||||||||
| Variables1 | Mean | S.E. | Mean | S.E. | Mean | S.E. | Mean | S.E. | Mean | S.E. | ||
| Male | 1 | 0.12 | (0.19) | 0.29** | (0.11) | 0.04 | (0.13) | −0.38* | (0.18) | −0.13 | (0.14) | |
| 2 | 0.05 | (0.10) | 0.04 | (0.09) | 0.03 | (0.08) | 0.09 | (0.10) | −0.05 | (0.08) | ||
| 3 | −0.17*** | (0.04) | 0.12* | (0.05) | 0.10 | (0.04) | −0.17** | (0.05) | −0.06 | (0.04) | ||
| Multiracial | 1 | −0.18 | (0.14) | −0.20 | (0.12) | −0.04 | (0.13) | −0.13 | (0.20) | 0.58 | (1.01) | |
| 2 | −0.07 | (0.09) | 0.07 | (0.09) | 0.00 | (0.07) | −0.08 | (0.08) | 0.02 | (0.08) | ||
| 3 | −0.03 | (0.05) | 0.03 | (0.05) | −0.08 | (0.04) | −0.09 | (0.06) | 0.05 | (0.04) | ||
| # of Dependents | 1 | 0.29 | (0.16) | 0.07 | (0.11) | −0.14 | (0.13) | 0.20 | (0.17) | −0.13 | (0.13) | |
| 2 | 0.08 | (0.10) | −0.21* | (0.10) | 0.05 | (0.08) | 0.08 | (0.10) | −0.10 | (0.08) | ||
| 3 | −0.03 | (0.05) | 0.01 | (0.05) | −0.01 | (0.04) | 0.05** | (0.05) | −0.01 | (0.04) | ||
| Intact Family | 1 | −0.10 | (0.15) | 0.10 | (0.12) | 0.03 | (0.13) | 0.28 | (0.18) | 0.16 | (0.13) | |
| 2 | 0.12 | (0.10) | 0.04 | (0.10) | 0.10 | (0.09) | 0.02 | (0.10) | 0.14 | (0.08) | ||
| 3 | −0.01 | (0.05) | 0.08 | (0.05) | 0.06 | (0.05) | 0.15 | (0.06) | 0.01 | (0.04) | ||
|
| ||||||||||||
| 1 parent B.A. (Ref=No parents B.A.) |
1 | −0.27 | (0.17) | −0.08 | (0.12) | 0.01 | (0.15) | 0.16 | (0.18) | 0.03 | (0.14) | |
| 2 | −0.07 | (0.11) | 0.04 | (0.11) | 0.17 | (0.10) | 0.18 | (0.11) | −0.08 | (0.09) | ||
| 3 | −0.06 | (0.05) | 0.00 | (0.06) | −0.03 | (0.05) | 0.02 | (0.06) | −0.02 | (0.04) | ||
| 2 parents B.A. | 1 | −0.14 | (0.16) | −0.05 | (0.12) | −0.01 | (0.14) | 0.22 | (0.19) | −0.24 | (0.14) | |
| 2 | −0.39*** | (0.11) | −0.11 | (0.11) | 0.05 | (0.09) | 0.09 | (0.11) | 0.14 | (0.08) | ||
| 3 | 0.02 | (0.05) | −0.04 | (0.06) | −0.04 | (0.05) | −0.04 | (0.06) | 0.07 | (0.04) | ||
| 1 parent Advanced Degree |
1 | −0.11 | (0.18) | −0.31* | (0.14) | −0.04 | (0.15) | 0.22 | (0.21) | 0.19 | (0.15) | |
| 2 | 0.08 | (0.12) | 0.01 | (0.12) | 0.16 | (0.10) | 0.00 | (0.12) | −0.06 | (0.09) | ||
| 3 | 0.06 | (0.05) | 0.04 | (0.06) | −0.03 | (0.05) | −0.16** | (0.06) | 0.06 | (0.04) | ||
| 2 parents Advanced Degree | 1 | −0.28 | (0.20) | −0.13 | (0.12) | 0.20 | (0.15) | 0.17 | (0.20) | −0.05 | (0.14) | |
| 2 | −0.01 | (0.12) | −0.01 | (0.12) | 0.15 | (0.10) | −0.07 | (0.12) | 0.02 | (0.09) | ||
| 3 | 0.03 | (0.06) | 0.01 | (0.06) | −0.01 | (0.05) | −0.04 | (0.06) | 0.07 | (0.04) | ||
| % of college paid by family (%/10) |
1 | 0.02 | (0.17) | −0.07 | (0.13) | 0.31* | (0.14) | −0.37 | (0.19) | 0.09 | (0.16) | |
| 2 | 0.13 | (0.10) | 0.05 | (0.10) | 0.05 | (0.09) | −0.14 | (0.11) | 0.13 | (0.08) | ||
| 3 | −0.04 | (0.05) | 0.02 | (0.06) | 0.05 | (0.05) | 0.02 | (0.06) | 0.03 | (0.04) | ||
|
| ||||||||||||
| # AP Courses | 1 | 0.14 | (0.17) | 0.16 | (0.12) | −0.03 | (0.14) | 0.04 | (0.19) | 0.17 | (0.13) | |
| 2 | 0.05 | (0.11) | 0.15 | (0.11) | −0.03 | (0.09) | −0.05 | (0.11) | 0.04 | (0.08) | ||
| 3 | −0.01 | (0.05) | 0.06 | (0.05) | 0.03 | (0.05) | −0.01 | (0.06) | 0.17*** | (0.04) | ||
| Self-rated preparation (0–10) |
1 | 0.16 | (0.19) | 0.07 | (0.13) | 0.19 | (0.16) | −0.35 | (0.23) | 0.18 | (0.16) | |
| 2 | 0.07 | (0.12) | −0.17 | (0.10) | −0.15 | (0.09) | −0.18 | (0.10) | 0.17 | (0.08) | ||
| 3 | 0.03 | (0.05) | 0.01 | (0.05) | −0.07 | (0.04) | −0.07 | (0.05) | 0.01 | (0.04) | ||
| Hours Work for Pay (/10) |
1 | −0.13 | (0.16) | 0.03 | (0.11) | 0.03 | (0.13) | 0.05 | (0.17) | −0.14 | (0.12) | |
| 2 | 0.11 | (0.10) | −0.08 | (0.10) | −0.09 | (0.08) | 0.02 | (0.10) | −0.07 | (0.08) | ||
| 3 | −0.03 | (0.05) | −0.01 | (0.05) | 0.04 | (0.04) | −0.02 | (0.05) | 0.10 | (0.04) | ||
| High School GPA (0−4) |
1 | −0.22 | (0.15) | −0.01 | (0.12) | −0.10 | (0.13) | −0.03 | (0.18) | 0.24 | (0.13) | |
| 2 | 0.01 | (0.10) | −0.03 | (0.10) | 0.15 | (0.09) | 0.41*** | (0.10) | 0.11 | (0.09) | ||
| 3 | 0.01 | (0.03) | 0.03 | (0.03) | −0.14*** | (0.03) | 0.20*** | (0.06) | 0.19*** | (0.04) | ||
Significant at .05,
Significant at .01,
Significant at .001.
One-tailed test.
NOTE: Reporting Standardized coefficients. Model includes university-level fixed effects. Effects of regression paths between constructs in full SEM shown in Table 4.
See Table 2 for fuller description of control variables.
Footnotes
Henceforth we use the term “minority” in lieu of “black and Hispanic”.
Whereas black immigrants comprise 27 percent of all black students entering the 28 selective and highly-selective universities in our sample in 1999, the Current Population Survey (CPS) from the same year (March 1999) showed that only 13 percent of 18–19 year old African-Americans in the United States were first or second generation black immigrants (Massey et al. 2007). Similarly, Hispanic immigrants comprise 73 percent of all Hispanic students entering the 28 universities in our sample in 1999, but only 66 percent of all 18–19 year old Hispanics in the United States.
Across both situational (experimental) and dispositional (observational) assessments of stereotype threat, the strength and impact of the identity threat on grade performance across multiple exposures to negative stereotypes depends on the features of the setting, the severity of threat experienced, and the individual sensitivities of a given student (Fiske 1998). Therefore—as discussed later—support for the observational model we present here does not rule out the possibility that immigrants—even first generation immigrants—experience stereotype threat in situation-specific contexts.
As a conceptual check, however, the full model was estimated for whites and Asians. All paths except that between effort and performance were non-significant at the .05 level (results available upon request).
Throughout this paper, we refer foreign-born college students as first generation because of their direct experiences of international migration. Because members of the 1.5 generation (those who arrived prior to age 8) are collapsed with recent arrivals, our findings on the uniqueness of the first generation are particularly conservative. Second generation students were born in the U.S. but have at least one foreign-born parent. We refer to both together as immigrants because they have close familial ties to the social, cultural, linguistic, and financial impacts of acculturating to a new society. In contrast, domestic underrepresented minorities are those whose parents and grandparents are each American-born.
First, to test the robustness of relationships between the structural paths shown in Figure 2 to slight changes in the selection of latent construct indicators, the SEM was re-run 16 times, each time excluding one of the 16 indicators from the full model. Results indicated no substantive changes in the magnitudes or significances of the regression paths between constructs. Second, as an alternate to SEM, the full model was also analyzed using path analysis, with summed indexes modeled with a single factor loading for each latent construct. Though not allowing for differential inter-item weighting of indicators nor controlling for measurement error, results were similar to those of the SEM presented in Table 4.
In order to assess the reliability of each latent construct, we examined the r-square values for constituent items (shown in Appendix C). We conclude that the r-square values of each item are sufficiently large to suggest that each indicator contributes substantially to the overall joint variation of the latent construct (and only limited unique variance) (Bollen 1989). To assess construct validity, we report factor loadings for each item in a latent construct (see Appendix C). To assess predictive validity, we examine whether the internalization and externalization mechanisms are significant predictors of their corresponding constructs based on the conceptual model for domestic minority students—those shown to be susceptible to these mechanisms of identity threat in prior research. We find high predictive validity.
References
- Bankston Carl L. Social Capital, Cultural Values, Immigration, and Academic Achievement: The Host Country Context and Contradictory Consequences. Sociology of Education. 2004;77(2):176–79. [Google Scholar]
- Barrera Mario. Race and Class in the Southwest: A Theory of Racial Inequality. Notre Dame, IN: Notre Dame University Press; 1980. [Google Scholar]
- Bean Frank, Stevens Gillian. America’s Newcomers: Immigrant Incorporation and the Dynamics of Diversity. New York, NY: Russell Sage Foundation; 2003. [Google Scholar]
- Bennett Pamela R, Lutz Amy. How African American is the net black advantage? Differences in College Attendance among Immigrant Blacks, Native Blacks, and Whites. Sociology of Education. 2009;82(1):70–99. [Google Scholar]
- Bollen Kenneth A. Structural Equations with Latent Variables. New York, NY: Wiley Press; 1989. [Google Scholar]
- Bourdieu Pierre. The Logic of Practice. Palo Alto, CA: Stanford University Press; 1990. [Google Scholar]
- Brewer Marilynn B. The Social Psychology of Intergroup Relations: Social Categorization, In-Group Bias, and Out-Group Prejudice. In: Kruglanski A, Higgins ET, editors. Social Psychology: Handbook of Basic Principles. New York, NY: Guilford Press; 2007. pp. 695–715. [Google Scholar]
- Brunsma David L. Interracial Families and the Racial Identification of Mixed-Race Children: Evidence from the Early Childhood Longitudinal Study. Social Forces. 2005;84(2):1131–1157. [Google Scholar]
- Charles Camille Z. The Dynamics of Residential Segregation. Annual Review of Sociology. 2003;29:167–207. [Google Scholar]
- Charles Camille Z, Fischer Mary J, Mooney Margarita, Massey Douglas S. Taming the River: Negotiating the Academic, Financial, and Social Currents in Selective Colleges and Universities. Princeton, NJ: Princeton University Press; 2009. [Google Scholar]
- Charles Camille Z, Torres Kimberly C, Brunn Rachelle J. Black like Who? Exploring the Racial, Ethnic and Class Diversity of Black Students at Selective Colleges and Universities. In: Gallagher Charles A., editor. Racism in Post-Race America: New Theories, New Directions. New York, NY: Social Forces Publishing; 2008. pp. 247–265. [Google Scholar]
- Coleman James S. Social Capital in the Creation of Human Capital. The American Journal of Sociology. 1988;94:95–120. [Google Scholar]
- Conzen KN, Gerber DA, Morawska E, Pozzetta GE, Vecoli RJ. The Invention of Ethnicity: A Perspective from the U.S.A. Journal of American Ethnic History. 1992;1(1):3–41. [Google Scholar]
- Cornell Stephen, Hartmann Douglas. Ethnicity and Race: Making Identities in a Changing World. London, United Kingdom: Pine Forge Press; 2007. [Google Scholar]
- Crocker Jennifer, Lutskey N. Stigma and the Dynamics of Social Cognition. In: Ainlay SC, Becker G, Coleman LM, editors. The Dilemma of Difference. New York, NY: Plenium Press; 1986. [Google Scholar]
- Crocker Jennifer, Major Brenda, Steele Claude M. Social Stigma. In: Gilbert Daniel T, Fiske Susan T, Gardner Lindzey., editors. Handbook of Social Psychology. 4. Vol. 2. Boston, MA: McGraw Hill; 1998. pp. 504–553. [Google Scholar]
- Deaux Kay. Social Identification. In: Tory Higgins E, Kruglanski Arie W, editors. Social Psychology: Handbook of Basic Principles. New York, NY: Guildford Press; 1996. pp. 777–798. [Google Scholar]
- Deaux Kay. To Be an Immigrant. New York, NY: Russell Sage Foundation; 2006. [Google Scholar]
- Downey Douglas B. Black/White Differences in School Performance: The Oppositional Culture Explanation. Annual Review of Sociology. 2008;34(1):107–26. [Google Scholar]
- Downey Douglas B, Ainsworth James W, Qian Zhenchao. Rethinking the Attitude-Achievement Paradox among Blacks. Sociology of Education. 2009;82(1):1–19. [Google Scholar]
- Fernandez-Kelly M Patricia. Social and Cultural Capital in the Urban Ghetto: Implications for the Economic Sociology of Immigration. In: Portes Alejandro., editor. The Economic Sociology of Immigration: Essays in Network, Ethnicity, and Entrepreneurship. New York, NY: Russell Sage Foundation; 1995. pp. 213–247. [Google Scholar]
- Fernandez-Kelly M Patricia, Schauffler Richard. Divided Fates: Immigrant Children in a Restructured Economy. International Migration Review. 1994;28:662–89. [Google Scholar]
- Fischer Mary J, Massey Douglas S. The Effects of Affirmative Action in Higher Education. Social Science Research. 2007;36(2):531–49. [Google Scholar]
- Fiske Susan T, Gilbert DT, Fiske ST. The Handbook of Social Psychology. 4. Vol. 2. Boston, MA: McGraw Hill; 1998. Stereotyping, Prejudice, and Discrimination; pp. 504–553. [Google Scholar]
- Gans Herbert J. Second-Generation Decline: Scenarios for the Economic and Ethnic Futures of the Post-1965 American Immigrants. Ethnic and Racial Studies. 1992;15(2):173–92. [Google Scholar]
- Grasmuck Sherri, Pessar Patricia. Between Two Islands: Dominican International Migration. Berkeley, CA: University of California Press; 1991. [Google Scholar]
- Grasmuck Sherri. Immigration, Ethnic Stratification, and Native Working Class Discipline: Comparison of Documented and Undocumented Dominicans. International Migration Review. 1984;18:692–713. [Google Scholar]
- Hagy Alison P, Farley Ordovensky Staniec J. Immigrant Status, Race, and Institutional Choice in Higher Education. Economics of Education Review. 2002;21(1):381–92. [Google Scholar]
- Harris David R, Sim Jeremiah J. Who is Multiracial? Assessing the Complexity of Lived Race. American Sociological Review. 2002;67(4):614–627. [Google Scholar]
- Iceland John, Weinberg Daniel H, Steinmetz Erika. Racial and Ethnic Residential Segregation in the United States: 1980–2000. U.S. Government Printing Office, U.S. Census Bureau; Washington, DC: 2002. Series CENSR-3. [Google Scholar]
- Jencks Christopher, Phillips Meredith. The Black-White Test Score Gap. Washington, D.C: Brookings Institution Press; 1998. [Google Scholar]
- Kao Grace. Social capital and its relevance to minority and immigrant populations. Sociology of Education. 2004;77(2):172–175. [Google Scholar]
- Kao Grace, Rutherford Lindsay Taggart. Does Social Capital Still Matter? Immigrant Minority Disadvantage in School-Specific Social Capital and its Effects on Academic Achievement. Sociological Perspectives. 2007;50(1):27–54. [Google Scholar]
- Kao Grace, Thompson Jennifer S. Racial and Ethnic Stratification in Educational Achievement and Attainment. Annual Review of Sociology. 2003;29:417–442. [Google Scholar]
- Kao Grace, Tienda Marta. Optimism and Achievement: The Educational Performance of Immigrant Youth. Social Science Quarterly. 1995;76(1):1–19. [Google Scholar]
- Kao Grace, Tienda Marta. Educational Aspirations of Minority Youth. American Journal of Education. 1998;106(3):349–384. [Google Scholar]
- Kasinitz Philip. Becoming American, Becoming Minority, Getting Ahead: The Role of Racial and Ethnic Status in the Upward Mobility of the Children of Immigrants. The Annals of the American Academy of Political and Social Science. 2008;620(1):253–69. [Google Scholar]
- Kasinitz Philip, Mollenkopf John H, Waters Mary C, Holdaway Jennifer. Inheriting the City: The Children of Immigrants Come of Age. New York, NY: Russell Sage Foundation Press; 2008. [Google Scholar]
- Massey Douglas S, Charles Camille Z, Lundy Garvey F, Fischer Mary J. The Source of the River: the Social Origins of Freshmen at America’s Selective Colleges and Universities. Princeton, NJ: Princeton University Press; 2003. [Google Scholar]
- Massey Douglas S, Fischer Mary J. Stereotype Threat and Academic Performance: New Findings from a Racially Diverse Sample of College Freshmen. Du Bois Review. 2005;2(1):45–68. [Google Scholar]
- Massey Douglas S, Mooney Margarita A, Charles Camille Z, Torres Kimberly C. Black Immigrants and Black Natives Attending Selective Colleges and Universities in the United States. American Journal of Education. 2007;113(2):243–71. [Google Scholar]
- Menjívar Cecilia. Fragmented Ties: Salvadoran Immigrant Networks in America. Berkeley, CA: University of California Press; 2000. [Google Scholar]
- Merton Robert K. Social Theory and Social Structure. New York, NY: Free Press; 1968. [Google Scholar]
- Morgan Stephan L, Mehta Jal D. Beyond the Laboratory: Evaluating the Survey Evidence for the Disidentification Explanation of Black-White Differences in Achievement. Sociology of Education. 2004;77(1):82–101. [Google Scholar]
- Omi Michael, Winant Howard. Racial Formation in the United States: From the 1960s to the 1990s. New York, NY: Routledge; 1994. [Google Scholar]
- Owens Jayanti, Massey Douglas S. Stereotype Threat and College Academic Performance: A Latent Variables Approach. Social Science Research. 2010;40:150–166. doi: 10.1016/j.ssresearch.2010.09.010. [DOI] [PMC free article] [PubMed] [Google Scholar]
- Oyserman Daphna. Racial-ethnic Self-schemas: Multidimensional Identity-based Motivation. Journal of Research in Personality. 2008;42:1186–1198. doi: 10.1016/j.jrp.2008.03.003. [DOI] [PMC free article] [PubMed] [Google Scholar]
- Oyserman Daphna, Bybee Deborah, Terry Kathy. Gendered Racial Identity and Involvement with School. Self & Identity. 2003;2(4):307–324. [Google Scholar]
- Oyserman Daphna, Swim Janet K. Stigma: An Insider’s View. Journal of Social Issues. 2001;57(1):1–14. [Google Scholar]
- Portes Alejandro, Rumbaut Rubén G. Immigrant America: A Portrait. 3. Berkeley, CA: University of California Press; 2006. [Google Scholar]
- Portes Alejandro, Rumbaut Rubén G. Legacies: The Story of the Immigrant Second Generation. Berkeley, CA: University of California Press; 2001. [Google Scholar]
- Portes Alejandro, Zhou Min. The New Second Generation: Segmented Assimilation and its Variants. Annals of the American Academy of Political and Social Science. 1993;530:74–96. [Google Scholar]
- Rong Xue Lan, Brown Frank. The Effects of Immigrant Generation and Ethnicity on Educational Attainment among Young African and Caribbean Blacks in the United States. Harvard Educational Review. 2001;71(3):536–568. [Google Scholar]
- Sanders Jimy M. Ethnic Boundaries and Identity in Plural Societies. Annual Review of Sociology. 2002;28:327–357. [Google Scholar]
- Steele Claude M. A Threat in the Air: How Stereotypes Shape Intellectual Identity and Performance. In: Eberhardt Jennifer L, Fiske Susan T., editors. Confronting racism: The problem and the response. Thousand Oaks, CA: Sage Publications; 1998. pp. 202–233. [Google Scholar]
- Steele Claude M. Race and the Schooling of Black Americans. Atlantic Monthly. 1992 Retrieved December 15, 2009 ( http://www.theatlantic.com/magazine/archive/1992/04/race-and-the-schooling-of-black-americans/6073/)
- Steele Claude M. The Psychology of Self-Affirmation: Sustaining the Integrity of the Self. In: Berkowitz L, editor. Advances in experimental social psychology. Vol. 21. San Diego, CA: Academic Press; 1988. pp. 261–302. [Google Scholar]
- Steele Claude M, Aronson Joshua. Stereotype Threat and the Intellectual Test Performance of African Americans. Journal of Personality and Social Psychology. 1995;69(5):797–811. doi: 10.1037//0022-3514.69.5.797. [DOI] [PubMed] [Google Scholar]
- Suarez-Orozco Marcelo M, Suarez-Orozco Carola. Children of Immigration. Cambridge, MA: Harvard University Press; 2001. [Google Scholar]
- Tafoya Sonya. Shades of belonging. Washington, D.C: Pew Hispanic Center; 2004. Retrieved December 20, 2009 ( http://pewhispanic.org/files/reports/35.pdf) [Google Scholar]
- Tajfel Henri. Human Groups and Social Categories. London, U.K: Cambridge University Press; 1981. [Google Scholar]
- Tajfel Henri, Turner John C. The Social Identity Theory of Intergroup Behavior. In: Austin W, Worchel S, editors. Psychology of Intergroup Relations. 2. Chicago, IL: Nelson-Hall Press; 1986. pp. 7–24. [Google Scholar]
- Telles Edward E, Ortiz Vilma. Generations of Exclusion: Mexican Americans, Assimilation, and Race. New York, NY: Russell Sage Foundation; 2008. [Google Scholar]
- Turney Kristin, Kao Grace. Barriers to School Involvement: Are Immigrant Parents Disadvantaged? Journal of Educational Research. 2009;102(4):257–71. [Google Scholar]
- Waldinger Roger, Feliciano Cynthia. Will the New Second Generation Experience “Downward Assimilation”? Ethnic and Racial Studies. 2004;27(3):376–402. [Google Scholar]
- Waters Mary C. Black Identities: West Indian Immigrant Dreams and American Realities. New York: Russell Sage Foundation; 1999. [Google Scholar]
- Waters Mary C. Ethnic and Racial Identities of Second Generation Black Immigrants in New York City. In: Portes Alejandro., editor. The New Second Generation. New York: Russell Sage; 1996. [Google Scholar]
- Woolley Michael E, Grogan-Kaylor Andrew, Gilster Megan E, Karb Rebecca A, Gant Larry M, Reischl Thomas M, Alaimo Katherine. Neighborhood Social Capital, Poor Physical Conditions, and School Achievement. Children & Schools. 2008;30(3):133–45. [Google Scholar]
- Zhou Min. 1997a [Google Scholar]
- Zhou Min. Growing Up American: The Challenge Confronting Immigrant Children and the Children of Immigrants. Annual Review of Sociology. 1997b;23:63–95. [Google Scholar]
- Zhou Min, Bankston Carl L., III . Growing up American: How Vietnamese Children Adapt to Life in the United States. New York, NY: Russell Sage Foundation Press; 1998. [Google Scholar]
- Zhou Min, Lee Jennifer, Vallejo Jody Agius, Tafoya-Estrada Rosaura, Xiong Yang Sao. Success Attained, Deterred, and Denied: Divergent Pathways to Social Mobility in Los Angeles’s New Second Generation. The Annals of the American Academy of Political and Social Science. 2008;620(1):37–61. [Google Scholar]