

Abstract
Background
The most frequently used method for fiber tractography based on diffusion tensor imaging (DTI) is associated with restrictions in the resolution of crossing or kissing fibers and in the vicinity of tumor or edema. Tractography based on high-angular-resolution diffusion imaging (HARDI) is capable of overcoming this restriction. With compressed sensing (CS) techniques, HARDI acquisitions with a smaller number of directional measurements can be used, thus enabling the use of HARDI-based fiber tractography in clinical practice.
Objective
To investigate whether HARDI+CS-based fiber tractography improves the display of neuroanatomically complex pathways and in areas of disturbed diffusion properties.
Methods
Six patients with gliomas in the vicinity of language-related areas underwent 3-T magnetic resonance imaging including a diffusion-weighted data set with 30 gradient directions. Additionally, functional magnetic resonance imaging for cortical language sites was obtained. Fiber tractography was performed with deterministic streamline algorithms based on DTI using 3 different software platforms. Additionally, tractography based on reconstructed diffusion signals using HARDI+CS was performed.
Results
HARDI+CS-based tractography displayed more compact fiber bundles compared with the DTI-based results in all cases. In 3 cases, neuroanatomically plausible fiber bundles were displayed in the vicinity of tumor and peritumoral edema, which could not be traced on the basis of DTI. The curvature around the sylvian fissure was displayed properly in 6 cases and in only 2 cases with DTI-based tractography.
Conclusion
HARDI+CS seems to be a promising approach for fiber tractography in clinical practice for neuroanatomically complex fiber pathways and in areas of disturbed diffusion, overcoming the problem of long acquisition times.
Keywords: Compressed sensing, Diffusion tensor imaging, Fiber tractography, Glioma, High-angular-resolution diffusion imaging, Multimodality navigation
The aim to achieve best possible tumor resection with minimum postoperative morbidity, which has been shown to be associated with extended survival time1-3 in glioma surgery, is still challenging. Despite microscope enhancement, as a result of their infiltrative nature, margins of high-grade gliomas generally remain difficult to distinguish from the surrounding brain parenchyma. This is of particular relevance for lesions near eloquent cortical areas or major white matter tracts. Thus, there is rising interest in navigation guidance and intraoperative imaging methods.4,5 Conventional navigation guidance has become a routinely used tool during glioma surgery. However, with the so-called multimodality navigation, besides anatomic image data, functional information like eloquent cortical areas, metabolic activity, or fiber tracts can also be integrated.
Fiber tractography as a noninvasive method to estimate the course and location of white matter tracts integrated in the navigation system has been shown to contribute to minimizing postoperative morbidity.6,7 For reasons of practicability and feasibility, until today, fiber tractography in clinical practice was based mostly on diffusion tensor imaging (DTI). DTI, as first described by Basser et al,8 is based on a set of diffusion-weighted magnetic resonance images (MRIs). To obtain the diffusion properties within 1 voxel, a second-order tensor, describing the local diffusion characteristic within, is calculated with the Stejskal-Tanner equation. In anisotropic tensors, the main eigenvector encodes the longitudinal direction of axons in major white matter tracts.
So far, there are several different algorithms for fiber reconstruction,9-12 which can generally be separated into deterministic and probabilistic methods. However, because of the restricted second-order tensor in each voxel, assuming gaussian-distributed diffusion, multifiber populations cannot be resolved adequately, resulting in the disability to reconstruct crossing or kissing fibers. Similarly, fanning fibers and fibers in the vicinity of tumor or edema13,14 can hardly be reconstructed with this assumption.15 In clinical practice, this becomes relevant for the reconstruction of neuroanatomically complex fiber structures like the language-associated tracts curving around the sylvian fissure. Even for healthy subjects, their reconstruction is challenging with the most commonly used deterministic tracking algorithms based on DTI; however, it becomes even more complex for patients with intracerebral pathology such as gliomas and their associated peritumoral edema, both affecting diffusion properties.
To overcome this drawback, particularly because about one-third of voxels in the brain contain > 1 fiber population,16 research focuses on alternative diffusion models such as those based on high-angular-resolution diffusion imaging (HARDI). Advanced diffusion models based on HARDI data sets are capable of overcoming the second-order tensor restriction.17-20
To represent a 3-dimensional (3-D) distribution of diffusivities as measured by HARDI, spherical harmonics are frequently used. However, because they do not provide a sparse representation of HARDI signals, clinical use is limited owing to a larger number of diffusion-encoding gradients (ranging from 60 to 100), resulting in long acquisition times. With spherical ridgelets used as a representation basis, HARDI signals can be represented using a relatively small number of diffusion-encoding gradients,21-24 thus enhancing the feasibility of HARDI-based fiber tractography in clinical practice.
To the best of our knowledge, there is no description of the application of HARDI with compressed sensing (CS) and accordingly tractography in clinical practice. This article compares DTI-based fiber tractography, performed on 3 different software platforms (iPlan25 Cranial, Slicer4,26-28 and MedAlyVis29), with HARDI+CS-based fiber tractography. Furthermore, DTI- and HARDI+CS-based fiber reconstruction performed on the same platform (MedAlyVis) was displayed and analyzed side by side.
Materials and Methods
Patients
Patient collection was performed prospectively at the University Hospital Marburg (Marburg, Germany) from May 2011 to March 2012 after approval was given by the local ethics committee. All patients gave their written informed consent to participate in the study.
Six patients with left-sided gliomas were included in our study. Mean patient age was 54.3 ± 14.9 years. Two female patients and 4 male patients were included.
All patients were right handed with left dominant hemisphere according to functional MRI (fMRI). For all patients, the Aachen Aphasia Bedside Test (AABT)30 was obtained preoperatively and 2 months after surgery. The following items were evaluated:
Request for visual and head movement (minimum, 0 points; maximum, 50 points)
Request for mouth movement (minimum, 0 points; maximum, 50 points)
Singing and speaking rows and empty phrases (minimum, 0 points; maximum, 50 points)
Identifying objects (minimum, 0 points; maximum, 50 points)
Naming objects (minimum, 0 points; maximum, 50 points)
The tumor localization is given in Table 1 and illustrated in Figure 1, in which all tumors are displayed in a physiological brain model. A detailed description of the patients' medical history, including AABT, tumor biology, and clinical course is given in the case presentation and Tables 1 and 2.
Table 1. Patient Collectivea.
| Patient | Age, y | Sex | Lesion | Localization | Tumor Volume, cm3 |
|---|---|---|---|---|---|
| 1 | 73 | M | Anaplastic oligodendroglioma WHO III | Temporal | 35.2 |
| 2 | 65 | F | Glioblastoma multiforme WHO IV | Temporal | 10.7 |
| 3 | 41 | M | Anaplastic astrocytoma WHO III | Temporal | 15.7 |
| 4 | 52 | M | Glioblastoma multiforme WHO IV | Temporo-occipital | 30.2 |
| 5 | 34 | M | Diffuse astrocytoma WHO II | Frontal | 76.0 |
| 6 | 61 | F | Anaplastic astrocytoma WHO III | Temporal | 41.8 |
WHO, World Health Organization.
Figure 1.
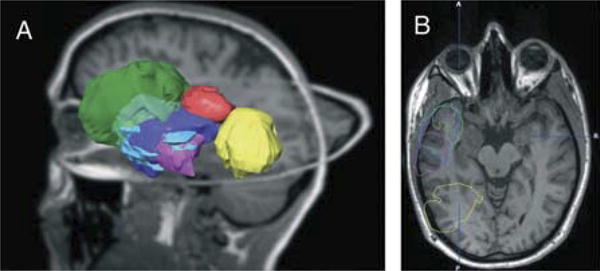
Schematic of tumor localization with segmented tumor objects projected on a T1-weighted magnetic resonance imaging data set of a healthy volunteer. A, 3-dimensional overview. B, axial view. Patient 1, blue; patient 2, red; patient 3, pink; patient 4, yellow; patient 5, green; and patient 6, purple.
Table 2. Aachen Aphasia Bedside Test Results of the Patient Collectivea.
| Patient | Preoperative AABT Score | Postoperative AABT Score |
|---|---|---|
| 1 | 50-50-50-50-50 | 50-50-50-50-50 |
| 2 | 49-48-50-47-40 | 49-48-50-50-45 |
| 3 | 50-50-50-50-48 | 50-50-50-50-48 |
| 4 | 50-50-42-50-45 | 50-50-48-50-48 |
| 5 | 50-50-50-50-50 | 50-50-50-50-50 |
| 6 | 50-50-50-50-50 | 50-50-50-50-50 |
AABT, Aachen Aphasia Bedside Test. First score, request for visual and head movement; second score, request for mouth movement; third score, singing and speaking rows and empty phrases; fourth score, identifying objects; and fifth score, naming objects.
MRI Studies
For all patients, MRIs were acquired at on a 3-T MRI (Tim Trio; Siemens, Erlangen, Germany) on the preoperative day, including T1-weighted 3-D images (3-D magnetization-prepared rapid gradient echo; repetition time, 1900 milliseconds; echo time, 2.26 milliseconds; field of view, 256 mm; matrix, 256 × 256; slice thickness, 1 mm; 176 slices, sagittal), blood oxygen level-dependent fMRI using a single-shot echo-planar imaging sequence (repetition time, 2000 milliseconds; echo time, 30 milliseconds; field of view, 230 mm; matrix, 64 × 64; slice thickness, 3.6 mm; 33 slices, axial) for localization of cortical language areas using a word generation task, and diffusion-weighted images also using a single-shot echo-planar imaging sequence (repetition time, 7800 milliseconds; echo time, 90 milliseconds; field of view, 256 mm; matrix, 128 × 128; slice thickness, 2 mm; numbers of excitations, 1; b = 1000 s/mm2; 30 noncollinear diffusion-encoding gradients; voxel size, 2 × 2 × 2 mm3). This same diffusion-weighted image set was the base for both DTI-based fiber tractography and HARDI+CS-based fiber tractography. Acquisition of all data sets took 15 minutes per patient.
fMRI Analysis
The applied word generation task, as described by Jansen et al,31 consisted of a block design task with displayed alternating letters and nonletters, 20 seconds each. Patients are asked to think of words starting with the displayed letter (activation) and to stop thinking of words when a nonletter is displayed (baseline).
fMRI analysis was performed within the iPlan Cranial planning software preoperatively for each patient, delivering adequate activation results for all patients. Segmented areas were then expanded with a 3-mm margin and manually transcribed into Slicer4 and MedAlyVis.
Fiber Tractography
Evaluation was performed with 3 different platforms: the iPlan Cranial planning software (Brainlab, Feldkirchen, Germany),25 Slicer4 (www.slicer.org 26-28) for DTI-based fiber tractography, and the imaging platform MedAlyVis (Medical Analysis and Visualization)29 for DTI-based and advanced tractography using HARDI signals derived from sparsely sampled diffusion data.
DTI-Based Fiber Tractography in iPlan Cranial, Slicer4, and MedAlyVis
Fiber tractography using the tensor deflection approach was performed routinely in iPlan Cranial planning software, with the defined activation area used as seed, with fractional anisotropy (FA) thresholds ranging between 0.16 and 0.20, depending on the proximity of the fiber to tumor and peritumoral edema. The fiber-tracking results were then reduced by application of exclude regions.
In Slicer4, the tractography algorithm described by Basser et al9 is routinely used for basic fiber tractography. Similar to the procedure within iPlan Cranial planning software, fiber tracking was applied using the same FA thresholds for each patient.
Within MedAlyVis, fiber tractography was also performed using a tensor deflection approach with the same range of FA thresholds for each patient.
Multidirectional Deterministic Fiber Tractography Based on HARDI+CS
Tractography algorithms based on reconstructed diffusion signals using HARDI+CS23 can be applied to reconstruct complex fibers within a single voxel, modeled as a probability distribution on a sphere, assigning the probability of diffusion for each direction. Using a higher number of gradients, HARDI requires longer acquisition times and thus is not yet suitable for clinical use. As proposed by Michailovich and Rathi24,32 and Michailovich et al,33 spherical ridgelets can be used to interpolate the diffusion signal, allowing a sparse representation of the signal.
Within the MedAlyVis platform, spherical ridgelets are calculated from the given diffusion data set.24,32,33 For fiber reconstruction, a deterministic multidirectional orientation distribution function tracking is used, proposed by Descoteaux et al,15 with the L index34 as the anisotropy measure, ranging from 0.05 to 0.07.
Results: Case Series
The results of fiber tractography based on DTI performed on the 3 different platforms and of fiber tractography relying on HARDI+CS are described for each patient separately. Evaluation of tractography results was performed on the basis of neuroanatomical knowledge. Hereafter, DTI- and HARDI+CS-based fiber tractography results are compared side by side, and the workflow on the different software platforms is described.
Patient 1
A73-year-old male patient presented after an episode of slight, completely recurrent motor aphasia and cognitive impairment. MRI showed a left temporal to temporodorsal intra-axial lesion with weak contrast enhancement infiltrating the superior temporal gyrus and directly neighboring the angular gyrus. The contrast-enhancing areas of the lesion, which histologically was an anaplastic oligodendroglioma (World Health Organization [WHO] III), were gross-totally resected, and the postoperative course was uneventful. The AABT was normal preoperatively and 2 months after surgery (50-50-50-50-50).
DTI-based tractography in iPlan Cranial resulted in a slender arc reaching from BA 44, 45, terminating in the angular and supra-marginal gyrus. Despite gradual reduction of the FA threshold to 0.16, temporal fibers could not be displayed. DTI-based fiber tracking on Slicer4 platform resulted in a slender tract but this time terminating in the temporal lobe (inferior temporal gyrus). In contrast, DTI-based tracking on the MedAlyVis platform suggested frontal fibers terminating in BA 22 with few branches, which was supported by HARDI+CS-based tracking results, displaying a more solid bundle interconnecting BA 44, 45 and terminating in BA 22. The tractography results are displayed in Figure 2. Direct comparison of DTI- and HARDI+CS-based tractography on the MedAlyVis platform displays 2 anatomically similar fiber bundles; however, the whole bundle, particularly the arc surrounding the sylvian fissure, is traced more firmly relying on HARDI+CS (Figure 3).
Figure 2.
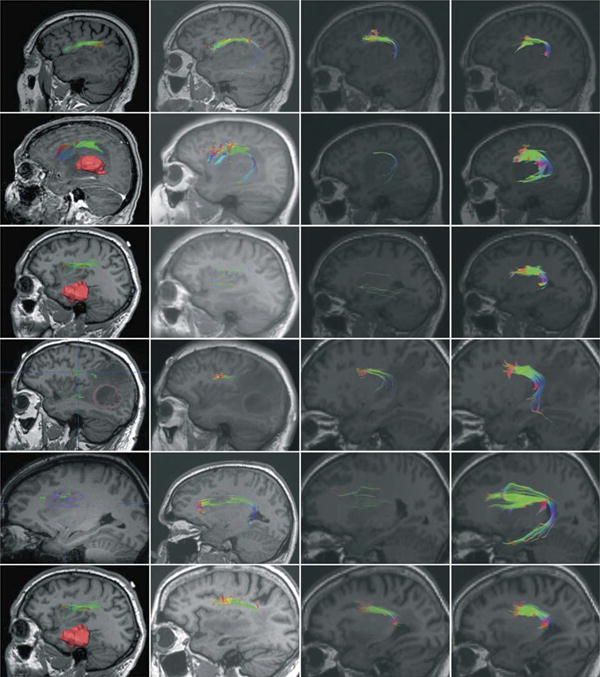
Fiber tractography results presented for each patient based on diffusion tensor imaging withiniPlan Cranial (column 1), Slicer4 (column 2), and MedAlyVis (column 3) and based onhigh-angular-resolution diffusion imaging with compressed sensing within MedAlyVis (column 4). Row 1: patient 1, a 73-year-old male patient with left temporal anaplastic oligodendroglioma. T1-weighted sagittal magnetic resonance imaging (MRI). Row 2: patient 2, a 65-year-old female patient with left temporal glioblastoma multiforme (3-dimensional [3-D] segmentation [red] in A). T1-weighted sagittal MRI (A, with contrast agent; B-D, without contrast agent). Row 3: patient 3, a 41-year-old male patient with temporal anaplastic astrocytoma (3-D segmentation [red] in A). T1-weighted sagittal MRI. Row 4: patient 4, a 52-year-old male patient with left temporo-occipital glioblastoma multiforme (2-dimensional [2-D] segmentation [red] in A). T1-weighted sagittal MRI. Row 5: patient 5, a 34-year-old male patient with left frontal diffuse astrocytoma (2-D segmentation [purple] in A). T1-weighted sagittal MRI. Row 6: patient 6, a 61-year-old female patient with temporal anaplastic astrocytoma. T1-weighted axial MRI.
Figure 3.
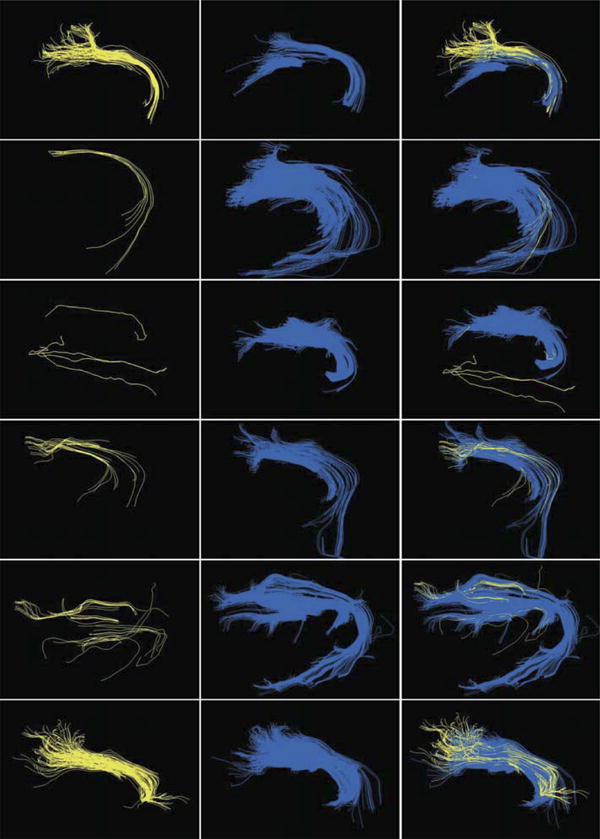
Direct comparison of fiber tractography results in MedAlyVis (rows 1-6 correspond to patient numbers). Column 1: diffusion tensor imaging (DTI)-based tractography (yellow). Column 2: high-angular-resolution diffusion imaging with compressed sensing (HARDI+CS)-based tractography (blue). Column 3: overlay of DTI-, and HARDI+CS-based fiber bundles.
Patient 2
A female 65-year-old patient presented with progressive aphasia and a marginally contrast-enhancing lesion with peritumoral edema in the left temporodorsal area, suggesting a glioblastoma multiforme. The AABT revealed aphasia preoperatively (AABT, 49-48-50-47-40) compared with an AABT of 49-48-50-50-45 postoperatively. The contrast-enhancing areas of the tumor were gross-totally resected. Histopathology secured the diagnosis of glioblastoma multiforme (WHO IV).
On iPlan Cranial and Slicer4 platforms, DTI-based tractography managed to display a frontal fiber compound from BA 44 and 45 merging to the dislocated supramarginal gyrus; the fibers were even displayed slightly within the tumor edema. Even a slight temporal fiber bundle was displayed here within the Slicer4 and MedAlyVis platforms. Still, HARDI+CS-based tractography represented a solid compound of frontotemporally arching fibers (connecting BA 44, 45 and BA 22), well displayed within the tumor and the peritumoral edema (see Figure 2). This difference of fiber complexity is also presented in Figure 3 (DTI- vs HARDI+CS-based tractography on MedAlyVis).
Patient 3
A 41-year-old patient was admitted in our clinic with cognitive impairment and mnestic deficits. The AABT furthermore revealed slight aphasia (AABT, 50-50-50-50-48), which was unchanged postoperatively (AABT, 50-50-50-50-48). These were based on an MRI morphologically nonenhancing intra-axial lesion in the left temporal lobe, which was gross-totally resected according to the T2-hyperintense signal alterations. Histopathology revealed an anaplastic astrocytoma (WHO III).
Tractography results based on DTI showed only sparse frontally located fibers on all platforms, not entirely reliable on Slicer4 and MedAlyVis platforms. No temporal fibers were displayed. With HARDI+CS-based fiber tractography on MedAlyVis, a compound frontal fiber bundle and a temporally curving part connecting to BA 22 was displayed (Figure 2). This bundle terminates in the posterior part of the superior temporal gyrus. Direct comparison of DTI- and HARDI+CS-based tractography results within the MedAlyVis platform shows the mere sole fibers of DTI-based reconstruction and the far more solid fiber bundle of HARDI+CS-based reconstruction (Figure 3).
Patient 4
A 52-year-old male patient was admitted with aphasic episodes and homonymous hemianopia caused by a left temporo-occipital lesion marginally contrast enhancing with significant perifocal edema. The AABT preoperatively was 50-50-42-50-45 but recurrent postoperatively (50-50-48-50-48). The lesion was gross-totally resected, which histologically was a glioblastoma multiforme (WHO IV).
DTI-based fiber tractography on the iPlan Cranial platform resulted in diffuse and slight fibers but with frontal and temporal extension as accepted by neuroanatomical knowledge. In the vicinity of the tumor in the posterior superior temporal gyrus, most fibers cannot be traced safely. Tracking with Slicer4 displayed merely a slender frontal fiber bundle, which terminated directly in front of the tumor edema before the supramarginal gyrus. A temporal extension cannot be displayed here. On MedAlyVis, DTI- and HARDI+CS-based fiber tracking managed to present a frontotemporal arc, interconnecting BA 44, 45 and BA 22. However, it can be clearly seen that HARDI+CS-based tractography displayed a significantly firmer and more solid fiber bundle, particularly also displaying the arc around the sylvian fissure (Figure 2, Figure 3).
Patient 5
A 34-year-old patient presented with general seizure without any further neurological deficits (preoperative and postoperative AABT, 50-50-50-50-50). A large left frontal lesion was detected on MRI, not showing contrast enhancement. He underwent subtotal tumor resection to prevent a neurological deterioration, which was secured in the postoperative neurological examination. Histologically, the lesion proved to be a diffuse astrocytoma (WHO II).
Tractography results are shown in Figure 2. DTI-based tractography on all platforms displayed a frontal fiber bundle; however, the temporal fibers were not traced safely. Furthermore, fiber results were obtained with an FA threshold > 0.16, and the region displaying the Broca area had been obtained via blood oxygen level-dependent fMRI to obtain any fibers. HARDI+CS-based tractography displayed a neuroanatomically reliable and solid fiber object, representing frontally and temporally located fibers (Figure 3). Figure 4 illustrates the reconstructed fiber object in a 3-D model compared with the intraoperative navigation screenshot, here with fiber tractography based on DTI.
Figure 4.

Case illustration of patient 5. A, 3-dimensional (3-D) reconstruction of tumor and language pathway view from lateral right. B, microscope view with outlines in heads-up display (purple, tumor; yellow, subjacent language pathways). C and D, intraoperative navigation screenshots, T2-weighted axial (C) and coronal (D) views. Tumor outlines segmented in purple; 3-D reconstruction of fiber bundle, in green.
Patient 6
A 61-year-old woman without symptomatic seizures underwent subtotal resection of a large anaplastic astrocytoma (WHO III) in the left temporal lobe with infiltration of insula and only diffuse central contrast enhancement. She did not suffer from any focal neurological deficits preoperatively and postoperatively (AABT, 50-50-50-50-50).
Fibers displayed by DTI-based tractography showed a frontal fiber bundle on the iPlan Cranial platform that terminated in the angular gyrus without expanding into the temporal lobe and was not influenced by reduced FA thresholds or expanded seed region. A slight temporal fiber expansion could be seen with DTI-based fiber tracking on the MedAlyVis and Slicer4 platforms. The termination of these fibers was in the region of BA 22 for DTI- and HARDI+CS-based reconstruction. However, the most remarkable difference here is seen in the more compound HARDI+CS-based fiber bundle reconstruction, as demonstrated in Figure 2. In addition, the direct comparison of reconstructed fiber bundles derived from both approaches within MedAlyVis displays the contrast of firmly traced fibers in Figure 3.
Figure 3 presents DTI- and HARDI+CS-based fiber tractography results on MedAlyVis for each patient in side-by-side display and overlay. It can be seen that HARDI+CS-based reconstruction results in a more compound fiber bundle in all cases. In 4 cases, DTI-based tractography resulted in sparse fibers, whereby HARDI+CS-based fiber tracking displayed a solid object (rows 2-5). However, fiber tracking relying on DTI displayed acceptable tracking results comparing DTI- and HARDI+CS-based tractography results for patients 1 and 6. In DTI-based reconstruction objects, the reconstruction frequently failed to follow the curve of the fiber around the sylvian fissure. In contrast, the curvature or at least the beginning of the curve could be displayed with HARDI+CS-based tractography. This contrast can best be seen in rows 1, 3, 4, and 5.
The procedure for DTI-based fiber tractography, including preprocessing, postprocessing, and fiber tracking, took approximately 5 to 20 minutes on all 3 platforms. There were no significant differences in time regarding image preprocessing and basic fiber reconstruction process. Postprocessing times in between the platforms varied only slightly (Table 3).
Table 3. Tractography Prepostprocessing and Postprocessing Times Comparing Diffusion Tensor Imaging and High-Angular-Resolution Diffusion Imaginga.
| Patient | iPlan Cranial DTI, min | Slicer4 DTI, min | MedAlyVis DTI, min | MedAlyVis HARDI+CS, min | ||||||||
|---|---|---|---|---|---|---|---|---|---|---|---|---|
|
|
|
|
|
|||||||||
| Pre | FT | Post | Pre | FT | Post | Pre | FT | Post | Pre | FT | Post | |
| 1 | 2 | <1 | 3 | 2 | 1-2 | 5 | 2 | 1 | 4 | 25 | 18 | 13 |
|
| ||||||||||||
| 2 | 2 | <1 | 5 | 2 | 1-2 | 4 | 2 | 1 | 5 | 25 | 19 | 12 |
|
| ||||||||||||
| 3 | 2 | <1 | 11 | 2 | 1-2 | 10 | 2 | 1 | 12 | 25 | 18 | 14 |
|
| ||||||||||||
| 4 | 2 | <1 | 15 | 2 | 1-2 | 10 | 2 | 1 | 14 | 25 | 21 | 13 |
|
| ||||||||||||
| 5 | 2 | <1 | 15 | 2 | 1-2 | 13 | 2 | 1 | 14 | 25 | 20 | 15 |
|
| ||||||||||||
| 6 | 2 | <1 | 3 | 2 | 1-2 | 6 | 2 | 1 | 5 | 25 | 18 | 14 |
DTI, diffusion tensor imaging; FT, time for fiber reconstruction process; HARDI+CS, high-angular-resolution diffusion imaging with compressed sensing; Post, postprocessing time for fiber tracking; Pre, preprocessing time for fiber tracking.
In contrast, performing all necessary steps for HARDI+CS-based tractography took about 50 minutes for each data set, including the calculation of spherical ridgelets (preprocessing) and basic fiber tractography. In addition, postprocessing work-flow was more time consuming, although the fibers were processed accordingly, restricting the objects with additional seed regions to exclude nonpertinent additional fibers (Table 3).
Discussion
Intraoperative navigation systems are widely used among neurosurgical operating theaters, showing segmented risk structures and targets in the microscope heads-up display after a registration process of physical space and image space.35 Besides mere anatomic MRIs, in recent years, functional data have been integrated into the navigation. The multimodality concept includes the display of eloquent cortical sites (given by fMRI),36 metabolic data (given, for example, by magnetic resonance spectroscoptic imaging or single-photon emission computed tomography37), or major white matter tracts.
DTI is validated, challenged, and developed according to acquisition schemes, image processing, analysis, and interpretation of its results.38 Early experiments showed that diffusion is faster along white matter tracts than perpendicular to the fiber bundle direction. This principle is the basis for the DTI-based tractography.8 For tensor calculation, the needed data set includes 1 b0 image and at least 6 diffusion-weighted images, each applied with a noncollinear diffusion gradient. However, today, a total of 30 gradient directions have been proposed for the reconstruction of language pathways.39
DTI-based fiber tractography relies on the mathematical reconstruction of 1 second-order tensor in each voxel, not capable of resolving spatial locations in case of crossing, kissing, or diverging fibers in the voxel. This is of special interest for tractography results of anatomically complex fiber bundles like language pathways or the optic tract. However, until today, promising tracking results have already been achieved on the basis of DTI that have been shown to contribute to a low postoperative morbidity when integrated into the navigation system,6 comparable to electrostimulation methods.40,41 The most commonly used algorithm is the deterministic tensor deflection algorithm, which has been proven to be feasible for reconstruction of fiber tracts without fanning fibers, curvatures or crossing, and kissing fibers. For anatomically complex fiber pathways like the language-associated tracts or the optic tract, probabilistic algorithms such as connectivity analysis42 or bayesian approaches10 have already shown success for more reliable tractography results based on DTI. Another method, which has been established for patient safety, is the placement of flexible hulls around the reconstructed fiber object.43 Thus, an additional safety margin of a 5-mm surface hull around the intraoperatively displayed object has been shown to avoid postoperative neurological deficits.7 Furthermore, the application of intraoperative high-field MRI has provided the possibility to obtain DTI intraoperatively. Fiber tractography with intraoperative DTI image data has shown to compensate for the effects of brain shift, also contributing to low postoperative morbidity.44
Despite enhanced patient safety as a result of these innovations in the field of DTI, the mentioned intrinsic drawbacks of this method cannot be overcome. Thus, there was a rising demand for alternative approaches. One of these was found using advanced diffusion models based on HARDI data sets. Multiple intravoxel fiber orientations are frequently reconstructed using analytical reconstruction based on spherical harmonics, or q-ball imaging,45 in which the diffusion signal is sampled directly on a sphere using the Funk Radon transform. This improvement of high angular resolution is associated with 1 significant drawback. Acquisition of HARDI data sets requires a significantly higher number of diffusion gradients, ranging from 60 to 100. Associated data acquisition times are up to 25 minutes (on a 3-T MRI system) as opposed to approximately 4 minutes for DTI (on a 3-T MRI system). However, frequently used for theoretical neuroimaging, for example, by Frey et al,46 clinical applications of HARDI are still rare. Thus, to the best of our knowledge, there is still no clinical study assessing HARDI in a neurosurgical patient collective. However, there seems to be particular impact of the method in cases of gliomas and perifocal edema with their associated more complex white matter architecture.
So far, several frameworks have been presented to achieve a higher practicability for HARDI-based fiber reconstruction, eg, Prckovska et al47 with a fused DTI/HARDI visualization or Reisert et al.48 Among these techniques, with the mathematical model CS, based on the theory of sparse representation, the particular drawback of the long image acquisition time of HARDI can be overcome. In this way, CS potentially enables the reconstruction of HARDI signals from as low as 20 diffusion gradients, although with a low reconstruction error of approximately 1%.24
With the following interpretation comparing the tracking results, we can support the described theoretical advantages of HARDI+CS-based over DTI-based tractography. Analysis of the reconstructed language-associated fiber tracts was performed on the basis of current standard of neuroanatomical knowledge, whereby the complex anatomy of language-associated cortical areas and their connecting fiber bundles is not fully understood. Based on the Geschwind49 model of the temporofrontal arc “arcuate fasciculus” connecting the Broca and Wernicke areas, there are new insights into the language-associated fiber structures, some of them based on diffusion studies. In this way, a “ventral pathway” is suggested, connecting the 2 cortical areas via the uncinate fasciculus, the external and extreme capsules.50-52 A study from Frey et al46 based on q-ball imaging45 suggests that Brodmann area 45 in particular interconnects via the extreme capsule. Specific inferior temporal areas, including the parahippocampal gyrus and the fusiform gyrus, are part of semantic processing and interconnect BA 44, 45 and posterior BA 22.53 However, other cortical sites like BA 6, 9, 21, 37, 40, or 39 and their associated interconnecting fibers are also involved in the cortical processing of language.54
Interpreting the tractography results indicates that the most obvious advantage of fiber tractography based on multidirectional diffusion patterns is the significantly higher compound and solid representation of the resulting fiber objects (Figures 2 and 3). This can be seen in all performed reconstructions, comparing results of HARDI+CS-based tractography with DTI-based results on the 3 different platforms, although DTI-based reconstructions also vary between platforms. It can be seen that with bigger tumor diameter, closer localization to the language pathways, or larger peritumoral edema, the tracking results differ more regarding the solidity of the fiber object, suggesting a higher rate of uncertainty (best seen in patient 5). In DTI-based fiber tracking objects, the fibers frequently fail to follow the curve around the sylvian fissure. This is the case on all 3 platforms, with very similar results seen for patients 1, 3, 4, and 5 (Figures 2 and 3). In contrast, the curvature or at least the beginning of the curve could be displayed with HARDI+CS-based tractography in these cases.
There also seems to be the expected advantage concerning the desired fiber reconstruction in near-tumor areas or in vasogenic edema. As can be seen in the HARDI+CS-based tractography results of patients 2, 4, and 5 (Figure 2), a solid fiber bundle can also be displayed in peritumoral edema. However, DTI-based fiber tractography displayed acceptable results consistently on all platforms for patients 1 and 6. This can be explained by the low peritumoral edema and localization of the oligodendroglioma and low-grade astrocytoma (Figure 2). DTI-based tractography fibers are rather displaced by tumor of peritumoral edema, or the tracking even terminates. This phenomenon is seen for patient 1 in iPlan Cranial and Slicer4 or patient 4 on Slicer4.
Despite these obvious advantages regarding image morphology, tractography results are not assessed quantitatively or compared with electrostimulation methods. Both methods have to be seen as in vivo estimation of course and localization of the fiber bundle. However, in our opinion, HARDI+CS-based fiber reconstruction is worth its effort in cases of large tumors with significant peritumoral edema. DTI tractography remains a feasible tool for tractography of pathways like the corticospinal tract or in proximity of smaller tumors with less peritumoral edema.
Despite these obvious advantages, certain drawbacks of the HARDI+CS-based fiber reconstruction have to be mentioned. Although using the same diffusion data set with 30 noncollinear gradients as the basis for DTI and HARDI+CS fiber reconstruction, the time for calculating orientation distribution functions and the fiber tracking procedure itself is significantly prolonged for HARDI+CS at 45 minutes compared with 5 minutes for DTI-based tractography. Although there are no drawbacks for the patient, this prolonged reconstruction process reduces practicability owing to larger effort in time and personnel. Time for DTI-based fiber tractography is almost consistent for iPlan Cranial, MedAlyVis, and Slicer4. In our opinion, the open-source platform Slicer4 and iPlan Cranial are orientated for clinical use, with a well-structured and easily manageable workflow. In contrast, the MedAlyVis platform emphasizes science applications and requires a longer teach-in period. As mentioned previously, intraoperative application of DTI-based fiber tractography has provided new insights into the phenomenon of brain shift with a shown clinical impact. HARDI+CS-based tractography is, in our opinion, not yet feasible for intraoperative use because of the long processing times that would lengthen surgery significantly. Alternatively, preoperative HARDI+CS-based fiber tractography can be combined with nonlinear registration techniques or sophisticated techniques from pattern recognition, allowing the matching of preoperative data sets, including functional data with intraoperative MRIs.55 Further registration techniques propose nonlinear registration of image space directly with the brain, not with the head. These techniques can also be applied for other intraoperative imaging modalities providing 3-D information such as ultrasound. Thus, intraoperative images can be nonlinearly registered to the preoperative data, providing the multimodal information.56,57
Outlook
Regarding image quality, future perspectives include the comparison of conventional HARDI- and HARDI+CS-based fiber objects. Furthermore, HARDI+CS will be obtained with varied MRI parameters such as voxel size, gantry tilt, or number of repetitions and number of diffusion gradients to compare the resulting fiber objects for optimization purposes. To assess accuracy, this can be done with a software phantom, offering the possibility to compare the resulting objects with a defined ground truth.
For clinically orientated future investigations, the most important steps will be the routine integration of HARDI+CS-based fiber reconstruction in the navigation system besides conventional DTI-based tractography results to support our hypothesis. This can be obtained, for instance, by using the binary mask derived from resulting fiber sets and visualized in a routinely used navigation software. To actually assess the clinical impact regarding accuracy and patient morbidity compared with DTI tractography, the intraoperative display of HARDI+CS fiber objects will be combined with subcortical stimulation methods. Furthermore, other tracking algorithms will be applied on the HARDI diffusion model and compared with the tensor deflection algorithm. The implementation of multidirectional diffusion models in open-source navigation planning software should also be an aim of future investigations, offering a user-friendly software interface that can be used by clinical physicians during daily business.
Conclusion
With our prospectively conducted case series on 6 patients, we show that HARDI+CS fulfills the requirement of adequately low data acquisition times, which are required for use in clinical practice. Furthermore, according to the DTI-based reconstruction of language pathways with 3 different platforms (iPlan Cranial, Slicer4, and MedAlyVis) compared with HARDI+CS-based reconstruction on MedAlyVis, we show that HARDI+CS-based reconstruction seems to have potential not only in the more compound display of reconstructed fibers but also in areas of locally disturbed diffusion (tumor and peritumoral edema).
Thus, HARDI+CS seems to be a new approach that combines the advantages of the estimation of multiple intravoxel fiber populations of HARDI with the clinical feasibility of routinely used DTI image data acquisition in presurgical practice. Despite longer preprocessing times and thus presurgical planning, there is no disadvantage for the patient regarding the presurgical workflow.
Acknowledgments
We would like to thank the members of the Slicer community for their contributions, especially Steve Pieper and Demian Wassermann (Department of Radiology, Brigham and Women's Hospital and Harvard Medical School, Boston, Massachusetts) for their support.
Disclosure: This work was supported in part by von Behring Roentgen Foundation, Germany (58-004), and European Regional Development Fund, project FNUSA-ICRC (No. CZ.1.05/1.1.00/02.0123). Dr Nimsky is scientific consultant for intraoperative imaging for BrainLab (Feldkirchen, Germany). The other authors have no personal financial or institutional interest in any of the drugs, materials, or devices described in this article.
Abbreviations
- AABT
Aachen Aphasia Bedside Test
- CS
compressed sending
- DTI
diffusion tensor imaging
- FA
fractional anisotropy
- fMRI
functional magnetic resonance imaging
- HARDI
high-angular-resolution diffusion imaging
- WHO
World Health Organization
References
- 1.Lacroix M, Abi-Said D, Fourney DR, et al. A multivariate analysis of 416 patients with glioblastoma multiforme: prognosis, extent of resection, and survival. J Neurosurg. 2001;95(2):190–198. doi: 10.3171/jns.2001.95.2.0190. [DOI] [PubMed] [Google Scholar]
- 2.McGirt MJ, Chaichana KL, Gathinji M, et al. Independent association of extent of resection with survival in patients with malignant brain astrocytoma. J Neurosurg. 2009;110(1):156–162. doi: 10.3171/2008.4.17536. [DOI] [PubMed] [Google Scholar]
- 3.Sanai N, Polley MY, McDermott MW, Parsa AT, Berger MS. An extent of resection threshold for newly diagnosed glioblastomas. J Neurosurg. 2011;115(1):3–8. doi: 10.3171/2011.2.jns10998. [DOI] [PubMed] [Google Scholar]
- 4.Kuhnt D, Becker A, Ganslandt O, Bauer M, Buchfelder M, Nimsky C. Correlation of the extent of tumor volume resection and patient survival in surgery of glioblastoma multiforme with high-field intraoperative MRI guidance. Neuro Oncol. 2011;13(12):1339–1348. doi: 10.1093/neuonc/nor133. [DOI] [PMC free article] [PubMed] [Google Scholar]
- 5.Senft C, Bink A, Franz K, Vatter H, Gasser T, Seifert V. Intraoperative MRI guidance and extent of resection in glioma surgery: a randomised, controlled trial. Lancet Oncol. 2011;12(11):997–1003. doi: 10.1016/S1470-2045(11)70196-6. [DOI] [PubMed] [Google Scholar]
- 6.Kuhnt D, Bauer MH, Becker A, et al. Intraoperative visualization of fiber tracking based reconstruction of language pathways in glioma surgery. Neurosurgery. 2012;70(4):911–919. doi: 10.1227/NEU.0b013e318237a807. discussion 919-920. [DOI] [PubMed] [Google Scholar]
- 7.Nimsky C, Ganslandt O, Merhof D, Sorensen AG, Fahlbusch R. Intraoperative visualization of the pyramidal tract by diffusion-tensor-imaging-based fiber tracking. Neuroimage. 2006;30(4):1219–1229. doi: 10.1016/j.neuroimage.2005.11.001. [DOI] [PubMed] [Google Scholar]
- 8.Basser PJ, Mattiello J, LeBihan D. MR diffusion tensor spectroscopy and imaging. Biophys J. 1994;66(1):259–267. doi: 10.1016/S0006-3495(94)80775-1. [DOI] [PMC free article] [PubMed] [Google Scholar]
- 9.Basser PJ, Pajevic S, Pierpaoli C, Duda J, Aldroubi A. In vivo fiber tractography using DT-MRI data. Magn Reson Med. 2000;44(4):625–632. doi: 10.1002/1522-2594(200010)44:4<625::aid-mrm17>3.0.co;2-o. [DOI] [PubMed] [Google Scholar]
- 10.Friman O, Farneback G, Westin CF. A bayesian approach for stochastic white matter tractography. IEEE Trans Med Imaging. 2006;25(8):965–978. doi: 10.1109/tmi.2006.877093. [DOI] [PubMed] [Google Scholar]
- 11.Mori S, van Zijl PC. Fiber tracking: principles and strategies: a technical review. NMR Biomed. 2002;15(7-8):468–480. doi: 10.1002/nbm.781. [DOI] [PubMed] [Google Scholar]
- 12.Stieltjes B, Kaufmann WE, van Zijl PC, et al. Diffusion tensor imaging and axonal tracking in the human brainstem. Neuroimage. 2001;14(3):723–735. doi: 10.1006/nimg.2001.0861. [DOI] [PubMed] [Google Scholar]
- 13.Frank LR. Anisotropy in high angular resolution diffusion-weighted MRI. Magn Reson Med. 2001;45(6):935–939. doi: 10.1002/mrm.1125. [DOI] [PubMed] [Google Scholar]
- 14.Alexander DC, Barker GJ, Arridge SR. Detection and modeling of non-gaussian apparent diffusion coefficient profiles in human brain data. Magn Reson Med. 2002;48(2):331–340. doi: 10.1002/mrm.10209. [DOI] [PubMed] [Google Scholar]
- 15.Descoteaux M, Deriche R, Knosche TR, Anwander A. Deterministic and probabilistic tractography based on complex fibre orientation distributions. IEEE Trans Med Imaging. 2009;28(2):269–286. doi: 10.1109/TMI.2008.2004424. [DOI] [PubMed] [Google Scholar]
- 16.Behrens TE, Berg HJ, Jbabdi S, Rushworth MF, Woolrich MW. Probabilistic diffusion tractography with multiple fibre orientations: what can we gain? Neuroimage. 2007;34(1):144–155. doi: 10.1016/j.neuroimage.2006.09.018. [DOI] [PMC free article] [PubMed] [Google Scholar]
- 17.Tuch DS, Reese TG, Wiegell MR, Makris N, Belliveau JW, Wedeen VJ. High angular resolution diffusion imaging reveals intravoxel white matter fiber heterogeneity. Magn Reson Med. 2002;48(4):577–582. doi: 10.1002/mrm.10268. [DOI] [PubMed] [Google Scholar]
- 18.Frank LR. Characterization of anisotropy in high angular resolution diffusion-weighted MRI. Magn Reson Med. 2002;47(6):1083–1099. doi: 10.1002/mrm.10156. [DOI] [PubMed] [Google Scholar]
- 19.Anderson AW. Measurement of fiber orientation distributions using high angular resolution diffusion imaging. Magn Reson Med. 2005;54(5):1194–1206. doi: 10.1002/mrm.20667. [DOI] [PubMed] [Google Scholar]
- 20.Descoteaux M, Angelino E, Fitzgibbons S, Deriche R. Apparent diffusion coefficients from high angular resolution diffusion imaging: estimation and applications. Magn Reson Med. 2006;56(2):395–410. doi: 10.1002/mrm.20948. [DOI] [PubMed] [Google Scholar]
- 21.Candes E, Romberg J. Quantitative robust uncertainty principles and optimally sparse decompositions. Foundations Computational Math. 2006;6(2):227–254. [Google Scholar]
- 22.Candes E, Romberg J, Tao T. Robust uncertainty principles: exact signal reconstruction from highly incomplete frequency information. IEEE Trans Inf Theory. 2006;52(2):489–509. [Google Scholar]
- 23.Donoho D. Compressed sensing. IEEE Trans Inf Theory. 2006;52(4):1289–1306. [Google Scholar]
- 24.Michailovich O, Rathi Y. Fast and accurate reconstruction of HARDI data using compressed sensing. Med Image Comput Comput Assist Interv. 2010;13(pt 1):607–614. doi: 10.1007/978-3-642-15705-9_74. [DOI] [PMC free article] [PubMed] [Google Scholar]
- 25.Nimsky C, Ganslandt O, Fahlbusch R. Implementation of fiber tract navigation. Neurosurgery. 2007;61(1 suppl):306–317. doi: 10.1227/01.neu.0000279224.83998.7d. discussion 317-318. [DOI] [PubMed] [Google Scholar]
- 26.Gering DT, Nabavi A, Kikinis R, et al. An integrated visualization system for surgical planning and guidance using image fusion and interventional imaging. Conf Med Image Comput Comput Assist Interv. 1999;2:809–819. [Google Scholar]
- 27.Pieper S, Halle M, Kikinis R. 3D slicer. Proceedings of the 1st International Symposium on Biomedical Imaging: From Nano to Macro 2004; 2004. pp. 632–635. [Google Scholar]
- 28.Pieper S, Lorensen B, Schroeder W, Kikinis R. The NA-MIC Kit: ITK, VTK, pipelines, grids and 3D slicer as an open platform for the medical image computing community. Paper presented at: Proceedings of the 3rd International Symposium on Biomedical Imaging: From Nano to Macro 2006; April 6-9, 2006; Arlington VA. [Google Scholar]
- 29.Merhof D. Reconstruction and Visualization of Neuronal Pathways From Diffusion Tensor Data. Erlangen Germany: Department of Neuroscience, University of Erlangen-Nuremberg; 2007. [Google Scholar]
- 30.Biniek R. Akute Aphasien. Stuttgart Germany: Thieme Verlag; 1997. [Google Scholar]
- 31.Jansen A, Menke R, Sommer J, et al. The assessment of hemispheric lateralization in functional MRI: robustness and reproducibility. Neuroimage. 2006;33(1):204–217. doi: 10.1016/j.neuroimage.2006.06.019. [DOI] [PubMed] [Google Scholar]
- 32.Michailovich O, Rathi Y. On approximation of orientation distributions by means of spherical ridgelets. IEEE Trans Image Process. 2010;19(2):461–477. doi: 10.1109/TIP.2009.2035886. [DOI] [PMC free article] [PubMed] [Google Scholar]
- 33.Michailovich O, Rathi Y, Dolui S. Spatially regularized compressed sensing for high angular resolution diffusion imaging. IEEE Trans Med Imaging. 2011;30(5):1100–1115. doi: 10.1109/TMI.2011.2142189. [DOI] [PMC free article] [PubMed] [Google Scholar]
- 34.Landgraf P, Richter M, Merhof D. Anisotropy of HARDI diffusion profiles based on the L2-Norm. In: Handels H, Ehrhardt J, Deserno TM, editors. Bildverarbeitung für die Medizin (BVM) Berlin Germany: Springer; 2011. [Google Scholar]
- 35.Roberts DW, Strohbehn JW, Hatch JF, Murray W, Kettenberger H. A frameless stereotaxic integration of computerized tomographic imaging and the operating microscope. J Neurosurg. 1986;65(4):545–549. doi: 10.3171/jns.1986.65.4.0545. [DOI] [PubMed] [Google Scholar]
- 36.Gasser T, Sandalcioglu E, Schoch B, et al. Functional magnetic resonance imaging in anesthetized patients: a relevant step toward real-time intraoperative functional neuroimaging. Neurosurgery. 2005;57(1 suppl):94–99. doi: 10.1227/01.neu.0000163488.91335.c5. discussion 94-99. [DOI] [PubMed] [Google Scholar]
- 37.Stadlbauer A, Prante O, Nimsky C, et al. Metabolic imaging of cerebral gliomas: spatial correlation of changes in O-(2-18F-fluoroethyl)-L-tyrosine PET and proton magnetic resonance spectroscopic imaging. J Nucl Med. 2008;49(5):721–729. doi: 10.2967/jnumed.107.049213. [DOI] [PubMed] [Google Scholar]
- 38.Assaf Y, Pasternak O. Diffusion tensor imaging (DTI)-based white matter mapping in brain research: a review. J Mol Neurosci. 2008;34(1):51–61. doi: 10.1007/s12031-007-0029-0. [DOI] [PubMed] [Google Scholar]
- 39.Jones DK. The effect of gradient sampling schemes on measures derived from diffusion tensor MRI: a Monte Carlo study. Magn Reson Med. 2004;51(4):807–815. doi: 10.1002/mrm.20033. [DOI] [PubMed] [Google Scholar]
- 40.Berger MS. Minimalism through intraoperative functional mapping. Clin Neurosurg. 1996;43:324–337. [PubMed] [Google Scholar]
- 41.Duffau H, Denvil D, Lopes M, et al. Intraoperative mapping of the cortical areas involved in multiplication and subtraction: an electrostimulation study in a patient with a left parietal glioma. J Neurol Neurosurg Psychiatry. 2002;73(6):733–738. doi: 10.1136/jnnp.73.6.733. [DOI] [PMC free article] [PubMed] [Google Scholar]
- 42.Merhof D, Richter M, Enders F, et al. Fast and accurate connectivity analysis between functional regions based on DT-MRI. Med Image Comput Comput Assist Interv. 2006;9(pt 2):225–233. doi: 10.1007/11866763_28. [DOI] [PubMed] [Google Scholar]
- 43.Merhof D, Meister M, Bingol E, Nimsky C, Greiner G. Isosurface-based generation of hulls encompassing neuronal pathways. Stereotact Funct Neurosurg. 2009;87(1):50–60. doi: 10.1159/000195720. [DOI] [PubMed] [Google Scholar]
- 44.Nimsky C, Ganslandt O, Hastreiter P, et al. Preoperative and intraoperative diffusion tensor imaging-based fiber tracking in glioma surgery. Neurosurgery. 2007;61(1 suppl):178–185. doi: 10.1227/01.neu.0000279214.00139.3b. discussion 186. [DOI] [PubMed] [Google Scholar]
- 45.Tuch DS. Q-ball imaging. Magn Reson Med. 2004;52(6):1358–1372. doi: 10.1002/mrm.20279. [DOI] [PubMed] [Google Scholar]
- 46.Frey S, Campbell JS, Pike GB, Petrides M. Dissociating the human language pathways with high angular resolution diffusion fiber tractography. J Neurosci. 2008;28(45):11435–11444. doi: 10.1523/JNEUROSCI.2388-08.2008. [DOI] [PMC free article] [PubMed] [Google Scholar]
- 47.Prckovska V, Peeters TH, van Almsick M, Romeny B, Vilanova A. Fused DTI/HARDI visualization. IEEE Trans Vis Comput Graph. 2011;17(10):1407–1419. doi: 10.1109/TVCG.2010.244. [DOI] [PubMed] [Google Scholar]
- 48.Reisert M, Mader I, Anastasopoulos C, Weigel M, Schnell S, Kiselev V. Global fiber reconstruction becomes practical. Neuroimage. 2011;54(2):955–962. doi: 10.1016/j.neuroimage.2010.09.016. [DOI] [PubMed] [Google Scholar]
- 49.Geschwind N. The organization of language and the brain. Science. 1970;170(3961):940–944. doi: 10.1126/science.170.3961.940. [DOI] [PubMed] [Google Scholar]
- 50.Croxson PL, Johansen-Berg H, Behrens TE, et al. Quantitative investigation of connections of the prefrontal cortex in the human and macaque using probabilistic diffusion tractography. J Neurosci. 2005;25(39):8854–8866. doi: 10.1523/JNEUROSCI.1311-05.2005. [DOI] [PMC free article] [PubMed] [Google Scholar]
- 51.Catani M, Jones DK, ffytche DH. Perisylvian language networks of the human brain. Ann Neurol. 2005;57(1):8–16. doi: 10.1002/ana.20319. [DOI] [PubMed] [Google Scholar]
- 52.Powell HW, Parker GJ, Alexander DC, et al. Hemispheric asymmetries in language-related pathways: a combined functional MRI and tractography study. Neuroimage. 2006;32(1):388–399. doi: 10.1016/j.neuroimage.2006.03.011. [DOI] [PubMed] [Google Scholar]
- 53.Pulvermuller F, Fadiga L. Active perception: sensorimotor circuits as a cortical basis for language. Nat Rev Neurosci. 2010;11(5):351–360. doi: 10.1038/nrn2811. [DOI] [PubMed] [Google Scholar]
- 54.Saur D, Kreher BW, Schnell S, et al. Ventral and dorsal pathways for language. Proc Natl Acad Sci U S A. 2008;105(46):18035–18040. doi: 10.1073/pnas.0805234105. [DOI] [PMC free article] [PubMed] [Google Scholar]
- 55.Archip N, Clatz O, Whalen S, et al. Non-rigid alignment of pre-operative MRI, fMRI, and DT-MRI with intra-operative MRI for enhanced visualization and navigation in image-guided neurosurgery. Neuroimage. 2007;35(2):609–624. doi: 10.1016/j.neuroimage.2006.11.060. [DOI] [PMC free article] [PubMed] [Google Scholar]
- 56.Cao A, Thompson RC, Dumpuri P, et al. Laser range scanning for image-guided neurosurgery: investigation of image-to-physical space registrations. Med Phys. 2008;35(4):1593–1605. doi: 10.1118/1.2870216. [DOI] [PMC free article] [PubMed] [Google Scholar]
- 57.Miga MI, Sinha TK, Cash DM, Galloway RL, Weil RJ. Cortical surface registration for image-guided neurosurgery using laser-range scanning. IEEE Trans Med Imaging. 2003;22(8):973–985. doi: 10.1109/TMI.2003.815868. [DOI] [PMC free article] [PubMed] [Google Scholar]