Abstract
Improvements in metabolite-profiling techniques are providing increased breadth of coverage of the human metabolome and may highlight biomarkers and pathways in common diseases such as diabetes. Using a metabolomics platform that analyzes intermediary organic acids, purines, pyrimidines, and other compounds, we performed a nested case-control study of 188 individuals who developed diabetes and 188 propensity-matched controls from 2,422 normoglycemic participants followed for 12 years in the Framingham Heart Study. The metabolite 2-aminoadipic acid (2-AAA) was most strongly associated with the risk of developing diabetes. Individuals with 2-AAA concentrations in the top quartile had greater than a 4-fold risk of developing diabetes. Levels of 2-AAA were not well correlated with other metabolite biomarkers of diabetes, such as branched chain amino acids and aromatic amino acids, suggesting they report on a distinct pathophysiological pathway. In experimental studies, administration of 2-AAA lowered fasting plasma glucose levels in mice fed both standard chow and high-fat diets. Further, 2-AAA treatment enhanced insulin secretion from a pancreatic β cell line as well as murine and human islets. These data highlight a metabolite not previously associated with diabetes risk that is increased up to 12 years before the onset of overt disease. Our findings suggest that 2-AAA is a marker of diabetes risk and a potential modulator of glucose homeostasis in humans.
Introduction
The burden of type 2 diabetes mellitus (T2DM) is increasing, with an estimated 366 million cases worldwide. Given the availability of proven interventions for delaying or preventing diabetes, early identification of individuals at risk is a public health priority (1–4). Emerging technologies have enhanced the feasibility of acquiring detailed profiles of a human’s metabolic status (metabolite profiling, or metabolomics) (5–9). These techniques, which allow the assessment of large numbers of metabolites that are substrates and products in metabolic pathways, have the potential to identify biochemical changes before the onset of overt clinical disease.
Ongoing improvements in metabolomics technologies now provide sufficient sample throughput to make studies of epidemiological cohorts more feasible (6–9). In an initial “proof-of-principle” study, we found that branched chain and aromatic amino acid concentrations had a significant association with future T2DM in individuals with normal glucose tolerance (8). We recently developed a liquid chromatography–tandem mass spectrometry (LC-MS/MS) method capable of profiling 70 intermediary organic acids, purines, pyrimidines, and other compounds that had not been assayed previously in our population-based studies (8, 9). Using this method, we sought to identify new metabolite biomarkers of diabetes risk in 2 large, epidemiologic cohorts with more than a decade of follow-up. We then studied the functional effects of the strongest metabolite predictor in cell-based and animal studies.
Results
2-AAA predicts future diabetes in the Framingham Heart Study.
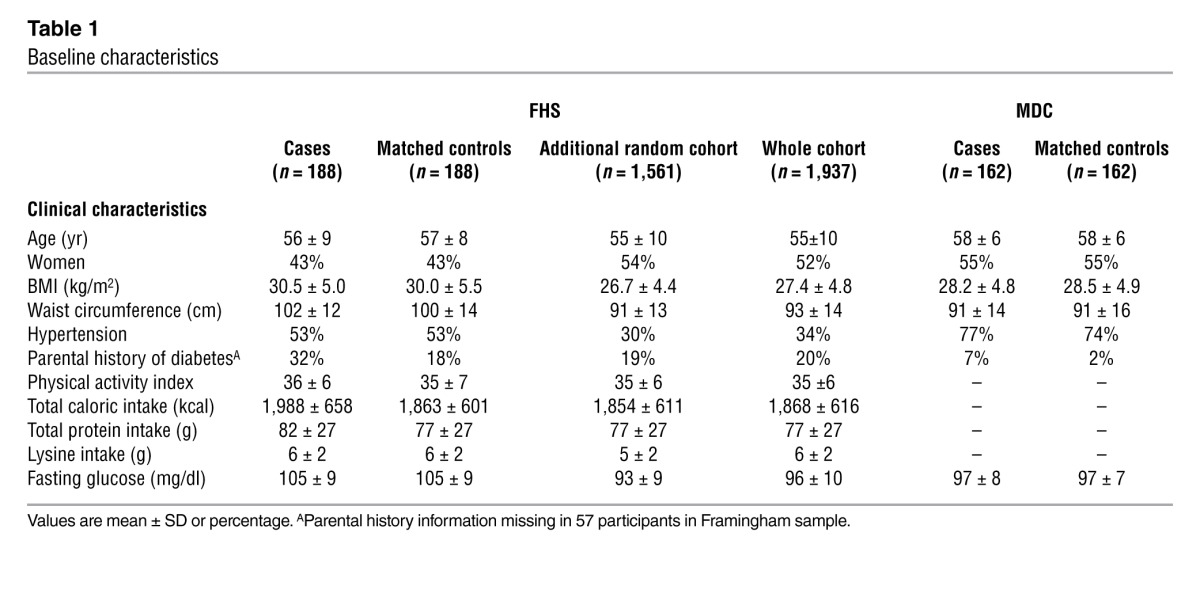
Baseline clinical characteristics are shown in Table 1. Cases and controls were similar with respect to age, sex, BMI, and fasting glucose. From a screen of 70 metabolites, 2-aminoadipic acid (2-AAA) had the strongest association with future diabetes (P = 0.0009, with a higher fasting concentration in the cases). Results for all metabolites profiled are shown in Supplemental Table 1 (supplemental material available online with this article; doi: 10.1172/JCI64801DS1).
Table 1.
Baseline characteristics
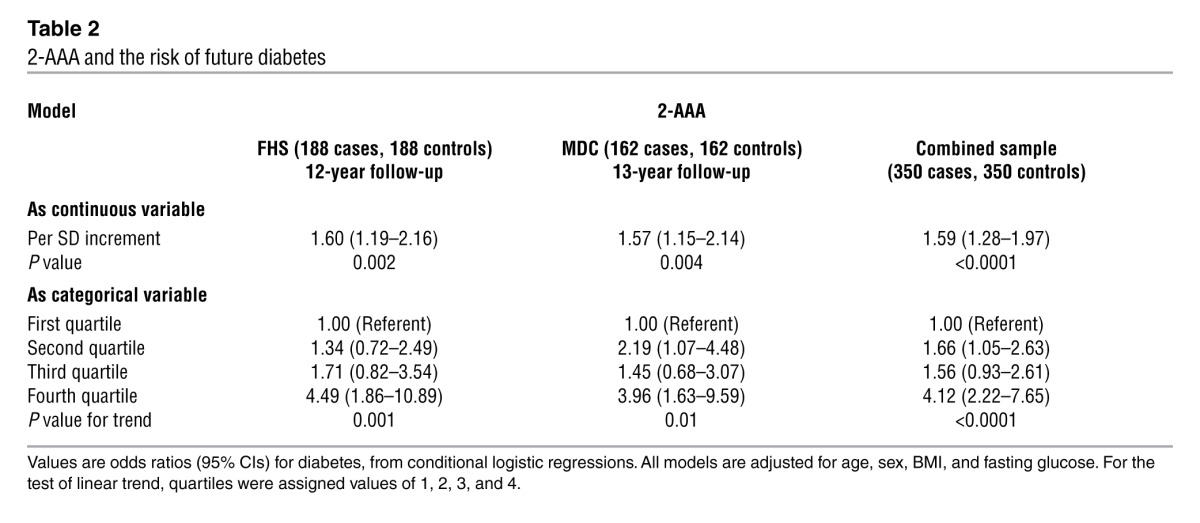
Conditional logistic regression models were performed adjusting for age, sex, BMI, and fasting glucose (Table 2). Each SD increment in log marker was associated with a 60% increased odds of future diabetes (P = 0.002). Individuals in the top quartile of plasma 2-AAA concentration had a 4-fold higher odds of developing diabetes over the 12-year follow-up period compared with those in the lowest quartile (adjusted odds ratio 4.49, 95% CI, 1.86 to 10.89). Results were similar after further adjustment for parental history of diabetes, total caloric intake, and dietary protein, fat, or carbohydrates (data not shown). There was no interaction between follow-up year and the case-control difference for 2-AAA (P > 0.10), suggesting a stable association with new-onset diabetes during the follow-up period. The association with 2-AAA was similar in analyses restricted to diabetes cases diagnosed 8 or more years after the baseline examination. In this analysis, the odds ratio for individuals in the highest quartile of 2-AAA was 4.16 (95% CI, 1.26–13.8).
Table 2.
2-AAA and the risk of future diabetes
2-AAA is associated with insulin resistance and β cell function.
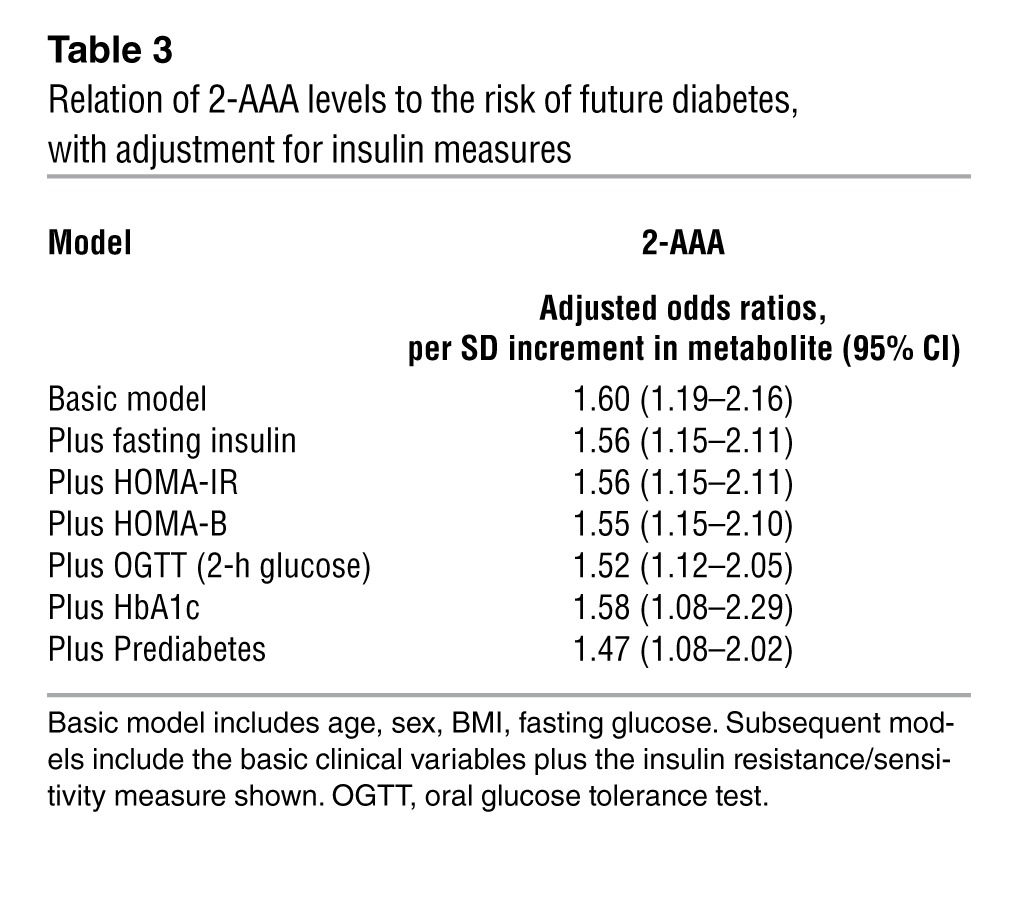
Results for biochemical measures of insulin resistance and β cell function are shown in Supplemental Table 2. Fasting concentrations of 2-AAA were moderately correlated with fasting insulin (age- and sex-adjusted partial correlation, r = 0.25; P < 0.001), homeostasis model assessment of insulin resistance (HOMA-IR) (r = 0.24; P < 0.001), homeostasis model assessment of β cell function (HOMA-B) (r = 0.25, P < 0.001), and 2-hour glucose during oral glucose tolerance testing (r = 0.14; P = 0.006). Baseline concentrations of 2-AAA and hemoglobin A1c (HbA1c) were not significantly correlated (r = 0.05; P = 0.37), consistent with the nondiabetic status of all individuals at baseline. The association of 2-AAA levels and incident diabetes was unchanged even after adjusting for these measures of insulin resistance and β cell function (Table 3). There were also no significant associations between 2-AAA and dietary intake of fat, protein, carbohydrates, or lysine assessed using a food frequency questionnaire (ref. 10 and data not shown).
Table 3.
Relation of 2-AAA levels to the risk of future diabetes, with adjustment for insulin measures
Replication of the results.
We performed replication studies in the Malmö Diet and Cancer Study (MDC). As in the Framingham Heart Study (FHS), concentrations of 2-AAA were significantly higher in cases compared with matched controls (P = 0.004; pooled P < 0.0001). There was a 57% increased odds of future diabetes per SD increment in 2-AAA (P = 0.004), nearly identical to that found in FHS (Table 2). Individuals in the top quartile had an adjusted odds for incident diabetes of 3.96 (95% CI, 1.63 to 9.59).
Findings are not attenuated by amino acid biomarkers.
Since we have previously demonstrated that elevated levels of branched chain (isoleucine, leucine, and valine) and aromatic amino acids (phenylalanine and tyrosine) are associated with future diabetes, we examined the relationship between 2-AAA and these metabolites. Concentrations of 2-AAA were poorly correlated with both the branched chain amino acids (r = 0.04 to 0.24) and aromatic amino acids (r = 0.01 to 0.13). Adjustment for amino acids did not substantially attenuate the association between 2-AAA and future diabetes risk in FHS or the MDC (data not shown).
Relation with metabolites in other pathways.
2-AAA is generated by lysine degradation and may also serve as a substrate for enzymes downstream of tryptophan metabolism. Thus, we examined age- and sex-adjusted correlations between 2-AAA and selected metabolites in these pathways. Modest correlations were noted between 2-AAA and lysine (r = 0.38, P < 0.001), kynurenic acid (r = 0.19, P < 0.001), and anthranilic acid (r = 0.27, P < 0.001), though only 2-AAA predicted incident diabetes.
Confirmation of the results in whole cohort analyses.
The case-control analyses were enriched for individuals with “high-risk” features, such as obesity and elevated fasting glucose. Thus, to assess the generalizability of the results in a more heterogeneous cohort, we performed metabolomic profiling on an additional 1,561 randomly selected subjects from the FHS Offspring Study cohort. As expected, the individuals in the extended sample had a lower mean fasting glucose and BMI compared with the original case-control samples (shown in Table 1). In multivariable Cox regression analyses adjusted for age, sex, fasting glucose, and BMI, 2-AAA levels remained associated with future diabetes development (adjusted odds ratio 1.37 per SD increment, P = 0.0003; Table 4). The results were unchanged when models were further adjusted for estimated glomerular filtration rate. Model discrimination was assessed using the net reclassification improvement (NRI) and the C-statistic. The NRI was highly significant when comparing models with and without 2-AAA (0.36, 95% CI, 0.22 to 0.49; P < 0.0001). The increase in the C-statistic was modest (0.91 to 0.92, P = 0.11), largely due to the very high baseline value (11).
Table 4.
Relation of 2-AAA levels to the risk of future diabetes in the whole sample and subgroups
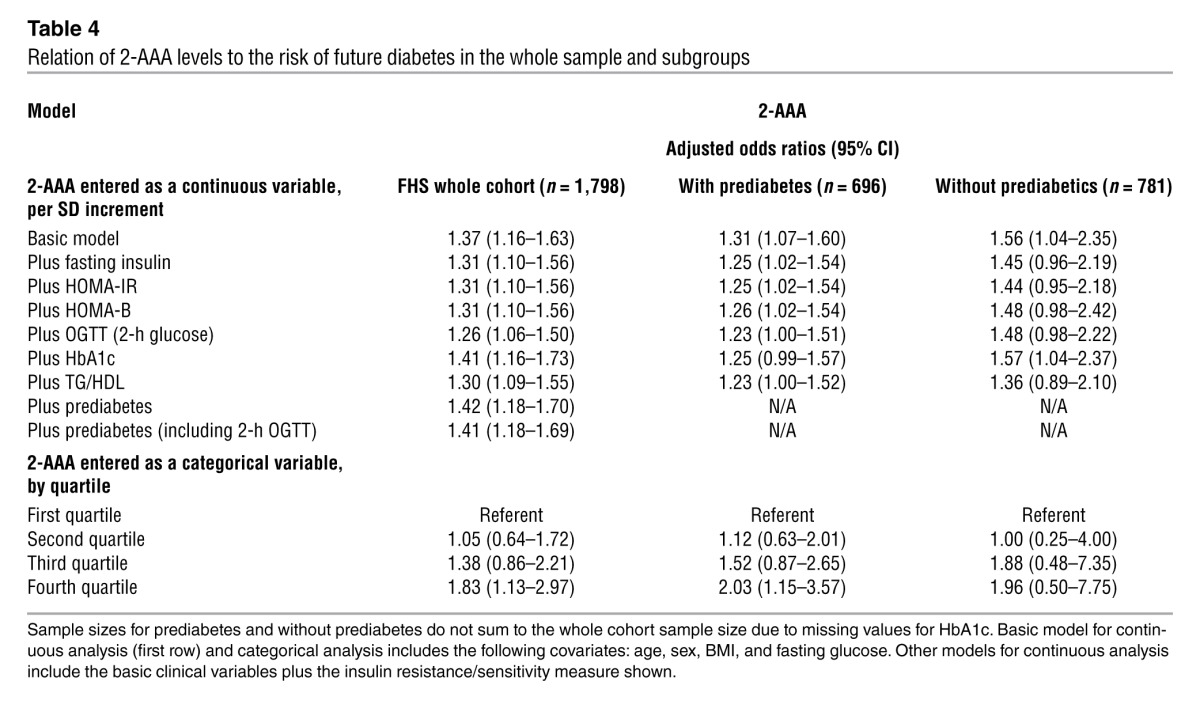
In the whole cohort sample, individuals with 2-AAA values in the highest quartile had an approximately 2-fold risk of developing diabetes compared with individuals in the lowest quartile (Supplemental Table 3). This risk was comparable to that observed in individuals with insulin and HbA1c values in the top quartile and lower than the risk observed for individuals in the top quartile of BMI or fasting glucose.
Additional adjustment for the presence of prediabetes (defined as HbA1c 5.7%–6.4% or fasting glucose 100–125 mg/dl) did not alter the results, in either the FHS or the MDC samples. We also performed separate analyses in the subgroups of individuals without and with prediabetes (Table 4). Our findings in the FHS were similar in individuals without prediabetes (n = 781; multivariable-adjusted hazard ratio per SD increment, 1.56, 95% CI 1.04–2.35) and individuals with prediabetes (n = 696; 1.42, 1.18–1.70), indicating that the predictive value of 2-AAA was not restricted to individuals with prediabetes. In the MDC, near identical results were also obtained in both subsets (prediabetes: OR 1.93 [1.09–3.42] vs. without prediabetes: 1.82 [1.06–3.12]).
Normative values for 2-AAA levels in the FHS cohort are detailed in Supplemental Table 4.
Studies of 2-AAA in mice and tissues.
We first examined the effects of a Western-style diet on circulating 2-AAA levels in mice. Animals fed a high-fat diet (HFD) had a 33% increase in baseline glucose concentrations and a 17% increase in insulin levels after 4 weeks. Circulating 2-AAA levels were 51% higher in animals on an HFD compared with those fed the standard chow diet (SCD) (n ≥ 11 mice per group, P = 0.01). Using an isotopically labeled standard and MS, we verified that the 2-AAA content was negligible in both the HFD and SCD (data not shown).
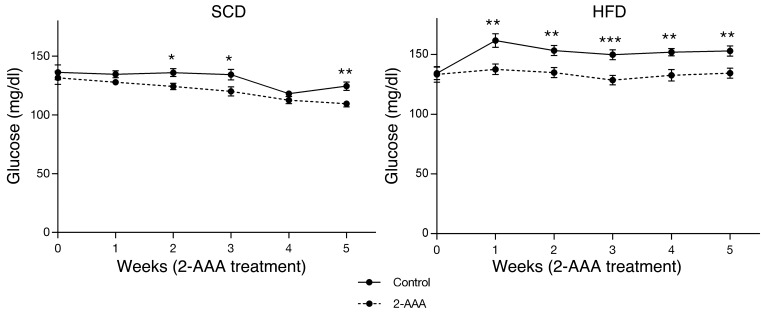
We then determined whether 2-AAA might play a contributory or compensatory role in glucose homeostasis by performing 2-AAA intervention studies in mice. Four cohorts of 24 C57BL/6 male mice entered the study protocol at 6 weeks of age. Two cohorts received an SCD and 2 cohorts received an HFD. Half of the mice assigned to each diet received 2-AAA (500 mg/kg of body weight/d) via the drinking water for 5 weeks. Mice supplemented with 2-AAA had 33% higher plasma levels of this metabolite by 1 week of treatment (P = 0.018). We found consistently lower baseline fasting glucose levels in the 2-AAA–treated mice on both diets (P < 0.001 by 2-way ANOVA analysis after 5 weeks; Figure 1). For mice on the SCD, fasting glucose levels were 109.5 ± 3.8 mg/dl for the 2-AAA–treated animals as compared with 124.5 ± 4.9 mg/dl for the untreated controls after 5 weeks (P < 0.01, Figure 1). For mice challenged with an HFD, fasting glucose levels were higher and the differences due to 2-AAA treatment were accentuated (134.5 ± 5.9 vs. 153.0 ± 6.0 vs. mg/dl at 5 weeks; P < 0.01; Figure 1). There were no significant differences in food intake or weight between treated and control mice (Supplemental Figure 1).
Figure 1. Fasting plasma glucose levels were measured weekly in mice fed either SCD (left) or HFD (right) beginning at 6 weeks of age, with simultaneous 2-AAA treatment via drinking water (500/mg/kg/d) or water alone for the subsequent 5 weeks (n = 24 mice per condition). *P < 0.05; **P < 0.01; ***P < 0.001.
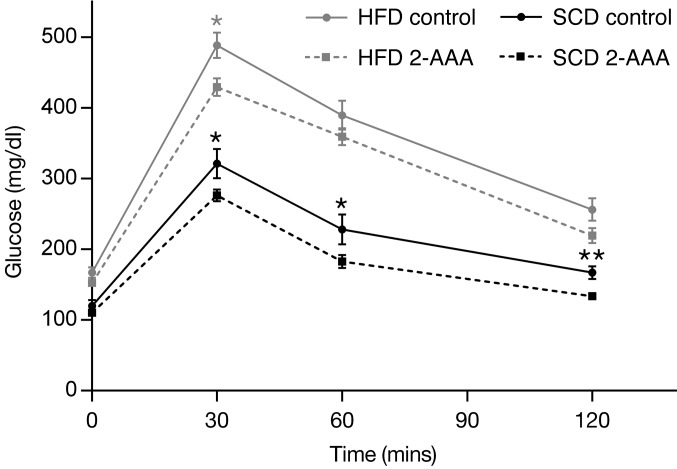
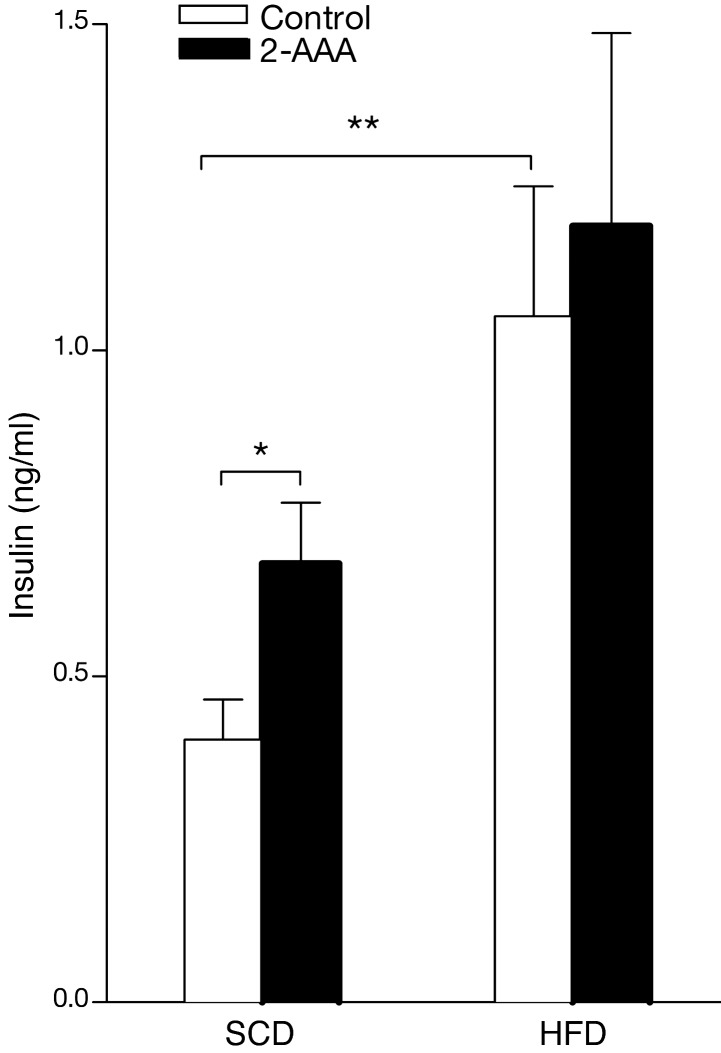
We also performed studies using acute physiologic challenges, including acute glucose and insulin administration. As expected, mice fed an HFD had more pronounced glucose excursions following the glucose challenge (Figure 2). In mice fed both the SCD and HFD for 5 weeks or more, peak glucose concentrations following the glucose challenge were lower in the 2-AAA–treated mice. We also observed increases in fasting insulin levels in the HFD animals as compared with the SCD controls (1.040 ± 0.203 vs. 0.411 ± 0.061 ng/ml, respectively; P = 0.013), which was further augmented by the administration of 2-AAA (Figure 3). Following acute insulin challenge, 2-AAA had no effect on the rate of decline in glucose levels (Supplemental Figure 2), indicating no difference in peripheral insulin sensitivity. Taken together, these findings highlight a role for 2-AAA in modulating glucose levels in vivo. 2-AAA treatment appears to augment circulating insulin concentrations without altering peripheral insulin resistance.
Figure 2. IPGTTs were performed after completion of the 2-AAA chronic treatment in mice fed either the SCD or HFD (n = 12 mice per condition). *P < 0.05; **P < 0.01.
Figure 3. Fasting plasma insulin was measured following completion of the 2-AAA treatment (5 weeks) in the mice on both diets (n = 12 mice per condition). *P < 0.05; **P < 0.01.
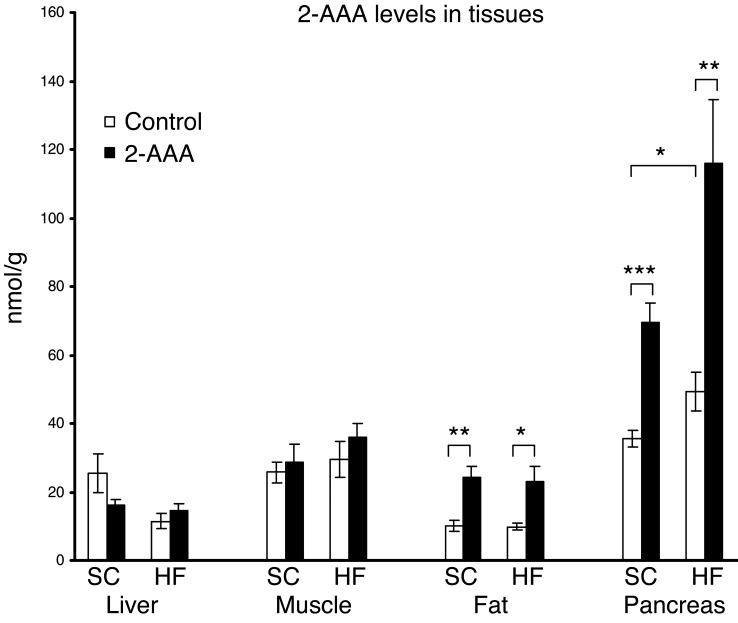
To better understand the source of 2-AAA and the organ in which it might be playing a functional role, we used LC-MS/MS to measure 2-AAA levels in metabolically active tissue (muscle, liver, fat, and pancreas). We studied mice both at baseline and following the chronic administration of 2-AAA on either an SCD or an HFD. We used an isotopically labeled standard for our studies to facilitate absolute quantitation of the metabolite of interest in the setting of the different biological matrices. These studies demonstrated that 2-AAA was most abundant in the pancreas, though it was also present in all of the tissues tested in varying amounts. Furthermore, in the pancreas alone, we documented higher 2-AAA levels following the administration of the HFD as compared with SCD (49.31 ± 5.75 vs. 35.54 ± 2.54 nmol/g tissue, P < 0.05), as well as a striking increase in 2-AAA levels following 2-AAA administration (SCD control vs. SCD treated: 35.54 ± 2.54 vs. 69.4 ± 5.66 nmol/g tissue, P < 0.001; HFD control vs. HFD treated: 49.31 ± 5.75 vs. 115.88 ± 18.57 nmol/g tissue, P < 0.002; Figure 4).
Figure 4. 2-AAA levels in liver, muscle, fat, and pancreas were measured using an isotopically labeled standard (see Methods).
2-AAA levels were increased following the administration of the HFD as compared with the SCD and further augmented following 2-AAA administration (n = 12 per condition). *P < 0.05; **P < 0.01; ***P < 0.001.
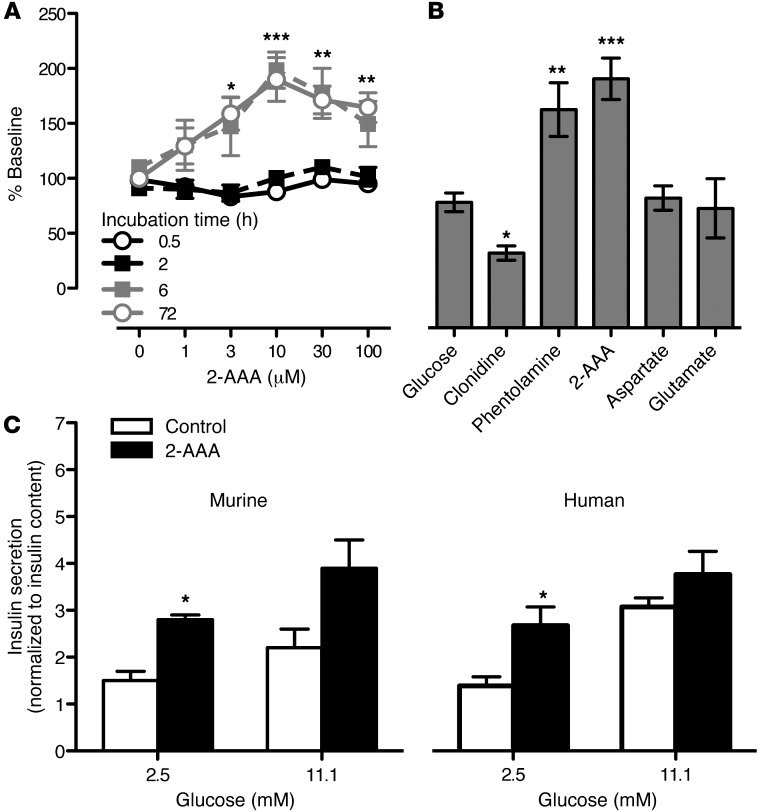
These findings suggested a connection between 2-AAA and the pancreas. Thus, we studied insulin production by a pancreatic β cell line that was acutely and chronically exposed to 2-AAA. 2-AAA induced insulin secretion from BTC6 cells in a dose- and time-dependent fashion at both 2.5 mM ambient glucose concentration during the incubation period (Figure 5A), and 5 mM ambient glucose concentration (Supplemental Figure 3). The concentrations used to elicit secretion were in the physiologic range. By way of comparison, clonidine (a known inhibitor of insulin secretion) decreased insulin levels to 60% ± 3% of control and phentolamine (a known potent stimulator) increased insulin secretion to 172% ± 8% of control, which was comparable to the peak secretion triggered by 2-AAA (Figure 5B). Glutamate and aspartate, acidic amino acids with some structural similarity to 2-AAA, did not augment insulin secretion in BTC6 cells, highlighting the specificity of the 2-AAA effect in vitro (Figure 5B).
Figure 5. 2-AAA stimulated insulin secretion in BTC6 and islet cell systems.
(A) BTC6 cells were incubated with 2-AAA at concentrations ranging from 0 to 100 μM for 0.5 to 72 hours to assess whether this compound increases insulin secretion in a time and/or dose dependent fashion. (B) We then compared the extent of 2-AAA–stimulated (30 μM) insulin secretion to the effects of clonidine (100 μM) and phentolamine (100 μM), which inhibit and stimulate insulin secretion in islet cells, respectively. Glutamate (30 μM) and aspartate (30 μM) did not elicit insulin secretion over baseline. (C) 2-AAA also augments insulin secretion in primary murine islets and human islets at a basal glucose concentration (2.5 mmol/l). This 2-AAA augmentation effect observed on insulin secretion is reduced in the presence of an insulin stimulatory glucose concentration (11.1 mmol/l). Insulin secretion is normalized to total intracellular insulin content. Data from n = 3 replicates of 15 murine islets or 25 human islets are shown. *P < 0.05; **P < 0.01; ***P < 0.001.
To further examine the physiologic relevance of our findings, we performed similar experiments on isolated primary murine islets. Consistent with the findings in the cell line, 30 μM 2-AAA augmented insulin secretion in murine islets under low glucose (2.5 mmol/l) conditions (2-AAA vs. control: 2.8% ± 0.1% vs. 1.5% ± 0.1% of total insulin content, P = 0.02, n = 3, Figure 5C). Under high glucose (11.1 mmol/l) conditions, the effect of 2-AAA was attenuated (n = 3). Of note, there was no increase in insulin content in the intact islets as a result of 2-AAA incubation, arguing against de novo insulin synthesis as a mechanism of increased 2-AAA–induced insulin secretion. While these studies on BTC6 cells and isolated murine islets strongly indicate a direct effect of 2-AAA on insulin secretion, it is also important to determine whether 2-AAA directly stimulates insulin secretion from human islets. In this system, 30 μM 2-AAA significantly increased insulin secretion under low glucose conditions (2.5 mmol/l) when compared with control (2.6% ± 0.4% vs. 1.3% ± 0.1% of total insulin content, P = 0.005, n = 3, Figure 5C), though the augmentation was again less prominent under high glucose conditions (11.1 mmol/l; n = 3). These observations suggest that during periods of low (basal) plasma glucose, elevated 2-AAA levels may be sufficient to induce insulin release. This signal is attenuated as the physiological glucose stimulus becomes more dominant.
Discussion
In summary, we identified a metabolite biomarker (2-AAA) that predicts the development of diabetes in normoglycemic individuals. Individuals with high plasma 2-AAA concentrations had up to a 4-fold risk of future diabetes, a finding observed in 2 independent cohorts. Follow-up experiments provide evidence that this small molecule may modulate glucose homeostasis in vivo, while in vitro studies support an effect of 2-AAA on insulin secretion in a pancreatic β cell line and in isolated islets. Taken together, our findings highlight a pathway not previously associated with glucose homeostasis and suggest a new metabolic marker that could aid in diabetes risk assessment.
An important strength of the current investigation is the use of 2 well-characterized longitudinal cohorts with long follow-up periods. All individuals in our study were free of diabetes at the time the blood samples were collected, minimizing potential confounding from medical or lifestyle interventions. Indeed, we found that circulating 2-AAA was elevated many years before the onset of diabetes. Furthermore, the relative risk associated with elevated 2-AAA concentrations was not attenuated by adjustment for standard biochemical measures of insulin resistance in the fasting state or for branched chain and aromatic amino acids, previously validated risk predictors for diabetes. We also found no evidence that differences in 2-AAA levels in cases and controls were attributable to differences in renal function. However, because we lacked concurrent urine samples, we were not able to measure the fractional clearance of 2-AAA directly.
2-AAA is a poorly characterized product of lysine degradation. The ε-amino group of lysine residues in proteins can undergo deamination by metal-catalyzed oxidation to form the intermediate allysine, which in turn undergoes further oxidation to form 2-AAA (12). 2-AAA may appear in the circulation from degradation of whole tissue or plasma proteins. Alternatively, 2-AAA might be generated from circulating lysine by some unknown enzymatic pathway.
Previous studies of 2-AAA in humans are limited. It has been reported that 2-AAA levels are elevated in acid hydrolysates of processed skin from older individuals with diabetes, and this group has postulated that 2-AAA may be part of a carbonyl stress pathway in diabetes (13, 14). To our knowledge, no prior studies have documented the presence of elevated circulating plasma levels of this metabolite in individuals before the onset of overt disease.
Tsutsui and colleagues (15) previously performed metabolite profiling in obese ddY mice and observed increased peak areas corresponding to 2-AAA and other lysine pathway metabolites in obese mice as compared with controls, though only semiquantitative analyses were performed. One other study has documented increased concentrations of 2-AAA in Zucker diabetic rats (16). Our experimental findings extend this prior work by demonstrating higher 2-AAA levels in hyperinsulinemic mice fed an HFD. Furthermore, we demonstrate that administration of this small molecule to mice leads to a reproducible decrease in fasting glucose levels in the setting of multiple physiologic challenges. Metabolite profiling studies of tissues highlighted the pancreas as a potential organ of action for 2-AAA, and in vitro studies suggest that chronic administration of the metabolite increases β cell insulin secretion.
The development of impaired glucose tolerance (IGT) and T2DM is characterized by decreased insulin sensitivity with an initial compensatory upregulation of insulin secretion. IGT and T2DM result when insulin secretion can no longer compensate (17). Recent studies by multiple groups have highlighted a hyperaminoacidemia in prediabetes, a finding that was originally described by Felig and colleagues (18). Elevated circulating levels of amino acids in prediabetes may be secondary to increased dietary intake and/or related to decreased uptake of amino acids by skeletal muscle in the setting of insulin resistance (19, 20). Branched chain amino acids have particularly pleiotropic effects, serving as insulin secretagogues (21), and may also further modulate peripheral insulin sensitivity themselves via activation of the mTOR and p70S6 kinase pathways (22, 23). 2-AAA is endogenously produced, and levels may be augmented as a compensatory response to the hyperglycemia induced by an HFD, for example. In turn, 2-AAA augments insulin secretion in cell-based, islet, and animal model systems. Thus, we hypothesize that this particular amino acid breakdown product contributes to a compensatory mechanism by which insulin secretion is upregulated to maintain glucose homeostasis in early insulin resistance. Accordingly, 2-AAA conveys information that is not reflected by conventional insulin resistance markers.
Of note, we have also investigated other potential physiologic effects of 2-AAA, though we found no consistent effects on gluconeogenesis in H4IIE hepatoma cells or glucose uptake by L6 myocyte cells (data not shown). Treatment with 2-AAA had no effect on peripheral insulin sensitivity in mice as demonstrated by insulin tolerance tests (ITTs). In addition, there was no evidence that supplementation resulted in reduced food intake or reduced obesity to explain its effect on fasting glucose levels.
We pursued the 2-AAA finding in the replication cohort and mechanistic studies because it demonstrated the strongest initial association with incident DM (P = 0.0009). Though the initial FHS p-value exceeded a strict Bonferroni threshold (P < 0.0007), we successfully replicated our findings in an independent cohort and the final P-value (P < 0.0001) was well below the Bonferroni threshold. We used a “targeted” approach that couples liquid chromatography with a triple quadrupole tandem mass spectrometer (LC-MS/MS). This methodology provides unambiguous identification of analytes and the ability to quantify absolute analyte concentrations. The platform used for the present study was optimized to detect small molecules that preferentially ionize using negative mode electrospray ionization, including intermediary organic acids, purines, pyrimidines, and other compounds. The purpose of this approach was to provide coverage of metabolites not amenable to previously described approaches (8, 9), though limited coverage of the human metabolome remains a limitation of our studies.
In conclusion, the application of a new metabolite profiling technique highlighting intermediary metabolites identified 2-AAA as a novel predictor of the development of diabetes. The relative risk associated with elevated 2-AAA concentrations was not attenuated by adjustment for standard biochemical measures of insulin resistance. This investigation provides motivation to test whether plasma measurements of this molecule might help identify candidates for interventions to reduce diabetes risk and to elucidate the precise molecular pathways by which 2-AAA modulates insulin secretion, glucose homeostasis, and susceptibility to diabetes.
Methods
Study samples
Plasma samples were obtained from 2 cohorts. The discovery analyses were performed on individuals from the FHS Offspring Study, which was initiated in 1971 when 5,124 individuals enrolled into this longitudinal cohort study (24). Samples came from the fifth examination, which occurred between 1991 and 1995. Metabolite profiling was performed on samples from 1,937 attendees who were free of diabetes at baseline (376 propensity-matched cases and controls and 1,561 randomly selected individuals).
The replication analyses were performed in the MDC, a Swedish population-based cohort of 28,449 persons enrolled between 1991 and 1996. From the cohort, 6,103 persons were randomly selected to participate in the MDC Cardiovascular Cohort (25). Fasting plasma samples were obtained from 5,305 subjects in the MDC Cardiovascular Cohort, of whom 564 had prevalent diabetes or cardiovascular disease prior to baseline. Of note, 456 subjects had missing covariate data, leaving 4,285 subjects eligible for analysis. Detailed descriptions of the clinical assessment, diabetes definition, and subject selection have been previously described (8).
Metabolite profiling
We employed a methodology similar to our reported technique for profiling polar plasma metabolites using hydrophilic interaction LC (HILIC) and LC-MS (8), though for this analysis we focused on small molecules preferentially ionized using negative mode electrospray ionization under basic conditions. Data were acquired using an ACQUITY UPLC (Waters) coupled to a 5500 QTRAP triple quadrupole mass spectrometer (AB SCIEX). To develop the method, we determined chromatographic retention times and multiple reaction monitoring (MRM) MS settings for more than 150 reference compounds, of which 70 could be detected in human plasma in the archived FHS samples. Of the 70 metabolites, 41 were detectable in more than 99% of the human samples. Samples were prepared by the addition of 120 μl of extraction solution (80% methanol [VWR] plus the internal standards inosine-15N4, thymine-d4, and glycocholate-d4; Cambridge Isotope Laboratories) to 30 μl of plasma. The samples were centrifuged (10 minutes, 9,000 g, 4°C), and the supernatants were injected directly onto a 150 × 2.0 mm Luna NH2 column (Phenomenex) that was eluted at a flow rate of 400 μl/min with initial conditions of 10% mobile phase A (20 mM ammonium acetate and 20 mM ammonium hydroxide [Sigma-Aldrich] in water [VWR]) and 90% mobile phase B (10 mM ammonium hydroxide in 75:25 vol/vol acetonitrile/methanol [VWR]) followed by a 10-minute linear gradient to 100% mobile phase A. The ion spray voltage was –4.5 kV, and the source temperature was 500°C. Raw data were processed using MultiQuant 1.2 (AB SCIEX). Data were normalized relative to pooled plasma reference samples that were analyzed in the sample queue after sets of 20 study samples.
We performed additional studies with an isotope-labeled reference compound for 2-AAA (d3; C/D/N Isotopes Inc.), the novel biomarker identified. We demonstrated that peak areas were greater than 2 orders of magnitude above the lower limit of quantitation (as defined as a discrete peak 10-fold greater than noise) and fell well within the linear range of the dose-response relationship (representative data are provided in Supplemental Figure 4). We determined the median level for 2-AAA in the FHS control population using these data. No quantitative findings in other human populations are available for comparison.
Animal studies
C57BL/6 male mice (Jackson Laboratories) were housed in separate cages with free access to food and water. Mice were fed an SCD containing 22.5% protein, 52% carbohydrates, 6% fat, 6% ash, and 4% fiber (Prolab Isopro RMH 3000) or an HFD containing 20 kcal% protein, 20 kcal% carbohydrate and 60 kcal% fat (DIO formula, D12492; Research Diets Inc.) as indicated. The total energy equivalent was 3.46 kcal/gm for the SCD and 5.24 kcal/gm for the HFD. For studies testing the role of 2-AAA on glucose homeostasis, 4 independent cohorts of 24 mice entered the study protocol. Two cohorts received the SCD and 2 cohorts received an HFD. Half of the mice assigned to each diet received 2-AAA (500 mg/kg/d equivalent to a starting dose of 12.03 ± 0.30 mM) via the drinking water for up to 5 weeks. Preweighed food and water was administered to each cage. Food and water intake were monitored weekly. Fasting insulin levels in mice were measured by an ELISA kit (Crystal Chem Inc.). After 5 weeks of 2-AAA treatment, and following a 6-hour fast, each group of mice was administered an intraperitoneal glucose tolerance test (IPGTT); 1.5 mg/g of body weight; 75 mg/ml of glucose solution or an ITT; 0.00075 U of insulin/g of body weight, 0.15 U/ml insulin solution (Sigma-Aldrich). For the IPGTT, venous blood samples were obtained from the tail vein immediately prior to glucose injection and then serially at 30, 60, and 120 minutes following the injection. For the ITT, venous blood samples were obtained from the tail vein immediately prior to the insulin injection and then serially at 15, 30, 45, and 60 minutes following the injection.
Upon study completion, tissues were harvested for metabolite profiling analysis. For homogenization of liver and pancreas, 25 mg of tissue sample were mixed with 250 μl of a 50:50 methanol/water solution. For the skeletal muscle, 25 mg of tissue was mixed with 250 μl of HPLC water (J.T. Baker). All tissue samples were then homogenized for 4 minutes at 25 Hz in a TissueLyser II (QIAGEN). 200 μl of the resulting homogenates were extracted following a modified Bligh-Dyer method (17), and the resulting aqueous phase was dried down and reconstituted in methanol containing labeled isotope standards (L-phenylalanine-d8 and L-valine-d8) as performed with the plasma samples.
For the perigonadal adipose tissue, metabolites were first extracted by mixing harvested tissues with 6 μl per 1 mg of adipose tissue of a methanol/chloroform solution (2:1 vol/vol). The extracted adipose tissues were then homogenized for 4 minutes at 25 Hz in a TissueLyser II. The resulting homogenates were mixed with chloroform and water (2 μl per 1 mg of adipose tissue for each solvent) and centrifuged at 10,000 g for 20 minutes at 4°C. The upper aqueous layers were dried down and reconstituted in a methanol solution containing labeled standards (L-phenylalanine-d8 and L-valine-d8), as previously described (26). A calibration curve using 2-AAA d3 (C/D/N Isotopes Inc.) was generated for absolute quantitation of 2-AAA in plasma and tissue samples. LC-MS/MS analyses were then performed using the same methodology as described above for human plasma.
Insulin secretion experiments
BTC6 cells.
These cells are an established model to examine insulin secretion. BTC6 cells were used at passage number 4–7, grown in DMEM (2002-30; ATCC), 15% FBS, with penicillin/streptomycin (100 IU/ml/100 μg/ml). Cells were plated on 24-well collagen plates at 40,000 cells per well and incubated with 2-AAA at varying concentrations ranging from 0 to 100 μM for 0 to 72 hours. On the day of experimentation, the cells were washed with PBS and the medium was changed to DMEM without FBS or glucose to which 0.1% BSA was added. After 1 hour of incubation, this medium was changed to serum-free medium containing 2.5 mM or 5.0 mM glucose, as indicated. Insulin production was measured in the supernatant after 1 additional hour of incubation. To assess the time response relationship, 2-AAA was added to the cells after plating on collagen and incubated for 0.5, 2, 6, and 72 hours.
Murine islets.
We also performed studies in murine islets isolated from male C57BL/6J mice as previously reported (27). Islets were obtained by collagenase digestion of the pancreas, purified by Ficoll density gradient, handpicked, and then cultured for 24 hours. For insulin secretion experiments, 15 islets were placed in each microcentrifuge tube and incubated in islet secretion buffer containing 120 mmol/l NaCl, 5 mmol/l KCl, 1 mmol/l CaCl2, 1.2 mmol/l MgCl2, 24 mmol/l NaHCO3, 10 mmol/l HEPES, and 2.5 mmol/l glucose, bubbled with 95% O2/5% CO2 and supplemented with 0.5% (wt/vol) BSA. Experiments were performed by incubating islets in 1 ml of secretion buffer containing either 2.5 or 11.1 mmol/l glucose in the presence or absence of 30 μM 2-AAA for 6 hours at 37°C, 5% CO2, similar to the conditions for the BTC6 cells. Insulin was assayed using the Meso Scale Discovery Multi-Array Assay System for mouse/rat total insulin. Secretion was normalized to islet insulin content.
Human islets.
Human islets were provided by the Clinical Islet Transplant Program (University of Alberta) and isolated from cadaveric pancreases with appropriate donor consent using similar procedures as described for murine islets. For insulin secretion assays, 25 human islets were placed in each microcentrifuge tube and incubated in islet secretion buffer containing 120 mmol/l NaCl, 5 mmol/l KCl, 1 mmol/l CaCl2, 1.2 mmol/l MgCl2, 24 mmol/l NaHCO3, 10 mmol/l HEPES, and 2.8 mmol/l glucose, bubbled with 95% O2/5% CO2 and supplemented with 0.5% (wt/vol) BSA. Experiments were performed by incubating islets in 1 ml of secretion buffer in the presence or absence of 30 μM 2-AAA containing either 2.5 or 11.1 mmol/l glucose for 1 hour at 37°C, 5% CO2. Insulin was assayed using the Meso Scale Discovery Multi-Array Assay System for human insulin. Secretion was normalized to islet insulin content.
Statistics
For human studies, metabolite concentrations were log transformed to reduce heteroscedasticity of case-control differences. Initially, cases were compared with propensity-matched controls using paired t tests. We considered metabolite findings with a P value of less than 0.01 to take to replication analyses.
We performed conditional (matched pairs) logistic regression analyses relating baseline metabolite values to future diabetes risk. Metabolites were treated as continuous and as categorical variables. We adjusted for age, sex, BMI, and fasting glucose. In additional analyses, we further adjusted for parental history, serum triglycerides, HDL cholesterol, hypertension, intake of dietary protein, amino acids, and total calories. Subgroup analyses were performed in individuals with and without prediabetes, defined as HbA1c 5.7%–6.4% or fasting glucose 100–125 mg/dl; classification of prediabetes status was not related to the case-control designation, which was based solely on whether the participant developed overt diabetes after the baseline examination. A Bonferroni-corrected P value threshold of 7 × 10⁻⁴ (= 0.05/70) was used to denote significance in the pooled analyses. For assessment of model discrimination, we used the C-statistic and NRI, as previously described (11).
We calculated Pearson correlations between metabolite concentrations and other biochemical measures of insulin action: fasting insulin, HOMA-IR and HOMA-B (28). We then assessed whether metabolite concentrations predicted risk incrementally over these other biochemical measures. All analyses in the human cohorts were performed using SAS Statistical Software (version 9.3).
For the animal studies, all data are expressed as means with error bars showing SEM. Comparison of end points was performed using an unpaired 2-tailed Student’s t test. For the time-course studies, 1-way ANOVA with repeated measurements was used. P < 0.05 was considered significant.
For the cell culture studies, the 2-AAA dose response was evaluated by an unpaired 1-way ANOVA using Dunnet’s multiple comparison test to determine the level of significance of individual 2-AAA doses. An unpaired t test using Welch correction for unequal variances was used to compare differences between control versus metabolite treated cells. P < 0.05 was considered significant. All analyses for the animal and cell culture studies were performed using GraphPad Prism (v. 5.02).
Study approval
The human study protocols for metabolite profiling were approved by the Institutional Review Boards of Boston University Medical Center, Massachusetts General Hospital, and Lund University, and all participants provided written informed consent. All animal experiments were approved by the Subcommittee on Research Animal Care at the Massachusetts General Hospital.
Supplementary Material
Acknowledgments
This work was supported by NIH contract NO1-HC-25195, R01-DK-HL081572, the Leducq Foundation, the Canadian Institutes of Health Research, and the American Heart Association. P.E. Light received research funding as the holder of the Dr. Charles A. Allard Chair in Diabetes Research.
Footnotes
Conflict of interest: R.E. Gerszten, R.S. Vasan, M.G. Larson, and T.J. Wang are named as coinventors on a patent application relating to amino acid predictors of diabetes. J.C. Florez has received consulting honoraria from Novartis, Lilly, and Pfizer. P.E. Light has received consulting honoraria from Merck.
Citation for this article: J Clin Invest. 2013;123(10):4309–4317. doi:10.1172/JCI64801.
Thomas J. Wang’s present address is: Division of Cardiovascular Medicine, Vanderbilt University, Nashville, Tennessee, USA.
References
- 1.Pan XR, et al. Effects of diet and exercise in preventing NIDDM in people with impaired glucose tolerance. The Da Qing IGT and Diabetes Study. Diabetes Care. 1997;20(4):537–544. doi: 10.2337/diacare.20.4.537. [DOI] [PubMed] [Google Scholar]
- 2.Tuomilehto J, et al. Prevention of type 2 diabetes mellitus by changes in lifestyle among subjects with impaired glucose tolerance. N Engl J Med. 2001;344(18):1343–1350. doi: 10.1056/NEJM200105033441801. [DOI] [PubMed] [Google Scholar]
- 3.Knowler WC, et al. Reduction in the incidence of type 2 diabetes with lifestyle intervention or metformin. N Engl J Med. 2002;346(6):393–403. doi: 10.1056/NEJMoa012512. [DOI] [PMC free article] [PubMed] [Google Scholar]
- 4.Gerstein HC, et al. Effect of rosiglitazone on the frequency of diabetes in patients with impaired glucose tolerance or impaired fasting glucose: a randomised controlled trial. Lancet. 2006;368(9541):1096–1105. doi: 10.1016/S0140-6736(06)69420-8. [DOI] [PubMed] [Google Scholar]
- 5.Gieger C, et al. Genetics meets metabolomics: a genome-wide association study of metabolite profiles in human serum. PLoS Genet. 2008;4(11):e1000282. doi: 10.1371/journal.pgen.1000282. [DOI] [PMC free article] [PubMed] [Google Scholar]
- 6.Suhre K, et al. Metabolic footprint of diabetes: a multiplatform metabolomics study in an epidemiological setting. PLoS One. 2010;5(11):e13953. doi: 10.1371/journal.pone.0013953. [DOI] [PMC free article] [PubMed] [Google Scholar]
- 7.Suhre K, et al. Human metabolic individuality in biomedical and pharmaceutical research. Nature. 2011;477(7362):54–60. doi: 10.1038/nature10354. [DOI] [PMC free article] [PubMed] [Google Scholar]
- 8.Wang TJ, et al. Metabolite profiles and the risk of developing diabetes. Nat Med. 2011;17(4):448–453. doi: 10.1038/nm.2307. [DOI] [PMC free article] [PubMed] [Google Scholar]
- 9.Rhee EP, et al. Lipid profiling identifies a triacylglycerol signature of insulin resistance and improves diabetes prediction in humans. J Clin Invest. 2011;121(4):1402–1411. doi: 10.1172/JCI44442. [DOI] [PMC free article] [PubMed] [Google Scholar]
- 10.Rimm EB, Giovannucci EL, Stampfer MJ, Colditz GA, Litin LB, Willett WC. Reproducibility and validity of an expanded self-administered semiquantitative food frequency questionnaire among male health professionals. Am J Epidemiol. 1992;135(10):1114–1126. doi: 10.1093/oxfordjournals.aje.a116211. [DOI] [PubMed] [Google Scholar]
- 11.Pencina MJ, D’Agostino RB, D’Agostino RB, Vasan RS. Evaluating the added predictive ability of a new marker: from area under the ROC curve to reclassification and beyond. Stat Med. 2008;27(2):157–172. doi: 10.1002/sim.2929. [DOI] [PubMed] [Google Scholar]
- 12.Requena JR, Chao CC, Levine RL, Stadtman ER. Glutamic and aminoadipic semialdehydes are the main carbonyl products of metal-catalyzed oxidation of proteins. Proc Natl Acad Sci U S A. 2001;98(1):69–74. doi: 10.1073/pnas.98.1.69. [DOI] [PMC free article] [PubMed] [Google Scholar]
- 13.Fan X, et al. Mechanism of lysine oxidation in human lens crystallins during aging and in diabetes. J Biol Chem. 2009;284(50):34618–34627. doi: 10.1074/jbc.M109.032094. [DOI] [PMC free article] [PubMed] [Google Scholar]
- 14.Sell DR, Strauch CM, Shen W, Monnier VM. 2-aminoadipic acid is a marker of protein carbonyl oxidation in the aging human skin: effects of diabetes, renal failure and sepsis. Biochem J. 2007;404(2):269–277. doi: 10.1042/BJ20061645. [DOI] [PMC free article] [PubMed] [Google Scholar]
- 15.Tsutsui H, et al. Practical analytical approach for the identification of biomarker candidates in prediabetic state based upon metabonomic study by ultraperformance liquid chromatography coupled to electrospray ionization time-of-flight mass spectrometry. J Proteome Res. 2010;9(8):3912–3922. doi: 10.1021/pr100121k. [DOI] [PubMed] [Google Scholar]
- 16.Wijekoon EP, Skinner C, Brosnan ME, Brosnan JT. Amino acid metabolism in the Zucker diabetic fatty rat: effects of insulin resistance and of type 2 diabetes. Can J Physiol Pharmacol. 2004;82(7):506–514. doi: 10.1139/y04-067. [DOI] [PubMed] [Google Scholar]
- 17.Weyer C, Bogardus C, Mott DM, Pratley RE. The natural history of insulin secretory dysfunction and insulin resistance in the pathogenesis of type 2 diabetes mellitus. J Clin Invest. 1999;104(6):787–794. doi: 10.1172/JCI7231. [DOI] [PMC free article] [PubMed] [Google Scholar]
- 18.Felig P, Marliss E, Cahill GF. Plasma amino acid levels and insulin secretion in obesity. N Engl J Med. 1969;281(15):811–816. doi: 10.1056/NEJM196910092811503. [DOI] [PubMed] [Google Scholar]
- 19.Wahren J, Felig P, Cerasi E, Luft R. Splanchnic and peripheral glucose and amino acid metabolism in diabetes mellitus. J Clin Invest. 1972;51(7):1870–1878. doi: 10.1172/JCI106989. [DOI] [PMC free article] [PubMed] [Google Scholar]
- 20.Wahren J, Felig P, Hagenfeldt L. Effect of protein ingestion on splanchnic and leg metabolism in normal man and in patients with diabetes mellitus. J Clin Invest. 1976;57(4):987–999. doi: 10.1172/JCI108375. [DOI] [PMC free article] [PubMed] [Google Scholar]
- 21.Liu Z, Jeppesen PB, Gregersen S, Chen X, Hermansen K. Dose- and glucose-dependent effects of amino acids on insulin secretion from isolated mouse islets and clonal INS-1E β-cells. Rev Diabet Stud. 2008;5(4):232–244. doi: 10.1900/RDS.2008.5.232. [DOI] [PMC free article] [PubMed] [Google Scholar]
- 22.Um SH, D’Alessio D, Thomas G. Nutrient overload, insulin resistance, and ribosomal protein S6 kinase 1, S6K1. Cell Metab. 2006;3(6):393–402. doi: 10.1016/j.cmet.2006.05.003. [DOI] [PubMed] [Google Scholar]
- 23.Newgard CB, et al. A branched-chain amino acid-related metabolic signature that differentiates obese and lean humans and contributes to insulin resistance. Cell Metab. 2009;9(4):311–326. doi: 10.1016/j.cmet.2009.02.002. [DOI] [PMC free article] [PubMed] [Google Scholar]
- 24.Kannel WB, Feinleib M, McNamara PM, Garrison RJ, Castelli WP. An investigation of coronary heart disease in families. The Framingham offspring study. Am J Epidemiol. 1979;110(3):281–290. doi: 10.1093/oxfordjournals.aje.a112813. [DOI] [PubMed] [Google Scholar]
- 25.Persson M, Hedblad B, Nelson JJ, Berglund G. Elevated Lp-PLA2 levels add prognostic information to the metabolic syndrome on incidence of cardiovascular events among middle-aged nondiabetic subjects. Arterioscler Thromb Vasc Biol. 2007;27(6):1411–1416. doi: 10.1161/ATVBAHA.107.142679. [DOI] [PubMed] [Google Scholar]
- 26.Roberts LD, Souza AL, Gerszten RE, Clish CB. Targeted metabolomics. Curr Protoc Mol Biol. 2012;Chapter 30:Unit 30.2.1–30.2.24. doi: 10.1002/0471142727.mb3002s98. [DOI] [PMC free article] [PubMed] [Google Scholar]
- 27.Hamming KS, et al. Inhibition of beta-cell sodium-calcium exchange enhances glucose-dependent elevations in cytoplasmic calcium and insulin secretion. Diabetes. 2010;59(7):1686–1693. doi: 10.2337/db09-0630. [DOI] [PMC free article] [PubMed] [Google Scholar]
- 28.Matthews DR, Hosker JP, Rudenski AS, Naylor BA, Treacher DF, Turner RC. Homeostasis model assessment: insulinresistance and beta cellfunctionfromfasting plasma glucose and insulin concentrations in man. Diabetologia. 1985;28(7):412–419. doi: 10.1007/BF00280883. [DOI] [PubMed] [Google Scholar]
Associated Data
This section collects any data citations, data availability statements, or supplementary materials included in this article.


