

Abstract
Squamous cell carcinomas (SCCs) originate in stratified epithelia, with a small subset becoming metastatic. Epithelial stem cells are targets for driver mutations that give rise to SCCs, but it is unknown whether they contribute to oncogenic multipotency and metastasis. We developed a mouse model of SCC by targeting two frequent genetic mutations in human SCCs, oncogene KrasG12D activation and Smad4 deletion, to mouse keratin 15–expressing (K15+) stem cells. We show that transgenic mice developed multilineage tumors, including metastatic SCCs. Among cancer stem cell–enriched (CSC-enriched) populations, those with increased side population (SP) cells correlated with epithelial-mesenchymal transition (EMT) and lung metastasis. We show that microRNA-9 (miR-9) contributed to SP expansion and metastasis, and miR-9 inhibition reduced the number of SP cells and metastasis. Increased miR-9 was detected in metastatic human primary SCCs and SCC metastases, and miR-9–transduced human SCC cells exhibited increased invasion. We identified α-catenin as a predominant miR-9 target. Increased miR-9 in human SCC metastases correlated with α-catenin loss but not E-cadherin loss. Our results demonstrate that stem cells with KrasG12D activation and Smad4 depletion can produce tumors that are multipotent and susceptible to EMT and metastasis. Additionally, tumor initiation and metastatic properties of CSCs can be uncoupled, with miR-9 regulating the expansion of metastatic CSCs.
Introduction
Squamous cell carcinomas (SCCs) are derived from stratified epithelia present within the skin and oral cavity. A subset of aggressive SCCs become metastatic and lead to metastasis-associated death. The rate of metastasis in skin SCCs ranges from 0.1% to 10% (1), with poorly differentiated tumors and those with greater vertical tumor thickness having an increased risk of metastasis (2). Genetic alterations and intrinsic tumor cell properties controlling SCC metastasis are largely unknown. Genetically engineered mice provide a powerful tool for dissecting driver mutations that contribute to SCC initiation and metastasis. To date, very few genetic mutations causing spontaneous SCC formation and metastasis have been found, particularly metastasis to the lung, which is the leading cause of SCC-associated death (3). Mice with a Smad4 deletion in stratified epithelia develop spontaneous SCCs in the skin, oral cavity, and forestomach (4–6). Among these models, oral SCCs metastasize to lymph nodes (4), whereas skin and forestomach SCCs do not metastasize (5, 6).
Because stratified epithelia undergo constant self-renewal and rapid turnover, it is believed that driver mutations for SCCs must initially occur in resident stem cells that renew these epithelia throughout life. In mouse skin, the hair follicle bulge harbors keratin 15–positive (K15+) multipotent stem cells, which normally renew hair follicles and sebaceous glands, but can also transiently give rise to epidermal keratinocytes after injury (7, 8). The K15+ cells also reside in the deeper part of the rete in tongue papillae in humans and mice, which are believed to be in a niche similar to the hair follicle bulge (9). In humans, SCCs arising from hair follicles, i.e., follicular SCCs (FSCCs), account for 1.2% of all primary human SCCs, and stem cells within the bulge region of the hair follicles are suspected of being the cell of origin for FSCCs (10). However, it is not technically feasible to perform lineage-tracing experiments to prove that human FSCCs arise from hair follicle bulge stem cells. Lineage-tracing experiments have been performed in mice, and they demonstrate that K15+ stem cells can give rise to progeny that express keratins 5 and 14 (K5 and K14) and other differentiation markers (11, 12). Therefore, once genetic mutations occur in K15+ cells, they will be permanently altered in K15-expressing stem cells and all of their differentiated progeny. For instance, K15+ bulge stem cells can respond to chemical carcinogens and induce SCCs in the skin (13). In addition, activation of a KrasG12D mutant and deletion of p53 in K15+ cells causes the formation of SCCs (14, 15), whereas Ptch deletion in K15+ cells results in basal cell carcinoma (BCC) formation, a tumor type representing a hair follicle lineage (16). These studies suggest that normal stem cells, once mutated, can be converted to cancer stem cells (CSCs). However, since the tumors that developed in these models are lineage committed (SCCs or BCCs in each model), it remains to be determined whether stem cells lose their capacity for multipotency during carcinogenesis.
In addition to converting normal stem cells to CSCs, certain tumor cells may acquire stem cell properties, causing them to behave as CSCs (17). Dedifferentiation and epithelial-mesenchymal transition (EMT) play important roles in acquiring “stemness” (18). Normal stem cell markers have been used to sort CSC-enriched populations. For example, CD34, a marker of normal epithelial stem cells (19), was used to sort CD34hi tumor–initiating populations in DMBA/TPA-induced SCCs (20). However, these normal stem cell markers may not be present on CSC populations arising as a result of dedifferentiation and EMT. For this reason, the side population (SP), a functional sorting method that relies on the ability of stem cells to efflux Hoechst dye (21–23), has been used to identify CSCs independently of tissue and cell types (24). It is not known, however, whether CSCs behave similarly in tumor initiation and metastasis.
In the current study, we sought to determine: (a) whether targeting Smad4 deletion alone or in combination with KrasG12D activation, two mutations commonly occurring in human SCCs (25, 26), to K15+ stem cells will initiate multilineage tumors; and (b) whether CSCs contribute to SCC metastasis, and if so, what the associated molecular mechanism might be. We describe a novel mouse model for aggressive SCC lung metastasis that reveals roles for KrasG12D and Smad4 deletion in stem cell multipotency and metastasis. From this model, we identify two distinct CSC populations and show that only the SP is associated with metastasis. We also provide evidence that miR-9 contributes to metastatic CSC expansion and SCC metastasis.
Results
Targeting KrasG12D and Smad4–/– to bulge stem cells causes metastatic SCCs with multilineage histotypes.
To determine whether K15+ cells in human skin harbor UV signature DNA damage and thus possess the potential to give rise to SCCs, we stained human skin biopsies to detect cyclobutane pyrimidine dimers (CPDs), a UV-induced DNA damage marker (27), and pH2AX, a marker for DNA double-strand breaks (28). Two patient skin biopsies were taken 24 hours after UV exposure to an ultralite phototherapy chamber source (311-nm narrow-band UVB phototherapy lamp, 0.4 J/cm2). Cells with CPD and pH2AX foci were detected in the epidermis and, to a lesser extent, in the hair follicles including both bulge cells (confirmed by K15 counterstaining) (Supplemental Figure 1; supplemental material available online with this article; doi: 10.1172/JCI65856DS1) and CD200 staining in consecutive sections (not shown) and nonbulge follicle cells (Supplemental Figure 1). We also examined biopsies of actinic keratoses (AK), which are precursor lesions of SCCs, for the presence of CPD and pH2AX foci. Consistent with a previous report that most CPDs are repaired following acute UV-induced DNA damage (27), there were significantly fewer epidermal CPD-positive cells in the AK lesions than in acute UV-treated skin. However, scattered CPD-positive cells were identified in 3 of 7 AK samples, including both K15+ and K15– cells in hair follicles adjacent to the AKs (Supplemental Figure 1). pH2AX-positive cells were also detected in bulge cells in 6 of 7 AK samples, albeit to a lesser degree than in the interfollicular epidermis (Supplemental Figure 1). These data confirm that K15+ cells within the hair follicle bulge region are subjected to UV-induced DNA damage.
To determine the consequences of targeting mutations frequently found in human SCCs to bulge stem cells, we crossbred K15.CrePR1 mice (29) with LSL-KrasG12D mice (12) and Smad4 floxed mice (Smad4f/f) (5). Upon topical application of RU486 to the back skin of 3-week-old mice for 5 days, CrePR1 caused activation of the heterozygous KrasG12D knockin allele and homozygous deletion of the Smad4 floxed alleles in K15+ cells (hereafter referred to as K15.KrasG12D.Smad4–/–) (Supplemental Figure 2). The floxed Smad4 allele and KrasG12D mutants were detected by PCR genotyping, as we previously described (4, 30). Similarly to previous reports (14, 31), K15.KrasG12D littermates developed benign papillomas without progressing to malignancy (Figure 1A). K15.Smad4–/– littermates initially developed a hair loss phenotype with degenerated hair follicles and enlarged sebaceous glands, similar to MMTV.Smad4–/– or K5.Smad4–/– mice as previously reported (5, 32), but did not develop spontaneous skin tumors for up to 1 year (data not shown), suggesting that Smad4 inactivation does not activate ras signaling the same way as the KrasG12D mutant. This is also in sharp contrast to Smad4–/– spontaneous SCCs that develop around 6 to 8 months when Cre is driven by a K14, K5, or MMTV promoter (4–6). Since these latter promoters target Smad4 deletion in stem cells and nonstem cells in both the hair follicle and interfollicular epidermis, the data suggest that tumor initiation requires the deletion of Smad4 in cells that divide frequently, rather than in more quiescent bulge stem cells (8, 33). The K15.KrasG12D.Smad4–/– mice, however, rapidly developed skin tumors beginning 1 month after induction of Cre-mediated recombination with 100% penetrance. The number of tumors developing on each K15.KrasG12D.Smad4–/– mouse varied widely (ranging from one to multiple tumors per mouse), presumably depending on the efficiency of Cre induction and Cre-mediated recombination. By 18 weeks of age, all mice were euthanized due to aggressive tumor growth. Histological analyses revealed that all mice developed well-to-moderately differentiated SCCs (Figure 1A), a tumor type representing an epidermal lineage, or basaloid SCCs (BSCCs) (Figure 1A), a rare aggressive skin tumor type of unknown stem cell origin (34). In contrast, murine skin carcinogenesis models in which primary tumors rarely metastasize, 28% (5 of 18) of K15.KrasG12D.Smad4–/– tumor-bearing mice developed lung metastasis (Figure 1, C and E), however, only 1 of 18 mice developed lymph node metastasis (not shown). Metastases developed between 8 and 18 weeks after the two mutations were induced. Lung metastases were from SCCs or BSCCs, with morphologies similar to those of their primary tumors (Figure 1C). Interestingly, K15.KrasG12D.Smad4–/– mice had very few benign papillomas, an epidermal lineage tumor type frequently found in murine skin cancer models. Instead, SCC precursor lesions showed squamous dysplasia (Figure 1B) similar to human precursor lesions for SCC (3). Additionally, a subset of benign or locally invasive tumors formed adjacent to these SCC precursor lesions, which were of hair follicle (trichoepitheliomas, BCCs) or sebaceous gland origin (sebaceous adenomas) (Figure 1B), suggesting that cells giving rise to these tumors retain the ability to generate multilineage tumors. Smad4 loss was confirmed by comparing Smad4 levels between K15.KrasG12D.Smad4–/– tumors and K15.KrasG12D papillomas using quantitative real-time PCR (qRT-PCR) at the mRNA level and immunohistochemistry (IHC) at the protein level (Supplemental Figure 2), indicating that K15 promoter–targeted cells and their progeny had lost Smad4.
Figure 1. Primary and passaged tumor types in K15.KrasG12D.Smad4–/– mice.

(A) H&E staining of representative K15.KrasG12D papilloma and K15.KrasG12D.Smad4–/– SCC, BSCC, and SCC lung metastases. Scale bar: 100 μm. (B) H&E staining of representative benign tumor types from K15.KrasG12D.Smad4–/– mice. From left to right: dysplasia, sebaceous adenoma (SA), trichoepithelioma, and BCC. Scale bar: 50 μm for dysplasia and 100 μm for the rest of the panels. (C) Examples of dedifferentiation in passaged tumors (middle panels) and metastasis (right panels) that developed from parental SCCs (left panels). Scale bar: 100 μm. (D) Quantification of tumor histology in primary (n = 40) and passaged (n = 23) tumors. *P < 0.001 for well-differentiated tumors; **P = 0.004 for poorly-differentiated tumors; ***P = 0.003 for SPCCs. (E) Percentage of tumor-bearing mice with lung metastasis from mice (n = 18) carrying primary tumors and mice (n = 15) carrying passaged tumors. Significance was calculated using Fisher’s exact test; *P < 0.001.
K15.KrasG12D.Smad4–/– SCCs undergo dedifferentiation and EMT and become more metastatic after tumor passage.
Next, we sought to determine whether CSCs residing within K15.KrasG12D.Smad4–/– tumors retain the ability to give rise to multilineage tumors following serial passage. We subcutaneously transplanted (passaged) primary tumors (~3 mm3/piece) into the flank skin of immune-compromised athymic nude mice. Among all passaged tumors (from passage one up to passage seven), we identified SCCs and BSCCs, but no BCCs or benign tumors from hair follicles and sebaceous glands. These data suggest that CSCs in SCCs still possess the ability to give rise to certain multilineage tumors, but cannot revert back to form benign tumors, such as trichoepitheliomas, sebaceous adenomas, or locally invasive tumors such as BCCs. Surprisingly, in contrast to a previous study reporting that transplanted SCCs retain a morphology similar to that of primary tumors (35), K15.KrasG12D.Smad4–/– passaged tumors exhibited a significant increase in poorly differentiated SCCs and EMT-type spindle cell carcinomas (SPCCs) (Figure 1, C and D) and a corresponding increase in lung metastasis to 80% after the first passage (Figure 1, C and E, P < 0.001). Immunostaining showed that K15.KrasG12D papillomas and most K15.KrasG12D.Smad4–/– primary SCCs retained E-cadherin and α-catenin, whereas K15.KrasG12D.Smad4–/– passaged tumors lost E-cadherin and α-catenin, but gained N-cadherin and vimentin (Supplemental Figure 3 and Supplemental Table 1). In parallel with the above studies, we transplanted primary UV-induced SCCs from K14.Smad4–/– mice. We found that UV-induced SCCs did not exhibit morphological changes similar to those in the transplanted K15.KrasG12D.Smad4–/– SCCs, nor did they develop lung metastasis (data not shown), suggesting that the increase in EMT and metastasis in passaged tumors is unique to tumors that develop from K15.KrasG12D.Smad4–/– cells.
K15.KrasG12D.Smad4–/– SCCs retained CSC populations, but metastasis is correlated with a subset of the CSC-rich population.
Because KrasG12D and Smad4–/– were initially only targeted to K15+ stem cells, we assessed whether K15.KrasG12D.Smad4–/– tumors that were derived from these cells still retained K15 expression, which would suggest a direct expansion of K15+ mutant stem cells. We immunostained for K15, which revealed that K15+ cells were present as small populations within K15.KrasG12D papillomas (Supplemental Figure 2D) and K15.KrasG12D.Smad4–/– SCCs (Figure 2A). We did not find K15+ cells within the differentiated keratin K1+ cells (Supplemental Figure 2D and Figure 2A), but most of the K15+ cells stained positive for PCNA. (Supplemental Figure 2D and Figure 2A). These data indicate that once Cre is activated, KrasG12D and Smad4–/– are permanently altered in K15+ cells, which unlike normal quiescent K15+ cells, become proliferative. In addition, the differentiated progeny of K15+ cells (K1+ cells) downregulate K15 expression.
Figure 2. K15.KrasG12D.Smad4–/– SCCs contained CSC-rich populations.

(A) Immunofluorescence staining of K15.KrasG12D.Smad4–/– tumors shows nests of K15+ cells within K14-expressing tumor cells. Middle panel: K15+ (green) cells are largely overlapping with proliferating PCNA+ cells (red). Bottom panel: K15+ (green) cells are distinct from differentiated K1-expressing keratinocytes (red). Scale bar: 50 μm. (B) Flow cytometry of the Hoechst dye–effluxing SP. SP cells are gated as those cells that are negative for Hoechst dye (left panel). Verapamil blocks the ABC transporter, eradicating the SP+ cells (right panel). (C) The non-SP cells were further sorted for the CD34+/CD49f+ population and a population negative for CSC cells (non-SP/CD34–/CD49f–). (D) Grafting of 10,000 SP+ cells formed tumors 3 weeks later, while 10,000 non-SP/CD34–/CD49f– cells did not form tumors. (E) Grafting of 10,000 CD34+/CD49f+ cells also formed tumors 3 weeks later. (F) A tumor derived from sorted SP cells (B and D) gave rise to both SP+ cells and CD34+/CD49+ populations. (G) A tumor derived from sorted CD34+/CD49+ cells (C and E) gave rise to both SP+ cells and CD34+/CD49+ populations.
Previous studies have shown that the ability of cultured cell lines to undergo EMT increased their tumor initiation properties (18) and that CSCs were more invasive than non-CSCs (24, 36). Since passaged K15.KrasG12D.Smad4–/– tumors exhibited EMT and became more metastatic, we wanted to determine whether the CSC population increased during passaging and whether the ability to initiate tumor formation was restricted to a subset of cells or was gained by all tumor cells. We used FACS to sort passaged K15.KrasG12D.Smad4–/– SCC tumor cells to identify the Hoechst dye–excluding SP (21–23) as well as cells expressing the cell surface markers CD34 and CD49f, which can be detected in bulge stem cells and SCC CSCs (20). Leukocytes (CD45+) and endothelial (CD31+) cells were removed from single-cell suspensions prior to sorting for tumor epithelial cells. Verapamil, a drug that blocks ABC transporters, thereby preventing Hoechst dye efflux, was used as a control to confirm that the SP+ cells arose as a result of dye efflux (Figure 2B). SP– cells were sorted with CD34 and CD49f antibodies (Figure 2C). We also sorted the SP+ cells for CD34 and CD49f expression, however, no CD34+/CD49f+ cells were identified within the SP+ cells (Supplemental Figure 4), demonstrating that these two CSC populations are distinct. We grafted 1,000–10,000 cells from each tumor cell population (SP+, SP–/CD34+/CD49f+, or SP–/CD34–/CD49f–) together with 106 normal keratinocytes and 106 fibroblasts using a silicon tissue reconstitution chamber inserted underneath the skin of athymic mice as previously described (37). SP+ cells (Figure 2D) or SP–/CD34+/CD49f+ cells (Figure 2E), but not SP–/CD34–/CD49f– cells (Figure 2D), formed tumors 3 weeks after grafting. These data show that K15.KrasG12D.Smad4–/– SCCs retained at least two independent CSC populations, even after dedifferentiation and EMT. Tumors that developed from each of these two populations gave rise to both CSC populations (Figure 2, F and G), demonstrating the plasticity of each of these CSC populations.
Overall, we found that less differentiated, passaged tumors had an increase in the percentage of SP+ cells compared with primary tumors; however, the percentage of CD34+/CD49+ cells was not increased (Supplemental Figure 4). In particular, there was a dramatic increase in SP size in tumors with SPCC histology compared with SP sizes in SCCs of lower histological grades (Supplemental Figure 4). These data suggest that an increase in the number of SP cells contributes to the dedifferentiation/EMT morphology, but not all cells that undergo EMT are SP cells.
To determine whether the two CSC populations have a similar role in tumor metastasis, we sorted SP+ and SP–/CD34+/CD49f+ populations in tumors arising from primary (n = 11) and passaged (n = 15) tumors and compared CSC population sizes in tumors with or without lung metastasis. We found a significant increase in the SP size in tumors that gave rise to metastases, regardless of tumor source (P = 0.009, Figure 3A). In contrast, no significant difference in the SP–/CD34+/CD49f+ population was observed in tumors that gave rise to metastatic versus nonmetastatic lesions (P = 0.74, Figure 3B). These data suggest that between the two CSC populations, EMT and metastasis were only associated with SP+ cells, indicating that tumor initiation and metastasis can be uncoupled.
Figure 3. Increased SP cells, not CD34+/CD49f+ cells, in K15.KrasG12D.Smad4–/– SCCs correlate with metastasis, and SP cells in passaged K15.KrasG12D.Smad4–/– SCCs exhibit increased expression levels of miR-9 and Abcb1a.

(A) Analysis of the SP size (percentage of viable cells sorted) in metastatic (n = 15) and nonmetastatic (n = 9) tumors. Diamonds indicate SP sizes of individual tumors and bars represent averages. *P = 0.009 compared with SP sizes in nonmetastatic SCCs. (B) Analysis of the CD34+/CD49f+ population size (percentage of viable cells sorted) in metastatic (n = 15) and nonmetastatic (n = 9) tumors. No significant difference was seen. (C) Increased miR-9 expression correlates with an increase in SP+ cells in passaged tumors (assayed by qRT-PCR). Expression values are displayed as normalized miR-9 cycle threshold values raised to the –1 power (nCt–1). Black diamonds represent miR-9 expression in individual tumor SP+ cells, and gray bars represent the average miR-9 expression within each group. *P = 0.002 compared with the primary SP. (D) miR-9 expression levels correlate with the SP sizes of tumors. Significance was determined by calculating the correlation coefficient (R2 = 0.87). (E) Increased Abcb1a expression in SP+ cells of passaged tumors (n = 8). *P = 0.03 compared with the primary SP. (F) IHC showing an increase in clustered MDR1+ cells in a passaged SCC compared with sporadic MDR1+ cells in a primary SCC. Scale bars: 50 μm (upper panels), 16 μm (lower panels).
miR-9 contributes to SP expansion and SCC metastasis.
Our observations that SP cells, but not CD34+/CD49f+ cells, were associated with metastasis prompted us to search for potential molecular markers in the metastatic CSC pool. We used TaqMan microRNA arrays to screen microRNA expression in the two distinct CSC populations isolated from the primary and passaged tumors. MicroRNAs -9, -132, and -199a-3p were enriched in passaged SP cells compared with SP cells in primary tumors, but not in passaged CD34+/CD49f+ cells (Supplemental Figure 5). Validation of the above screening in additional samples identified miR-9, a neuronal microRNA barely detectable in normal keratinocytes (38), as more highly overexpressed in SP cells of passaged tumors compared with SP cells in primary in K15.KrasG12D.Smad4–/– tumors (P = 0.002, Figure 3C). Further, expression levels of miR-9 correlated with an increased SP size (Figure 3D). These data suggest that increased miR-9 contributes to both SP expansion and the metastatic properties of SP cells in passaged tumors.
The SP phenotype is due to the presence of ABC transporters on the cell surface (39). To determine which of these transporters are responsible for the increased SP size in passaged tumors, we examined the gene expression levels of three main transporters, Abcg2 (BCRP), Abcc1 (MRP), and Abcb1a (MDR1). Among these, Abcb1a was significantly increased in SP cells from passaged tumors compared with SP cells from primary tumors (Figure 3E). Immunostaining identified sporadic MDR1+ cells in primary SCCs, which were increased in passaged SCCs (Figure 3F).
To ascertain whether miR-9 plays a causal role in K15.KrasG12D.Smad4–/– SCC metastasis, we generated a number of cell lines from K15.KrasG12D.Smad4–/– tumors with varying levels of miR-9 expression (Supplemental Figure 6). We stably transfected an miR-9-1 pre-microRNA (System Bioscience) into B911 cells, a line with low intrinsic miR-9 expression, to overexpress miR-9 and, conversely, we used an “miRZip” (System Bioscience) anti-miR (Zip-9) to knock down miR-9 in B931 cells, a line with higher intrinsic miR-9 expression. To determine whether miR-9 has effects in human SCCs similar to those observed in mouse SCCs, we also transfected lentiviral vectors encoding miR-9-1 pre-microRNA into FaDu and Cal27 cell lines, both of which are human head and neck SCC lines with a genetic loss of Smad4 (4). After confirming changes in miR-9 expression and activity in the cell lines after transfection (Supplemental Figure 6), we examined the lines for changes in cell behavior after manipulation of miR-9 expression. The examination of abnormal centrosome numbers, which serve as a sensitive marker for genomic instability in SCCs (40), revealed that although a large percentage of cells with abnormal centrosomes existed in K15.KrasG12D.Smad4–/– primary SCCs, they were not significantly different between SP cells and non-SP cells and were not altered by miR-9 overexpression or knockdown (not shown). These data suggest that non-SP cells inherit genomic instability from SP cells and that miR-9 does not directly affect genomic instability. Since miR-9 was highly expressed in aggressive tumors, we examined whether miR-9 affects tumor cell growth. Surprisingly, overexpression of miR-9 in the B911 line (B911-miR-9) slowed tumor cell growth in vitro compared with GFP-transduced controls (Supplemental Figure 7). Cell cycle analysis showed that the percentage of cells in the S phase was reduced by miR-9 overexpression but increased after knocking down miR-9 (Supplemental Figure 7), indicating that miR-9 inhibits cell cycle progression.
Next, we examined whether miR-9 overexpression directly promotes invasion using Matrigel-coated Transwell tissue culture plate assays. B911-miR-9, FaDu-miR-9, and Cal27-miR-9 cells showed significantly increased invasion compared with GFP controls (Figure 4A and Supplemental Figure 6). Conversely, B931-Zip-9 cells showed a significant reduction in invasive cell numbers compared with B931-GFP control cells (Figure 4B). We then transplanted 1,000–2,500 B911 or B931 cells into flank skin and 150,000 FaDu cells into the floor of the mouths (orthotopically) of nude mice and analyzed tumor morphology and metastasis. Even though miR-9 showed growth inhibition in vitro (Supplemental Figure 6), the rates of tumor formation from cells with miR-9 transfection or knockdown did not significantly differ from the parental cell lines (Supplemental Figure 7), suggesting that the microenvironment affects in vivo tumor growth. While both B911-GFP and B911-miR-9 cells developed SCCs with loss of E-cadherin and increased N-cadherin (Supplemental Figure 8) and developed lung metastasis (not shown), morphological changes consistent with progression from poorly differentiated SCCs to SPCCs were only correlated with increased miR-9 expression (Supplemental Figure 8). FaDu-GFP tumors exhibited histological features typical of moderately differentiated SCCs with membrane-associated E-cadherin and α-catenin (Figure 4C). Interestingly, FaDu-miR-9 tumors did not exhibit a significant loss of E-cadherin, a previously reported miR-9 target (41); instead, they showed a loss of α-catenin and a gain of N-cadherin in tumor epithelial cells (Figure 4C). While both FaDu-GFP and FaDu-miR-9 tumors had metastasized to lymph nodes 6 weeks after transplantation, metastases from FaDu-miR-9 tumors were more spread out and exhibited more EMT-like morphology than metastases from FaDu-GFP tumors (Figure 4D). Tumors derived from B931-GFP cells, which express high levels of miR-9 (Supplemental Figure 6), showed an SPCC histology (Supplemental Figure 8). Although knockdown of miR-9 in B931-Zip-9 tumors did not restore E-cadherin (Supplemental Figure 9), it shifted the tumor histology to a more epithelial morphology (Supplemental Figure 8). Further, B931-GFP tumors were the most aggressive tumors, capable of metastasizing to the lung and chest wall (Figure 4, E and F), and knockdown of miR-9 in the B931-Zip-9 tumors showed a significant reduction in metastasis (Figure 4, E and F).
Figure 4. miR-9 promotes invasion and metastasis in mouse and human SCC cells.

(A) Increased invasion in FaDu-miR-9 cells compared with FaDu-GFP cells (*P = 0.005). (B) Reduced invasion in B931-Zip-9 cells compared with B931-GFP control cells (*P = 0.005). All invasion assays were performed in triplicate. (C) Immunofluorescence of membrane-associated E-cadherin and α-catenin in tumors derived from FaDu cells transduced with GFP or miR-9. K14 was used to counterstain. Scale bar: 30 μm. (D) H&E staining showing a representative metastasis derived from FaDu-GFP cells exhibiting clustered epithelial cell morphology, whereas a metastasis from FaDu-miR-9 cells displayed poorly differentiated and EMT morphology (more obvious in the magnified panels). Scale bars: 50 μm (upper panels), 8 μm (lower panels). (E) Quantification of metastases showed reduced numbers of metastases in B931-Zip-9 mice (n = 5) compared with B931-GFP control mice (n = 6). *P = 0.04 for both chest wall and lung metastases. Metastases were identified grossly and confirmed by H&E staining. (F) Examples of multiple metastases in the chest wall and lung developed from a B931-GFP mouse compared with a single chest wall metastasis in a B931-Zip-9 mouse. Arrowheads point to metastases in the thoracic cavity.
To determine whether miR-9 overexpression contributes to SP expansion, we performed SP sorting on the above tumors. The SP size was increased by more than 10-fold in B911-miR-9 tumors compared with B911-GFP tumors (Figure 5A and Supplemental Figure 10). Conversely, SP size in B931-Zip-9 tumors showed more than a 10-fold reduction compared with B931-GFP tumors (Figure 5B and Supplemental Figure 10). Immunostaining revealed an increase in MDR1 protein in B911-miR-9 tumors compared with B911-GFP tumors (Figure 5C) and a significant reduction in B931-Zip-9 tumors compared with B931-GFP tumors (Figure 5D). MDR1-positive cells were also significantly increased in FaDu-miR-9 metastatic lesions compared with FaDu-GFP metastatic lesions (Figure 5D).
Figure 5. SP expansion is caused by miR-9 overexpression and can be targeted to reduce metastasis by combined treatment with verapamil and chemotherapy.

(A) Increased SP sizes in tumors derived from B911-miR-9 cells compared with tumors derived from B911-GFP control cells (n = 3; *P = 0.003). (B) Decreased SP cell sizes in tumors derived from B931-Zip-9 cells compared with tumors derived from B931-GFP control cells (n = 4; *P = 0.007). (C–E) MDR1 IHC. (C) MDR1 staining was increased in B911-miR-9 tumors compared with B911-GFP tumors and decreased in B931-Zip-9 tumors compared with B931-GFP tumors. (D) Sparse MDR1 staining was found in metastases from FaDu-GFP cells, but dramatically increased metastases were derived from FaDu-miR-9 cells. Scale bar: 50 μm in C and D. (E) Treatment of tumor-bearing mice with a combination of docetaxel and verapamil significantly reduced lung metastasis from tumors generated by B931 cells compared with either vehicle control or docetaxel or verapamil alone. *P = 0.03 compared with control.
Previous studies have shown that SP cells in SCCs are chemoresistant (24). If SP cells are also linked to metastasis, reducing or attenuating the properties of this population may reduce metastasis. It is difficult to test this scenario in human SCCs, as the majority of these tumors have very few SP cells and thus do not proceed to metastasis. Therefore, we xenografted B931 and B911 cells and treated these tumor-bearing mice with docetaxel alone or in combination with verapamil to block the activity of the ABC transporters in SP cells. While docetaxel alone did not reduce lung metastases, there was a significant reduction in lung metastasis when mice were treated with the combination of docetaxel and verapamil (Figure 5E and Supplemental Figure 10).
miR-9–positive cell numbers are increased in metastatic human primary SCCs and SCC metastases.
It has been reported that miR-9 is frequently methylated in human cancers, including SCCs, and as such, miR-9 has been suggested to be a tumor suppressor (42–44). The effect of miR-9 on the metastatic behavior of SCCs observed in our animal model and in the human SCC cell lines prompted us to examine whether miR-9 was elevated in human SCCs. We performed in situ hybridization to detect miR-9 in tissue arrays of human SCCs and SCC metastases (Biomax). In normal head and neck tissue, miR-9–positive cells were undetectable (Figure 6A), however in head and neck SCCs, 13 of 64 samples (21%; Table 1) contained sporadic miR-9–positive cells (not shown). This low incidence of miR-9–positive tumors is consistent with the recent finding that miR-9 is often methylated in SCCs (44). In contrast, however, 67% (50 of 75) of SCC lymph node metastatic lesions contained miR-9–positive cells (Figure 6A and Table 1).
Figure 6. miR-9 is expressed in human SCC metastases and correlates with loss of α-catenin and increased MDR1 protein.

(A) Representative miR-9 in situ hybridization showing no miR-9 expression in nonmalignant oral mucosa and positive miR-9 staining (blue) in epithelial cells of human SCC metastasis. Upper panels: whole tissue section. Lower panels: magnified sections from upper panels. Arrow points to an example of a nest of miR-9–positive cells. Scale bars: 50 μm. (B) Increased miR-9 in metastatic human primary SCCs transplanted into athymic nude mice (*P = 0.04). miR-9 expression was measured by qRT-PCR, and tumors were grouped into lymph node negative (n = 4) or positive (n = 8) by TNM staging. Diamonds represent individual tumors and bars represent averages. (C) miR-9 expression in SCC metastases correlated with α-catenin loss and increased MDR1 staining. Each image row is from consecutive tissue sections. Top row: miR-9–negative cells retained membrane E-cadherin and α-catenin, with no MDR1 staining. Middle row: example of α-catenin loss with retention of E-cadherin and increased MDR1 staining in miR-9–positive cells. Bottom row: example of both α-catenin and E-cadherin loss and increased MDR1 staining in miR-9–positive cells. Scale bar: 50 μm.
Table 1.
Increased miR-9 in SCC metastases
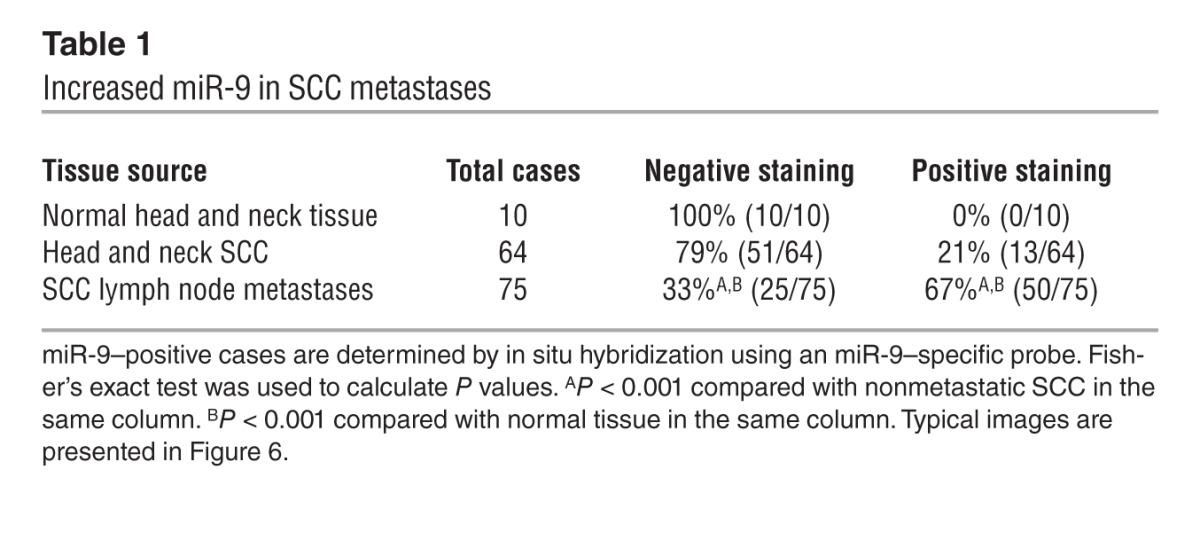
Since miR-9 expression in mouse SCCs was enriched after tumor passaging, we subcutaneously transplanted primary head and neck SCCs collected from our clinic into the flanks of athymic nude mice and examined miR-9 expression in the passaged tumors. In comparison with nonmetastatic SCCs (node negative), miR-9 expression in SCCs with lymph node metastasis (node positive) showed a significant increase (P = 0.04) (Figure 6B). These data further suggest a prometastatic role for miR-9 in human SCCs.
Identifying miR-9 targets involved in SP expansion, EMT, and metastasis in K15.KrasG12D.Smad4–/– SCCs.
miR-9 has multiple known targets including both tumor suppressors and promoters. Among them, E-cadherin (41) and NFκB1 (45, 46) are generally expressed in SCCs, whereas two other recently identified potential miR-9 target proteins, SOCS5 (47) and LIFR (48), are generally expressed at very low levels in SCCs. Because miR-9 is not expressed in normal mouse skin (38) and microRNA regulation of target genes is tissue and context specific, we examined miR-9 targets in K15.KrasG12D.Smad4–/– SCCs cells. In K15.KrasG12D.Smad4–/– SCCs that overexpress miR-9, NFκB1 was still prominently expressed (data not shown), suggesting that either NFκB1 is not a predominant miR-9 target in these cells, or miR-9–mediated NFκB inhibition can be overridden by other mechanisms in K15.KrasG12D.Smad4–/– SCCs, such as the absence of Smad4 loss–associated inflammation (4). E-cadherin, a known miR-9 target (41), was completely lost in tumors derived from B911-miR-9 cells or B931-GFP cells (Supplemental Figure 8). Tumors derived from B931-Zip-9 cells, however, did not restore E-cadherin expression (Supplemental Figure 8), despite the dramatic effect of miR-9 knockdown on metastasis (Figure 4, E and F), suggesting that miR-9 has additional targets linked to metastasis. The loss of α-catenin but not E-cadherin in primary tumors derived from FaDu-miR-9 human SCC cells (Figure 4D) prompted us to examine whether α-catenin, which showed an inverse correlation with miR-9 in colon cancer cells (49), is a predominant miR-9 target in SCCs. Using the same SCC metastasis tissue array used in Figure 6A, we stained for α-catenin and E-cadherin and examined their correlation with miR-9 status. Loss of E-cadherin occurred at similar rates between miR-9–negative and miR-9–positive cases (Figure 6C and Table 2). In contrast, α-catenin loss increased significantly in miR-9–positive cases compared with miR-9–negative cases (Figure 6C and Table 2). Further, immunostaining for MDR1 in the SCC arrays revealed that MDR1-positive cells were rarely detected in primary human SCCs (not shown), but were frequently detected in metastatic SCC lesions in sporadic patterns similar to those in miR-9. Cases with positive MDR1 staining correlated with miR-9–positive cases (Figure 6C and Table 2). To further determine whether α-catenin is a direct miR-9 target and hence whether its loss could be contributed to increased MDR1, we searched the TargetScan microRNA database and found that α-catenin is predicted to be a direct miR-9 target (Figure 7A). Western analysis showed that B911-miR-9 tumor cells had a significant reduction in α-catenin, whereas B931-Zip-9 tumor cells had an increase in α-catenin compared with their respective GFP controls (Figure 7, B and C). Consistent with this, immunostaining revealed α-catenin staining in the cell membrane of most cells in primary K15.KrasG12D.Smad4–/– SCCs, but showed a patchy loss of membrane-bound α-catenin in passaged tumors (Supplemental Figure 2). In addition, α-catenin staining was present in the cell membranes of ~50% of cells in tumors derived from B911-GFP cells, but was completely lost in tumors derived from B911-miR-9 cells (Figure 7D). Conversely, the expression of α-catenin was barely detectable in B931-GFP tumors (Figure 7D). In B931-Zip-9 tumors, α-catenin staining was patchy in the cell membrane, but overall, membrane-associated α-catenin was not restored (Figure 7D). Interestingly, FaDu-GFP SCC cells showed α-catenin membrane staining similar to that in their primary tumors, even after metastasis (Figure 7D), but FaDu-miR-9 metastatic SCC cells completely lost α-catenin staining (Figure 7D).
Table 2.
Summary of staining patterns for α-catenin, E-cadherin, and MDR1 proteins in miR-9–negative and positive cases of SCC metastasis
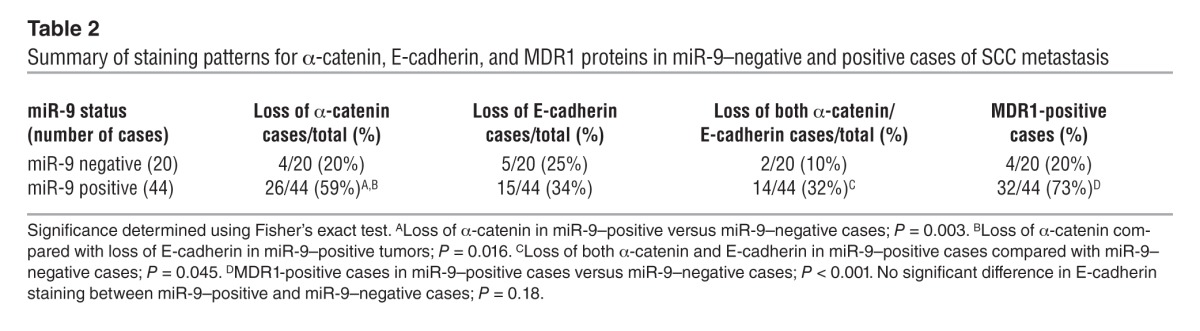
Figure 7. miR-9 targets α-catenin.

(A) Predicted duplex formation between human and mouse α-catenin 3ιUTRs and miR-9. (B) Western blot analysis demonstrating decreased α-catenin in B911-miR-9 tumor cells compared with B911-GFP tumor cells, and (C) demonstrating that α-catenin was barely detectable in B931-GFP tumor cells but was increased in B931-Zip-9 tumor cells (full uncut gels for B and C are shown in the Supplemental Material). (D) Immunofluorescence showing patchy loss of membrane-associated α-catenin in an SCC derived from B911-GFP cells compared with complete loss in a B911-miR-9–derived SCC. B931-GFP tumors have complete loss of α-catenin. B931-Zip-9 tumors have patchy recovery of α-catenin but do not have fully restored membrane α-catenin. α-Catenin was retained in SCC metastases derived from FaDu-GFP cells but was lost in SCC metastases derived from FaDu-miR9 cells. Sections were counterstained for keratin 14 (K14) (red), which was essentially lost in tumors derived from B911 or B931 cells and their derived cell lines. Scale bar: 25 μm.
Reduced E-cadherin and α-catenin could explain the increased EMT and invasion induced by miR-9 overexpression, however, inhibition of metastasis by miR-9 knockdown without full restoration of α-catenin and E-cadherin suggested additional players involved in miR-9 overexpression. Moreover, since neither E-cadherin nor α-catenin directly targets ABCB1 expression, the reduction in the SP size resulting from miR-9 knockdown cannot be explained by this mechanism. Because β-catenin has been shown to mediate metastasis (50, 51) and target ABCB1 (52, 53), we examined whether reduced α-catenin/E-cadherin caused β-catenin nuclear translocation. Immunostaining showed β-catenin to be primarily associated with the cell membrane, with only sporadic nuclear staining in primary K15.KrasG12D.Smad4–/– SCCs (Figure 8A), whereas passaged tumors showed a loss of membrane staining and a significant increase in nuclear β-catenin (Figure 8A). In tumors derived from B911-GFP cells, β-catenin was localized mainly in the cytoplasm (Figure 8A). In contrast, tumors derived from B911-miR-9 cells demonstrated predominately nuclear β-catenin staining (Figure 8A). B931-GFP tumors showed both cytoplasmic and nuclear β-catenin staining (Figure 8A); however, nuclear β-catenin was rarely observed in B931-Zip-9 tumors, and more strikingly, patchy restoration of membrane-associated β-catenin was obvious (Figure 8A). To further study whether activated β-catenin contributes to increased ABCB1a expression, we knocked down β-catenin in B911-miR-9 cells and B911-GFP control cells (Figure 8B) and assayed for ABCB1a transcripts. Knocking down β-catenin significantly attenuated miR-9–induced ABCB1a expression (Figure 8C).
Figure 8. miR-9 promotes nuclear translocation of β-catenin that contributes to ABCB1 overexpression.

(A) Immunofluorescence of β-catenin (green) showing membrane staining in a primary K15.KrasG12D.Smad4–/– SCC. Membrane staining was lost in the passaged SCC and had increased nuclear β-catenin. SCC derived from B911-GFP cells shows cytoplasmic β-catenin, which became predominately nuclear in a B911-miR-9 tumor. A B931-GPF tumor shows cytoplasmic and sporadic nuclear β-catenin, whereas a B931-Zip-9 tumor shows patchy restoration of membrane-associated β-catenin. Sections were counterstained with DAPI (blue). Scale bar: 50 μm. (B) qRT showing siRNA knockdown of β-catenin in B911-GFP and B911-miR-9 cells. *P = 0.03 compared with scrambled siRNA control (n = 3). (C) Knockdown of β-catenin reduces ABCB1a expression. *P = 0.01 compared with B911-GFP transfected with scrambled siRNA (n = 3). #P = 0.03 compared with B911-miR-9 transfected with β-catenin siRNA (n = 3).
Discussion
Combination of Kras activation and Smad4 deletion in multipotent stem cells gives rise to highly metastatic tumors.
In mice, the deletion of Smad4 or PTEN in stratified epithelial cells resulted in the formation of multilineage tumors (SCCs, BCCs, trichoepitheliomas, and sebaceous adenomas) corresponding to all major skin stem cell lineages (5, 32, 54). However, it was unknown whether these tumors arose from lineage-committed cells or multipotent stem cells. In our animal model, we restricted the deletion of Smad4 and the activation of KrasG12D to K15+ bulge stem cells using an inducible Cre recombinase. A previous report has shown that cells expressing a reporter gene activated by K15.CrePR1 only temporarily migrate into the interfollicular epidermis in response to wounding (55). In our study, the induction of K15.CrePR1 occurred over a short interval (5 consecutive days) when the mice were 3 weeks of age and were not wounded. This induction strategy ensured that the mutations were initially activated in bulge stem cells. Since the development of tumors is rapid in these mice, it is likely that the tumors arose directly from K15.KrasG12D.Smad4–/– cells or their immediate progeny harboring identical mutations. Therefore, our data suggest that the loss of Smad4, in combination with the activation of KrasG12D, initiates tumor formation in uncommitted multipotent stem cells or their immediate progenitor cells and that these initiated cells subsequently developed into all tumor lineages predicted to arise from bulge stem cells.
Although K15.KrasG12D.Smad4–/– mice initially developed primary tumors that were both benign and malignant, we only observed the outgrowth of more aggressive SCCs and BSCCs following serial passage. In addition, the transplanted tumors frequently exhibited EMT-mediated progression. These poorly differentiated SCCs, BSCCs, and SPCCs were highly metastatic. Even though we observed a dramatic increase in the population of CSC in metastatic SCCs and SPCCs, the majority of passaged tumor cells were unable to initiate secondary tumor formation. Each of the two CSC populations identified in this study can give rise to the other population after in vivo passaging, suggesting that the two populations are not fixed cell types and that their plasticity is influenced by the in vivo microenvironment. These data highlight the complexity and heterogeneity of CSC populations. Previous studies of other highly metastatic tumors such as melanomas have suggested that the capacity of tumor cells to initiate secondary tumor formation is increased when these assays are performed in more severely immune-compromised backgrounds (56). Therefore, it remains to be determined whether the tumor initiation capabilities of the distinct CSC-rich and non-CSC populations identified in this study would be different if assayed in more immune-compromised mice.
CSC properties of tumor initiation and metastasis can be uncoupled and are dictated by specific mutations.
Although K15.KrasG12D.Smad4–/– mice developed aggressive tumors, targeting the deletion of Smad4 alone to the K15+ stem cells did not result in spontaneous SCC formation, as was seen in MMTV Smad4–/–, K14.Smad4–/–, and K5.Smad4–/– mice (4, 5, 32). One possible explanation for this difference is that deletion of Smad4 alone in bulge stem cells was insufficient to change the slow-cycling nature of these stem cells; thus, activation of KrasG12D was required to increase the proliferative potential of bulge stem cells and allow tumor initiation. In contrast, the MMTV, K5, and K14 promoters also target stem cells in the interfollicular epidermis, which divide more frequently than bulge stem cells (8, 33) and may allow tumor initiation in Smad4–/– cells in the absence of Kras mutations. Thus, the capacity for tumor initiation is not always linked to metastatic potential.
It is believed that metastatic SCCs arise as the consequence of a classical multistep carcinogenesis process with multiple, cumulative mutations (3). Our current study shows that metastasis can be significantly accelerated/increased when certain mutations occur in multipotent skin stem cells. The incidence of lung metastasis in K15.KrasG12D.Smad4–/– mice was 28% compared with less than 3% in a classical chemically induced mouse model of skin cancer (3). Deletion of Smad4 in other cell compartments using K5, K14, or MMTV promoter–driven Cre recombination led to SCC formation with spontaneous Kras and Hras mutations; however, none of these models developed lung metastases or exhibited increased EMT (4, 5, 26, 32). These data suggest that the combination of mutations alone does not direct metastasis. Furthermore, tumors generated when the same K15.CrePR1 transgene was used to activate the KrasG12D mutation and delete p53 were also not reported to metastasize or undergo EMT (14). Therefore, it is the combination of Smad4 loss and Kras activation in K15+ stem cells that drives lung metastasis in K15.KrasG12D.Smad4–/– mice. Although the K5, K14, and MMTV promoters may target stem cells in the epidermis and hair follicles, SCCs appear to primarily develop from the interfollicular epidermis when the entire epithelium is targeted. In our current model, K15.KrasG12D.Smad4–/– tumor cells appear to be intrinsically susceptible to EMT and metastasis. We also observed an increase to 80% in the frequency of lung metastasis when K15.KrasG12D.Smad4–/– tumors were passaged, and the increased capacity of these tumors to metastasize was correlated with increased SP cell numbers. It is possible that the immunocompromised environment of the recipient mouse could have contributed to CSC expansion because SCCs are far more aggressive in immune-compromised transplant patients (57). However, significant increases in EMT and metastasis were seen after the first passage of K15.KrasG12D.Smad4–/– tumors, which was not observed in passaged UV-induced SCCs. Therefore, inherent properties of K15.KrasG12D.Smad4–/– tumors contribute to EMT and metastasis. While UV-induced skin cancers frequently harbor ras mutations (58) and Smad4 loss (26), these mutations occur sporadically throughout the skin, mostly in K15-negative interfollicular keratinocytes in closer proximity to UVB irradiation. Therefore, the combination of discrete genetic mutations, the appropriate stem cell targets, and changes in the microenvironment may all contribute to the incidence and rate of metastasis observed in this study.
miR-9 overexpression contributes to the expansion of metastatic CSCs and SCC metastasis.
The finding that miR-9 was overexpressed in metastatic K15.KrasG12D.Smad4–/– SCCs was initially a surprise to us, since miR-9 is often methylated in human tumors, including SCCs (44, 59). However, miR-9 has been shown to be overexpressed in certain metastatic cancer types (41, 49). The observation that miR-9 mediates the inhibition of cell cycle progression (ref. 60 and this study) suggests that miR-9 may help stem cells maintain quiescence. Although the mouse miR-9 sequence is identical to human miR-9, the mouse miR-9 promoter does not have CpG islands found in the human miR-9 promoter. Therefore, the lack of miR-9 expression in mouse skin and K15.Kras.Smad4–/– primary tumors is not due to methylation status, but may be due to the lack of activation mechanisms for miR-9 expression, as seen in neuronal tissue (38). Since miR-9 overexpression was mainly observed in passaged tumors, these results suggest that Kras activation and Smad4 deletion are not sufficient to induce miR-9 overexpression and that additional oncogenic events are required for miR-9 overexpression in passaged tumors. However, the increase in the proliferative potential driven by Kras activation and Smad4 loss could allow CSCs to overcome miR-9–induced growth inhibition. Under these conditions, miR-9 overexpression facilitates the expansion of the metastatic CSC-rich pool, and the size of this pool could determine the rate and route of metastasis. For instance, in human SCC cells, miR-9 enriches the metastatic CSC-rich pool and promotes lung metastasis after forming lymph node metastases (Figure 4E), whereas in K15.KrasG12D.Smad4–/– tumors, particularly in passaged tumors, high levels of miR-9 expression have already enriched metastatic CSCs in primary tumors, so they are capable of metastasizing to the lung without increasing lymph node metastases. Our findings that primary human SCCs or cell lines contained few miR-9–positive cells may explain why human SCCs generally have a low metastatic rate compared with other aggressive cancers. However, our data demonstrating that the metastatic potential of human SCC cell lines was increased by overexpressing miR-9 support the role of miR-9 in metastasis.
In tumors derived from K15.KrasG12D.Smad4–/– mice, increased miR-9 correlated with a loss of E-cadherin and α-catenin, the two previously reported potential miR-9 targets associated with EMT and metastasis (41, 49). It was not clear, however, whether the loss of these adhesion molecules was the result of EMT or direct targeting by miR-9. Using human SCC cell–derived tumors or metastatic SCCs, which still partially retain adhesion molecules, we found that miR-9 primarily targets α-catenin, since the loss of α-catenin was more pronounced than the loss of E-cadherin in miR-9–transduced FaDu tumors. Further, in human SCC metastases, the loss of both α-catenin and E-cadherin was more frequently observed in miR-9–positive cases than in miR-9–negative cases. E-cadherin loss could occur either as a direct result of miR-9 overexpression or as a consequence of α-catenin loss–associated tumor progression.
Our findings are consistent with reports that EMT promotes an increase in CSCs and metastasis in other cancer types (18, 60), and clinical observations that the reduced expression of α-catenin and E-cadherin are prognostic indicators of poor survival and metastatic potential for SCCs (7, 26, 61, 62). However, the loss of either E-cadherin or α-catenin alone does not cause SCC metastasis (7, 26, 61, 62). Thus, additional events are required for miR-9–mediated metastasis, and we have provided data implicating β-catenin activation as that key event. The restoration of membrane-associated β-catenin after miR-9 knockdown did not alter tumor initiation and growth, suggesting that β-catenin activation is not required for tumor initiation. However, the restoration of membrane-associated β-catenin via miR-9 knockdown was correlated with reduced metastasis, and knocking down β-catenin reduced ABCB1a expression. Thus, increased nuclear β-catenin appears to contribute greatly to miR-9–mediated expansion of metastatic CSCs. It is likely that the loss of α-catenin and E-cadherin make it easier for β-catenin to translocate to the nucleus since it is no longer anchored to the membrane. However, knocking down miR-9 prevented β-catenin nuclear translocation more efficiently than restoring membrane-associated α-catenin, suggesting that additional mechanisms are involved in β-catenin activation. Future studies are required to determine whether other miR-9 targets also regulate β-catenin activation.
In summary, we have developed one of the most aggressive SCC mouse models reported to date. We show that CSCs derived from K15.KrasG12D.Smad4–/– cells remain multipotent and give rise to SCCs that are highly metastatic to the lung. We provide evidence that the capacity to initiate tumors does not predict metastatic potential, highlighting the importance of discovering biomarkers for metastatic CSCs. We provide data suggesting that miR-9 is a potential biomarker for metastatic CSCs.
Methods
Generation of tumors from mouse models.
All animal experiments were conducted using protocols approved by the IACUC of the University of Colorado Denver Anschutz Medical Campus. Studies involved in human head and neck cancer tumor collection and xenografting were approved by the IRB of the University of Colorado Denver Anschutz Medical Campus.
Mice were bred to contain the following transgenes: a keratin 15 promoter–driven Cre recombinase (K15.CrePR1 on a C57BL/6 background) (29), Smad4 with exon 8 flanked by Lox P sites (Smad4f/f on a C57BL/6 background) (5), and a constitutively active KrasG12D mutation (LSL-KrasG12D on a C57BL/6J background) (12). Activation of these mutant alleles was achieved by application of RU486 (100 μl of 0.2 μg/μl in 70% ethanol) to the shaved dorsal skin of 3-week-old transgenic mice for 5 consecutive days. The presence of transgenes was confirmed, and verification of transgene activation was performed as previously described (4).
The mice were examined at least once a week for tumor development, and once tumors became visible, the mice were monitored daily. Tumor-bearing mice were euthanized when tumors reached 2 cm in diameter or if the mice were moribund. Necropsy was performed on each euthanized mouse to identify primary tumors and metastasis. Tumor tissue was collected for histology, sorting, and passaging into athymic nude mice.
Tumor histology.
Human and mouse skins and tumors were fixed in 10% neutral-buffered formalin for 24 hours, embedded in paraffin, sectioned to 6-μm thickness, and stained with H&E. Tumors were diagnosed and scored according to histology by a pathologist and three independent investigators.
Tumor passaging.
Human SCCs were collected as discarded tissues and transplanted into nude mice under IRB approval of the University of Colorado Denver Anschutz Medical Campus. Mouse or human tumors were transplanted and maintained in nude mice as described previously (35). Briefly, a recipient athymic nude mouse was anesthetized and the back skin sterilized. Small incisions were made in the skin and the tumor piece (~3 mm) was inserted into the incision.
Tumor cell grafting.
Tumor cell skin grafts were performed as described (37). Briefly, athymic nude mice were anesthetized, and their back skin was disinfected with betadine and 70% ethanol. Scissors were used to cut small holes in the dermis and epidermis, and underlying connective tissue was dissected away from the skin. Silicone chambers (Renner GmbH) were placed such that the flanges of the chamber lay between the skin and the connective tissue, and the chamber extruded from the open hole. A mixture of 1 × 10⁶ fibroblasts and 1 × 10⁶ keratinocytes isolated from wild-type neonatal mouse back skin along with the sorted tumor cells were injected into the 2-mm hole in the top of the grafting chamber. The chamber was removed after 1 week, and the mouse was observed for tumor formation. For orthotopic grafting, 150,000 human head and neck SCC cells (FaDu) were mixed with Matrigel and injected into the floor of the mouth as described (63). For mouse chemotherapy, 5,000 tumor cells were subcutaneously injected into the flanks of 8-week-old female athymic nude mice. Once tumors had an average diameter of 5 to 10 mm, the mice were divided into treatment groups with similar average tumor sizes. For verapamil and docetaxel combination therapy, the mice were given i.p. injections of verapamil (25 mg/kg in normal saline) or vehicle daily with a schedule of 5 days on and 2 days off. Docetaxel (20 mg/kg dissolved in 10% Tween 80 and 5% ethanol in PBS) or vehicle was given by i.p. injection on days 3 and 10. Tumors were measured weekly with digital calipers. Verapamil (6.25 mg/ml) and docetaxel (2.5 mg/ml) were prepared immediately before use.
Flow cytometry.
A tumor cell suspension was prepared as described (64). Briefly, tumors were harvested from mice, chopped into small pieces, and digested in a collagenase solution at 37°C for 30 minutes. After this time, the cells were manually dissociated by pipetting up and down approximately 10 times with a 10-ml serological pipette. Cells were incubated at 37°C for an additional 15 minutes and filtered (70-μm filter). Cells were stained with 25 ng/ml Hoechst 33342 dye (Sigma-Aldrich) at a concentration of 1 × 10⁶ cells per 1 ml in PBS with 3% FBS for 90 minutes at 37°C as previously described (21, 22). Control cells were stained in the presence of 100 μM verapamil to inhibit Hoechst dye efflux. The cells were washed in PBS with 3% FBS, stained with FITC-CD31, FITC-CD45, Biotin-CD34 (eBioscience), and PE-Cy5 CD49f (BD Bioscience), followed by secondary antibody staining with streptavidin-PE (BD Biosciences). When sorting tumor cells containing GFP-positive cells, APC-CD31 and APC-CD45 (eBioscience) were substituted for the FITC-conjugated antibodies. The cells were washed, filtered (40-μm filter), and propidium iodide (Sigma-Aldrich) was added to select for live cells; cells were sorted using a MoFlow XDP flow cytometer (Beckman Coulter).
Cell culture and stable miR-9 transduction and miR-9 knockdown.
Tumor cell lines were generated as we previously described (64). Briefly, tumor pieces were digested in collagenase (Worthington) for 45 minutes at 37°C and in 0.25% trypsin for 15 minutes at 37°C. The cells were filtered through a 40-μm filter and washed in a culture medium of DMEM with 10% FBS. Cells were plated in 10-cm culture dishes and cultured at 5% CO2. Prior to subculturing, cells were treated with TrypLE (Gibco) for 2 minutes, and floating cells were discarded to select for epithelial cells. This selection was repeated prior to three to five subsequent subcultures or as needed to remove fibroblast contamination. Lentiviral vectors containing either a GFP-labeled precursor miR-9-1, an antisense miR-9 knockdown construct (Zip-9) that produces shRNA, in a short, single-stranded anti-microRNA for miR-9, or a GFP control construct alone (System Biosciences), were transfected into 293T cells along with a lentiviral packaging mix (System Biosciences) using Lipofectamine 2000 (Invitrogen). The virus-containing media were harvested at 24, 32, and 48 hours and were overlaid on recipient cell lines. Recipient cell lines were expanded and flow sorted for GFP positivity to select for transduced cells.
Gene and microRNA expression analysis.
Total RNA from cultured mouse or human cells, sorted mouse tumor cells, or human SCC tumors was isolated using a QIAGEN miRNeasy kit. One-step qRT-PCR for gene expression was performed with 100 ng of RNA per reaction using the One-Step Brilliant II qRT-PCR system (Stratagene). Expression of mRNA was measured using TaqMan assays-on-demand probes (Applied Biosystems). All gene measurements were normalized to a GAPDH RNA probe. Each sample was run in triplicate, and data were analyzed using a standard relative quantification (ΔΔCt) method.
miR-9 expression analysis by qRT-PCR was conducted using a two-step method. First, microRNA-specific cDNA was prepared using 10–300 ng of starting RNA and microRNA-specific RT primers (Applied Biosystems). The RT reaction was carried out using the High Capacity RT Kit from Applied Biosystems according to the manufacturer’s instructions. Once microRNA-specific cDNA was prepared, the qRT-PCR reaction was run using TaqMan miR-9 probes and a TaqMan Universal Master Mix (Applied Biosystems). miR-9 expression was normalized to a mammalian U6 small RNA probe (Applied Biosystems).
Immunostaining.
IHC staining was performed as previously described (30) using an MDR1 antibody (1:400; Abcam) and counterstained with hematoxylin. Immunofluorescence staining was performed as previously described (30). Primary antibodies included α-catenin (1:200; Abcam), keratin 14 (1:200; Fitzgerald), keratin 15 (1:2,000; Covance), E-cadherin (1:200; eBioScience), PCNA (sc-7907; 1:200, Santa Cruz Biotechnology Inc.), keratin 1 (1:800; Roop lab), β-catenin (ab16051, 1:200; Abcam). Alexa Fluor 488–conjugated (green) or Alexa Fluor 594–conjugated (red) secondary antibodies (Invitrogen) were used for visualization.
Western blotting.
Western blotting was performed as previously described (65) using primary antibodies against α-catenin (1:1,500; Abcam) and GAPDH (1:1,000; Cell Signaling Technology). Alexa Fluor 700 and Alexa Fluor 800 secondary antibodies (Molecular Probes) were used to detect α-catenin and GAPDH, respectively. Western blots were scanned with the Odyssey Infrared Imaging System (LI-COR Biosciences).
Invasion assays.
Transwell Matrigel invasion chambers (BD Biosciences) were prepared according to the manufacturer’s instructions. Tumor cells were plated at a density of 1 × 10³ to 5 × 10³ tumor cells per Transwell in serum-free medium. DMEM containing 10% FBS was used as a chemoattractant in the bottom well. The cells were incubated at 37°C in a standard tissue culture incubator for 24 to 48 hours. Nonmigratory cells were removed from the inside of the well, and migratory cells were fixed in Diff-Quick fixing medium and stained with 0.05% crystal violet. Air-dried membranes were fixed to slides using Fluormount G. The number of cells migrated per microscopic field (×10) was counted and averaged over nine fields from three experimental replicates.
miR-9 in situ hybridization.
HNSCC tissue array (HN802) and human SCC lymph node metastasis tissue array (LY802) slides were purchased from US Biomax Inc. Dig-labeling miRCURY LAN microRNA probe for human miR-9 was purchased from Exiqon (hsa-miR-9: /5DigN/TCATACAGCTAGATAACCAAAGA/3Dig_N/). Hybridization and detection were performed following the manufacturer’s instructions with modification based on our previous publication (66). Briefly, slides were deparaffinized and treated with proteinase K for 5 minutes and with 4% paraformaldehyde for 10 minutes. The sections were hybridized with 40 nM miR-9 probe overnight at 50°C. After 50% formamide/2 × SSC buffer wash at 50°C, the slides were equilibrated with maleic acid buffer containing 0.1% Tween 20. Immunological detection of the hybridized probes was performed with an anti-Dig antibody conjugated with alkaline phosphatase and developed with nitroblue tetrazolium chloride (NBT)/5-bromo-4-chloro-3-indolyl-phosphate (BCIP) color substrates (Roche Diagnostics). Finally, the slides were stained with fast red and covered with poly-mount xylene (Sigma-Aldrich).
Statistics.
For all qRT-PCR data, error bars are represented as the SD between samples. In most cases, significance was assessed using a standard two-tailed Student’s t test. Significance for incidences (Figure 1, D and E, and Tables 1 and 2) was analyzed using Fisher’s exact test. Significance for correlation (Figure 3B) was determined by calculating the correlation coefficient (R2).
Supplementary Material
Acknowledgments
We thank Chuxia Deng for providing the Smad4 floxed mice. This work is supported by NIH grants CA89849, DE15953, and DE20649 (to X.J. Wang); DE019712 and CA149456 (to A. Jimeno); and CA052607 (to D.R. Roop). R.A. White acknowledges support from the Radiological Society of North America Medical Student Research Grant. A. Reddi acknowledges financial support from the University of Colorado School of Medicine Research Track and is a recipient of the 2011–2012 Neil and Catherine Hamilton Cancer Research Scholarship. L. Dionne is a postdoctoral fellow supported by an NIH grant (T32 CA174648). The authors thank the University of Colorado Cancer Center FACS Core (P30 CA046934) for performing cell sorting and the University of Colorado Skin Disease Research Center Morphology Phenotyping Core (P30 AR057212) for assisting with histological work. We also thank Pamela Garl for proofreading the manuscript.
Footnotes
Conflict of interest: The authors have declared that no conflict of interest exists.
Citation for this article: J Clin Invest. 2013;123(10):4390–4404. doi:10.1172/JCI65856.
References
- 1.Weinberg AS, Ogle CA, Shim EK. Metastatic cutaneous squamous cell carcinoma: an update. Dermatol Surg. 2007;33(8):885–899. doi: 10.1111/j.1524-4725.2007.33190.x. [DOI] [PubMed] [Google Scholar]
- 2.Friedman HI, Cooper PH, Wanebo HJ. Prognostic and therapeutic use of microstaging of cutaneous squamous cell carcinoma of the trunk and extremities. Cancer. 1985;56(5):1099–1105. doi: 10.1002/1097-0142(19850901)56:5<1099::AID-CNCR2820560524>3.0.CO;2-R. [DOI] [PubMed] [Google Scholar]
- 3.Ratushny V, Gober MD, Hick R, Ridky TW, Seykora JT. From keratinocyte to cancer: the pathogenesis and modeling of cutaneous squamous cell carcinoma. J Clin Invest. 2012;122(2):464–472. doi: 10.1172/JCI57415. [DOI] [PMC free article] [PubMed] [Google Scholar]
- 4.Bornstein S, et al. Smad4 loss in mice causes spontaneous head and neck cancer with increased genomic instability and inflammation. J Clin Invest. 2009;119(11):3408–3419. doi: 10.1172/JCI38854. [DOI] [PMC free article] [PubMed] [Google Scholar]
- 5.Qiao W, Li AG, Owens P, Xu X, Wang XJ, Deng CX. Hair follicle defects and squamous cell carcinoma formation in Smad4 conditional knockout mouse skin. Oncogene. 2006;25(2):207–217. doi: 10.1038/sj.onc.1209029. [DOI] [PubMed] [Google Scholar]
- 6.Teng Y, et al. Synergistic function of Smad4 and PTEN in suppressing forestomach squamous cell carcinoma in the mouse. Cancer Res. 2006;66(14):6972–6981. doi: 10.1158/0008-5472.CAN-06-0507. [DOI] [PubMed] [Google Scholar]
- 7.Hsu YC, Fuchs E. A family business: stem cell progeny join the niche to regulate homeostasis. Nat Rev Mol Cell Biol. 2012;13(2):103–114. doi: 10.1038/nrm3272. [DOI] [PMC free article] [PubMed] [Google Scholar]
- 8.Arwert EN, Hoste E, Watt FM. Epithelial stem cells, wound healing and cancer. Nat Rev Cancer. 2012;12(3):170–180. doi: 10.1038/nrc3217. [DOI] [PubMed] [Google Scholar]
- 9.Tudor D, Locke M, Owen-Jones E, Mackenzie IC. Intrinsic patterns of behavior of epithelial stem cells. J Investig Dermatol Symp Proc. 2004;9(3):208–214. doi: 10.1111/j.1087-0024.2004.09310.x. [DOI] [PubMed] [Google Scholar]
- 10.Shendrik I, Crowson AN, Magro CM. Follicular cutaneous squamous cell carcinoma: an under-recognized neoplasm arising from hair appendage structures. Br J Dermatol. 2013;169(2):384–388. doi: 10.1111/bjd.12374. [DOI] [PubMed] [Google Scholar]
- 11.Liu Y, Lyle S, Yang Z, Cotsarelis G. Keratin 15 promoter targets putative epithelial stem cells in the hair follicle bulge. J Invest Dermatol. 2003;121(5):963–968. doi: 10.1046/j.1523-1747.2003.12600.x. [DOI] [PubMed] [Google Scholar]
- 12.Jackson EL, et al. Analysis of lung tumor initiation and progression using conditional expression of oncogenic K-ras. Genes Dev. 2001;15(24):3243–3248. doi: 10.1101/gad.943001. [DOI] [PMC free article] [PubMed] [Google Scholar]
- 13.Li S, et al. A keratin 15 containing stem cell population from the hair follicle contributes to squamous papilloma development in the mouse [published online ahead of print March 16, 2012]. Mol Carcinog. doi: 10.1002/mc.21896. doi: 10.1002/mc.21896 . [DOI] [PMC free article] [PubMed] [Google Scholar]
- 14.Lapouge G, et al. Identifying the cellular origin of squamous skin tumors. Proc Natl Acad Sci U S A. 2011;108(18):7431–7436. doi: 10.1073/pnas.1012720108. [DOI] [PMC free article] [PubMed] [Google Scholar]
- 15.White AC, et al. Defining the origins of Ras/p53-mediated squamous cell carcinoma. Proc Natl Acad Sci U S A. 2011;108(18):7425–7430. doi: 10.1073/pnas.1012670108. [DOI] [PMC free article] [PubMed] [Google Scholar]
- 16.Wang GY, Wang J, Mancianti ML, Epstein EH. Basal cell carcinomas arise from hair follicle stem cells in Ptch1(+/–) mice. Cancer Cell. 2011;19(1):114–124. doi: 10.1016/j.ccr.2010.11.007. [DOI] [PMC free article] [PubMed] [Google Scholar]
- 17.Chaffer CL, et al. Normal and neoplastic nonstem cells can spontaneously convert to a stem-like state. Proc Natl Acad Sci U S A. 2011;108(19):7950–7955. doi: 10.1073/pnas.1102454108. [DOI] [PMC free article] [PubMed] [Google Scholar]
- 18.Mani SA, et al. The epithelial-mesenchymal transition generates cells with properties of stem cells. Cell. 2008;133(4):704–715. doi: 10.1016/j.cell.2008.03.027. [DOI] [PMC free article] [PubMed] [Google Scholar]
- 19.Trempus CS, et al. Enrichment for living murine keratinocytes from the hair follicle bulge with the cell surface marker CD34. J Invest Dermatol. 2003;120(4):501–511. doi: 10.1046/j.1523-1747.2003.12088.x. [DOI] [PubMed] [Google Scholar]
- 20.Schober M, Fuchs E. Tumor-initiating stem cells of squamous cell carcinomas and their control by TGF-beta and integrin/focal adhesion kinase (FAK) signaling. Proc Natl Acad Sci U S A. 2011;108(26):10544–10549. doi: 10.1073/pnas.1107807108. [DOI] [PMC free article] [PubMed] [Google Scholar]
- 21.Hirschmann-Jax C, et al. A distinct “side population” of cells with high drug efflux capacity in human tumor cells. Proc Natl Acad Sci U S A. 2004;101(39):14228–14233. doi: 10.1073/pnas.0400067101. [DOI] [PMC free article] [PubMed] [Google Scholar]
- 22.Redvers RP, Li A, Kaur P. Side population in adult murine epidermis exhibits phenotypic and functional characteristics of keratinocyte stem cells. Proc Natl Acad Sci U S A. 2006;103(35):13168–13173. doi: 10.1073/pnas.0602579103. [DOI] [PMC free article] [PubMed] [Google Scholar]
- 23.Liang L, Bickenbach JR. Somatic epidermal stem cells can produce multiple cell lineages during development. Stem Cells. 2002;20(1):21–31. doi: 10.1634/stemcells.20-1-21. [DOI] [PubMed] [Google Scholar]
- 24.Song J, Chang I, Chen Z, Kang M, Wang CY. Characterization of side populations in HNSCC: highly invasive, chemoresistant and abnormal Wnt signaling. PLoS One. 2010;5(7):e11456. doi: 10.1371/journal.pone.0011456. [DOI] [PMC free article] [PubMed] [Google Scholar]
- 25.Lu SL, et al. Loss of transforming growth factor-beta type II receptor promotes metastatic head-and-neck squamous cell carcinoma. Genes Dev. 2006;20(10):1331–1342. doi: 10.1101/gad.1413306. [DOI] [PMC free article] [PubMed] [Google Scholar]
- 26.Hoot KE, et al. Keratinocyte-specific Smad2 ablation results in increased epithelial-mesenchymal transition during skin cancer formation and progression. J Clin Invest. 2008;118(8):2722–2732. doi: 10.1172/JCI33713. [DOI] [PMC free article] [PubMed] [Google Scholar]
- 27.Katiyar SK, Matsui MS, Mukhtar H. Kinetics of UV light-induced cyclobutane pyrimidine dimers in human skin in vivo: an immunohistochemical analysis of both epidermis and dermis. Photochem Photobiol. 2000;72(6):788–793. doi: 10.1562/0031-8655(2000)072<0788:koulic>2.0.co;2. [DOI] [PubMed] [Google Scholar]
- 28.Hanasoge S, Ljungman M. H2AX phosphorylation after UV irradiation is triggered by DNA repair intermediates and is mediated by the ATR kinase. Carcinogenesis. 2007;28(11):2298–2304. doi: 10.1093/carcin/bgm157. [DOI] [PubMed] [Google Scholar]
- 29.Morris RJ, et al. Capturing and profiling adult hair follicle stem cells. Nat Biotechnol. 2004;22(4):411–417. doi: 10.1038/nbt950. [DOI] [PubMed] [Google Scholar]
- 30.Lu SL, et al. Loss of transforming growth factor-beta type II receptor promotes metastatic head-and-neck squamous cell carcinoma. Genes Dev. 2006;20(10):1331–1342. doi: 10.1101/gad.1413306. [DOI] [PMC free article] [PubMed] [Google Scholar]
- 31.Mukhopadhyay A, Krishnaswami SR, Yu BD. Activated Kras alters epidermal homeostasis of mouse skin, resulting in redundant skin and defective hair cycling. J Invest Dermatol. 2011;131(2):311–319. doi: 10.1038/jid.2010.296. [DOI] [PMC free article] [PubMed] [Google Scholar]
- 32.Yang L, et al. Targeted disruption of Smad4 in mouse epidermis results in failure of hair follicle cycling and formation of skin tumors. Cancer Res. 2005;65(19):8671–8678. doi: 10.1158/0008-5472.CAN-05-0800. [DOI] [PubMed] [Google Scholar]
- 33.Blanpain C, Fuchs E. Epidermal homeostasis: a balancing act of stem cells in the skin. Nat Rev Mol Cell Biol. 2009;10(3):207–217. doi: 10.1038/nrm2636. [DOI] [PMC free article] [PubMed] [Google Scholar]
- 34.Boyd AS, Stasko TS, Tang YW. Basaloid squamous cell carcinoma of the skin. J Am Acad Dermatol. 2011;64:144–151. doi: 10.1016/j.jaad.2010.02.051. [DOI] [PubMed] [Google Scholar]
- 35.Prince ME, et al. Identification of a subpopulation of cells with cancer stem cell properties in head and neck squamous cell carcinoma. Proc Natl Acad Sci U S A. 2007;104(3):973–978. doi: 10.1073/pnas.0610117104. [DOI] [PMC free article] [PubMed] [Google Scholar]
- 36.Biddle A, et al. Cancer stem cells in squamous cell carcinoma switch between two distinct phenotypes that are preferentially migratory or proliferative. Cancer Res. 2011;71(15):5317–5326. doi: 10.1158/0008-5472.CAN-11-1059. [DOI] [PubMed] [Google Scholar]
- 37.Lichti U, Anders J, Yuspa SH. Isolation and short-term culture of primary keratinocytes, hair follicle populations and dermal cells from newborn mice and keratinocytes from adult mice for in vitro analysis and for grafting to immunodeficient mice. Nat Protoc. 2008;3(5):799–810. doi: 10.1038/nprot.2008.50. [DOI] [PMC free article] [PubMed] [Google Scholar]
- 38.Yi R, et al. Morphogenesis in skin is governed by discrete sets of differentially expressed microRNAs. Nat Genet. 2006;38(3):356–362. doi: 10.1038/ng1744. [DOI] [PubMed] [Google Scholar]
- 39.Dean M. The genetics of ATP-binding cassette transporters. Methods Enzymol. 2005;400:409–429. doi: 10.1016/S0076-6879(05)00024-8. [DOI] [PubMed] [Google Scholar]
- 40.Bornstein S, et al. Smad4 loss in mice causes spontaneous head and neck cancer with increased genomic instability and inflammation. J Clin Invest. 2009;119(11):3408–3419. doi: 10.1172/JCI38854. [DOI] [PMC free article] [PubMed] [Google Scholar]
- 41.Ma L, et al. miR-9, a MYC/MYCN-activated microRNA, regulates E-cadherin and cancer metastasis. Nat Cell Biol. 2010;12(3):247–256. doi: 10.1038/ncb2024. [DOI] [PMC free article] [PubMed] [Google Scholar]
- 42.Tsai KW, et al. Aberrant hypermethylation of miR-9 genes in gastric cancer. Epigenetics. 2011;6(10):1189–1197. doi: 10.4161/epi.6.10.16535. [DOI] [PMC free article] [PubMed] [Google Scholar]
- 43.Heller G, et al. Genome-wide microRNA expression profiling identifies miR-9-3 and miR-193a as targets for DNA methylation in non-small cell lung cancers. Clin Cancer Res. 2012;18(6):1619–1629. doi: 10.1158/1078-0432.CCR-11-2450. [DOI] [PubMed] [Google Scholar]
- 44.Minor J, et al. Methylation of microRNA-9 is a specific and sensitive biomarker for oral and oropharyngeal squamous cell carcinomas. Oral Oncol. 2012;48(1):73–78. doi: 10.1016/j.oraloncology.2011.11.006. [DOI] [PMC free article] [PubMed] [Google Scholar]
- 45.Wan HY, Guo LM, Liu T, Liu M, Li X, Tang H. Regulation of the transcription factor NF-kappaB1 by microRNA-9 in human gastric adenocarcinoma. Mol Cancer. 2010;9:16. doi: 10.1186/1476-4598-9-16. [DOI] [PMC free article] [PubMed] [Google Scholar]
- 46.Guo LM, et al. MicroRNA-9 inhibits ovarian cancer cell growth through regulation of NF-kappaB1. FEBS J. 2009;276(19):5537–5546. doi: 10.1111/j.1742-4658.2009.07237.x. [DOI] [PubMed] [Google Scholar]
- 47.Zhuang G, et al. Tumour-secreted miR-9 promotes endothelial cell migration and angiogenesis by activating the JAK-STAT pathway. EMBO J. 2012;31(17):3513–3523. doi: 10.1038/emboj.2012.183. [DOI] [PMC free article] [PubMed] [Google Scholar]
- 48.Chen D, et al. LIFR is a breast cancer metastasis suppressor upstream of the Hippo-YAP pathway and a prognostic marker. Nat Med. 2012;18(10):1511–1517. doi: 10.1038/nm.2940. [DOI] [PMC free article] [PubMed] [Google Scholar]
- 49.Zhu L, et al. MicroRNA-9 up-regulation is involved in colorectal cancer metastasis via promoting cell motility. Med Oncol. 2012;29(2):1037–1043. doi: 10.1007/s12032-011-9975-z. [DOI] [PubMed] [Google Scholar]
- 50.Goto M, et al. Rap1 stabilizes beta-catenin and enhances beta-catenin-dependent transcription and invasion in squamous cell carcinoma of the head and neck. Clin Cancer Res. 2010;16(1):65–76. doi: 10.1158/1078-0432.CCR-09-1122. [DOI] [PMC free article] [PubMed] [Google Scholar]
- 51.Rodriguez-Pinilla M, et al. β-Catenin, Nf-κB and FAS protein expression are independent events in head and neck cancer: study of their association with clinical parameters. Cancer Lett. 2005;230(1):141–148. doi: 10.1016/j.canlet.2004.12.045. [DOI] [PubMed] [Google Scholar]
- 52.Chikazawa N, et al. Inhibition of Wnt signaling pathway decreases chemotherapy-resistant side-population colon cancer cells. Anticancer Res. 2010;30(6):2041–2048. [PubMed] [Google Scholar]
- 53.Yamada T, et al. Transactivation of the multidrug resistance 1 gene by T-cell factor 4/β-catenin complex in early colorectal carcinogenesis. Cancer Res. 2000;60(17):4761–4766. [PubMed] [Google Scholar]
- 54.Suzuki A, et al. Keratinocyte-specific Pten deficiency results in epidermal hyperplasia, accelerated hair follicle morphogenesis and tumor formation. Cancer Res. 2003;63(3):674–681. [PubMed] [Google Scholar]
- 55.Ito M, et al. Stem cells in the hair follicle bulge contribute to wound repair but not to homeostasis of the epidermis. Nat Med. 2005;11(12):1351–1354. doi: 10.1038/nm1328. [DOI] [PubMed] [Google Scholar]
- 56.Quintana E, Shackleton M, Sabel MS, Fullen DR, Johnson TM, Morrison SJ. Efficient tumour formation by single human melanoma cells. Nature. 2008;456(7222):593–598. doi: 10.1038/nature07567. [DOI] [PMC free article] [PubMed] [Google Scholar]
- 57.Herrero JI, et al. Nonmelanoma skin cancer after liver transplantation. Study of risk factors. Liver Transpl. 2005;11(9):1100–1106. doi: 10.1002/lt.20525. [DOI] [PubMed] [Google Scholar]
- 58.Dlugosz A, Merlino G, Yuspa SH. Progress in cutaneous cancer research. J Investig Dermatol Symp Proc. 2002;7(1):17–26. doi: 10.1046/j.1523-1747.2002.19631.x. [DOI] [PubMed] [Google Scholar]
- 59.Hildebrandt MA, et al. Hsa-miR-9 methylation status is associated with cancer development and metastatic recurrence in patients with clear cell renal cell carcinoma. Oncogene. 2010;29(42):5724–5728. doi: 10.1038/onc.2010.305. [DOI] [PubMed] [Google Scholar]
- 60.Ma L, Teruya-Feldstein J, Weinberg RA. Tumour invasion and metastasis initiated by microRNA-10b in breast cancer. Nature. 2007;449(7163):682–688. doi: 10.1038/nature06174. [DOI] [PubMed] [Google Scholar]
- 61.Kobielak A, Fuchs E. Links between α-catenin, NF-κB, and squamous cell carcinoma in skin. Proc Natl Acad Sci U S A. 2006;103(7):2322–2327. doi: 10.1073/pnas.0510422103. [DOI] [PMC free article] [PubMed] [Google Scholar]
- 62.Schlegelmilch K, et al. Yap1 acts downstream of alpha-catenin to control epidermal proliferation. Cell. 2011;144(5):782–795. doi: 10.1016/j.cell.2011.02.031. [DOI] [PMC free article] [PubMed] [Google Scholar]
- 63.Myers JN, Holsinger FC, Jasser SA, Bekele BN, Fidler IJ. An orthotopic nude mouse model of oral tongue squamous cell carcinoma. Clin Cancer Res. 2002;8:293–298. [PubMed] [Google Scholar]
- 64.Go C, et al. Aberrant cell cycle progression contributes to the early-stage accelerated carcinogenesis in transgenic epidermis expressing the dominant negative TGFβRII. Oncogene. 2000;19(32):3623–3631. doi: 10.1038/sj.onc.1203701. [DOI] [PubMed] [Google Scholar]
- 65.Li AG, Wang D, Feng XH, Wang XJ. Latent TGFβ1 overexpression in keratinocytes results in a severe psoriasis-like skin disorder. EMBO J. 2004;23(8):1770–1781. doi: 10.1038/sj.emboj.7600183. [DOI] [PMC free article] [PubMed] [Google Scholar]
- 66.Lakos G, et al. Targeted disruption of TGF-β/Smad3 signaling modulates skin fibrosis in a mouse model of scleroderma. Am J Pathol. 2004;165(1):203–217. doi: 10.1016/S0002-9440(10)63289-0. [DOI] [PMC free article] [PubMed] [Google Scholar]
Associated Data
This section collects any data citations, data availability statements, or supplementary materials included in this article.