

Abstract
High-throughput genomic technologies have identified biomarkers and potential therapeutic targets for ovarian cancer. Comprehensive functional validation studies of the biological and clinical implications of these biomarkers are needed to advance them toward clinical use. Amplification of chromosomal region 5q31–5q35.3 has been used to predict poor prognosis in patients with advanced stage, high-grade serous ovarian cancer. In this study, we further dissected this large amplicon and identified the overexpression of FGF18 as an independent predictive marker for poor clinical outcome in this patient population. Using cell culture and xenograft models, we show that FGF18 signaling promoted tumor progression by modulating the ovarian tumor aggressiveness and microenvironment. FGF18 controlled migration, invasion, and tumorigenicity of ovarian cancer cells through NF-κB activation, which increased the production of oncogenic cytokines and chemokines. This resulted in a tumor microenvironment characterized by enhanced angiogenesis and augmented tumor-associated macrophage infiltration and M2 polarization. Tumors from ovarian cancer patients had increased FGF18 expression levels with microvessel density and M2 macrophage infiltration, confirming our in vitro results. These findings demonstrate that FGF18 is important for a subset of ovarian cancers and may serve as a therapeutic target.
Introduction
Epithelial ovarian cancer is the fifth leading cause of cancer-related death among women and has the highest case-fatality rate among gynecologic cancers. In the United States, approximately 22,280 new cases and 15,500 deaths from ovarian cancer were estimated for 2012 (1). Serous tumors comprise about 70% of primary epithelial ovarian cancer, with epithelial cells resembling those of the fallopian tube. Although there has been an improvement in the 5-year survival rate for patients diagnosed with advanced disease, the long-term survival rate remains at 30% (2).
Due to insufficient power of clinicopathological features and traditional molecular predicators of outcome for serous ovarian cancer, high throughput technologies such as comparative genomic hybridization (CGH) and gene expression profiling have been proposed for identifying gene signatures or signaling pathways as clinically relevant diagnostic and prognostic biomarkers (3–6). Comprehensive functional validation studies on both biological and clinical levels are needed to understand the mechanistic basis for these biomarkers and to realize their full clinical significance and application.
In our previous study, oligonucleotide array CGH analysis on microdissected high-grade, advanced-stage serous ovarian tumor samples demonstrated the amplification of chromosome segment 5q31 to 5q35.3 as one of the most significant copy number abnormalities associated with poor overall survival (4). To identify candidate genes that drive tumorigenesis in this aberrantly amplified chromosome segment, genes located between 5q31 and 5q35.3 were compared with a prognostic gene expression signature generated by expression profiling in an additional series of 53 microdissected high-grade, advanced-stage serous ovarian tumor samples (5). FGF18 (located on chromosome 5q35.1) was identified as the gene possessing the strongest prognostic value in segment 5q31–5q35.3, making it a suitable candidate for further characterization.
FGF18 is a highly conserved (99% amino acid identity among human, mouse, and rat), 21.2-kDa glycosylated secretory protein. FGF18 shows a structural similarity to FGF8 and FGF17, but is distinct from the most commonly studied FGF1 and FGF2. Targeted disruption of FGF18 in mice is lethal beyond birth due to impaired skeleton development and alveologenesis, but Fgf1/Fgf2 double-knockout mice are fertile without any gross phenotypic defects (7, 8), suggesting unique roles of FGF18 in both embryonic and postnatal development. Acting as a mitogenic, chemotactic, and angiogenic factor, FGF18 is required for the development of bone, cartridge, hair, cardiovasculature, and alveolus (8–11). Nevertheless, the function of FGF18 has never been studied in the context of serous ovarian cancer.
In this study, we have demonstrated that FGF18 is upregulated in serous ovarian tumors compared with normal ovarian surface epithelium (OSE) by quantitative RT-PCR (qRT-PCR) and immunohistochemical (IHC) staining. In addition, increased expression of FGF18 mRNA and protein is associated with poor overall survival in patients. Ectopic expression and knockdown experiments confirmed the pronounced oncogenic effect of FGF18 on tumor growth and metastasis. Further analysis revealed the effect of FGF18 on angiogenesis and tumor-associated macrophages (TAMs) in vitro and in vivo. Furthermore, FGF18 expression markedly correlated with increased tumor microvessel density and TAM infiltration in samples from serous ovarian cancer patients. Therefore, FGF18 plays important roles in promoting tumor progression by modulating the activity of both tumor cells and the tumor microenvironment and may serve as a potential therapeutic target.
Results
FGF18 predicts survival in patients with high-grade, advanced-stage serous ovarian cancer.
In the expression profiling data set generated by Mok et al. (5), with 53 microdissected, high-grade, advanced-stage serous ovarian adenocarcinoma samples, FGF18 possessed the highest prognostic potential by COX regression analysis among genes located in chromosome segment 5q31–5q35.3. Amplification of this chromosomal segment strongly associated with poor outcome in serous ovarian cancer patients (4). Kaplan-Meier analysis of the same 53 samples with median cut and log-rank test showed a significant difference in overall survival time (P = 0.0002), with a Cox hazard ratio of 3.277 (P = 0.0003, 95% CI: 1.671–6.425), linking FGF18 with poor prognosis (Figure 1A, estimated mean and median survival listed in Supplemental Table 1; supplemental material available online with this article; doi: 10.1172/JCI70625DS1). To ascertain whether expression of FGF18 might be contributing toward ovarian tumorigenesis, the 53 high-grade serous cancer (HGSC) specimens were compared with 10 normal OSE brushings. FGF18 was upregulated 4.1-fold in serous ovarian tumor samples (Figure 1B, cumulative intensity of all probe sets, P = 8.7 × 10⁻⁷, t test). The level of FGF18 in nonserous ovarian cancers was also investigated using available expression array data sets by comparing the sum intensity of all probe sets corresponding to FGF18. In a data set consisting of 41 serous, 37 endometrioid, 13 mucinous, 8 clear cell ovarian carcinomas, and 4 individual normal ovary samples (12), significant upregulation of FGF18 was found in both serous and clear cell subtypes compared with normal ovarian tissue (1.77- and 1.87-fold, P = 0.001 and 0.014 respectively). In contrast, no significant FGF18 upregulation was observed in mucinous and endometrioid subtypes (1.18- and 1.32-fold, P = 0.156 and 0.216 respectively). Moreover, in this cohort, the FGF18 level in serous tumors was considerable higher than that in mucinous tumors (P = 0.010) and endometrioid tumors (P = 0.050), but showed no significant difference from clear cell tumors (P = 0.829) (Supplemental Figure 1A). Consistently, the significant upregulation of FGF18 in clear cell ovarian carcinoma was also demonstrated in another data set consisting of 10 microdissected clear cell ovarian carcinomas and 10 normal OSEs (13) (7.75-fold, P = 0.044) (Supplemental Figure 1B). Therefore, the upregulation of FGF18 in epithelial ovarian cancer may be histotypically specific rather than a general neoplastic event. Nevertheless, considering the relatively low frequency of nonserous ovarian cancers (<30%), annotated data is not available for investigating the effect of FGF18 expression on clinical parameters in nonserous ovarian cancers. We thus focus the function of FGF18 in serous ovarian cancer in this work.
Figure 1. Identification of FGF18 as a prognostic gene in high-grade advanced-stage papillary serous ovarian tumors.

(A) Kaplan-Meier analysis of FGF18 expression in patients in 3 independent sets of serous ovarian cancer samples (Mok et al., ref. 5; Spentzos et al., ref. 3, and TCGA Project, ref. 6). Analysis was done by median cut with the P value of log-rank test presented for each set. Black lines, samples with low FGF18; red broken lines, samples with high FGF18; +, censored samples. (B) Overexpression of FGF18 in ovarian HGSC (n = 53) over normal OSE (n = 10) and FTE (n = 24). Array data import and normalization were performed by BRB array tools 4.1 with JustRMA algorithm. Values on y axis represent the cumulative intensity of all FGF18 probe sets. (C) CGH analysis of 72 serous ovarian tumors showed an increased DNA copy number for chromosome segment 5q31.3–5q35.3 in approximately 25% of the samples (upper panel). Chromosome 5 profiles of 2 representative tumors with the detail of a 7.3-Mb locus (chromosome 5 distance: 170.3 Mb–177.6 Mb) containing FGF18 and FGFR4 (lower panel). Copy number was presented by log2 minus 1 (value of 0 mean diploid, 1 mean 4 copies, 2 mean 8 copies). FGF18 and FGFR4 are amplified to at least 4 copies among the 5615 probes in the x axis. (D) qPCR correlation with array CGH data for all 60 available DNA samples of the 72 serous tumors. Average qPCR fold changes were generated by 3 independent primer sets for FGF18 and FGFR4. Correlation was checked by Spearman’s ρ test.
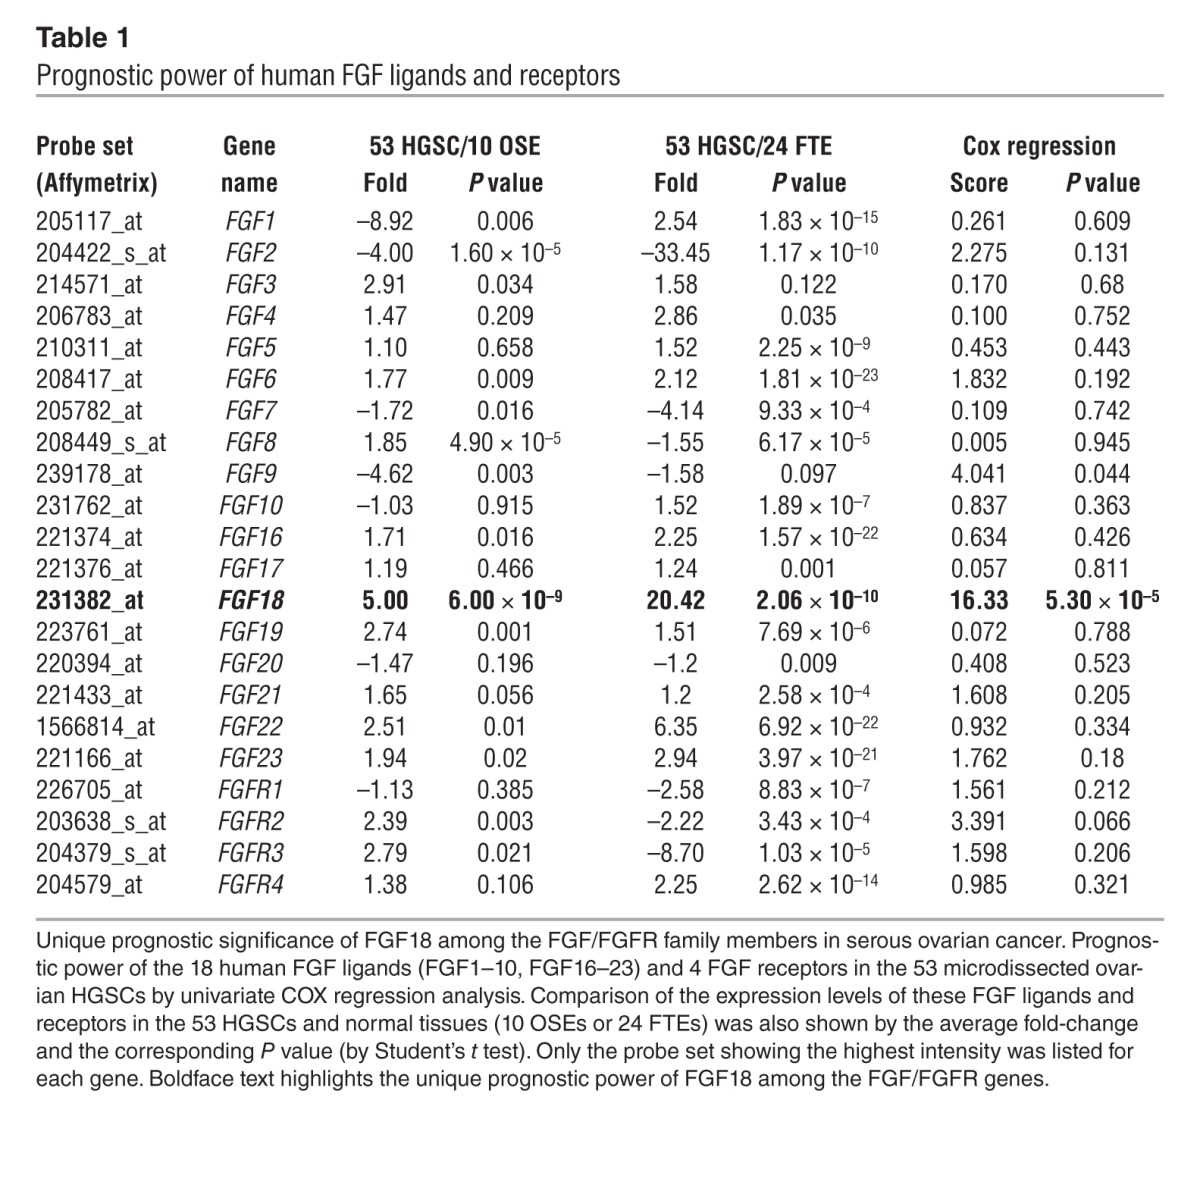
In addition to normal ovarian epithelium, FGF18 showed a likewise overexpression in HGSC over normal fallopian tube epithelium (FTE), an alternative precursor of serous ovarian cancer (14, 15). In an independent data set consisting of 24 microdissected normal FTEs, 6 fallopian HGSCs and 7 ovarian HGSCs (14), FGF18 upregulation over normal FTEs was demonstrated in the 13 HGSCs (3.7-fold, P = 0.013) or 7 ovarian HGSCs (4.9-fold, P = 0.003). We further compared the FGF18 level in the 24 FTE samples with the 53-tumor panel, since both data sets were based on the same array platform (Affymetrix Human Genome U133 Plus 2.0). In this comparison, FGF18 showed a 5.1-fold overexpression in the 53 ovarian HGSCs over the 24 FTEs (P = 4.3 × 10⁻⁹) (Figure 1B). Finally, among the 18 members of the human FGF family proteins and 4 FGF receptors, FGF18 was the only gene showing both tumor-related upregulation and strong correlation with poor prognosis in the 53-tumor panel (Table 1), suggesting a potentially unique role for FGF18 in ovarian tumorigenesis.
Table 1.
Prognostic power of human FGF ligands and receptors
In order to validate the microarray data, qRT-PCR for FGF18 was performed on 45 available RNA samples from the 53-tumor panel and 6 normal OSE, confirming the overexpression of FGF18 in tumor tissue (3.9-fold, P = 4.1 × 10⁻⁵, t test). Survival analysis was done in a fashion analogous to the microarray analysis. A nonparametric log rank test (by median cut, P = 0.021) as well as COX regression analysis (P = 0.004) showed a significant survival difference and confirmed the microarray data. Analysis of another independent data set of 70 epithelial ovarian cancer patients (3), also showed a significant prognostic value of FGF18 through Kaplan-Meier analysis (median cut, log-rank test, P = 0.026, Figure 1A) with a Cox hazard ratio of 2.023 (P = 0.0283; 95% CI: 1.064–3.844). Finally, similar results were obtained by analyzing The Cancer Genome Atlas data set (6), in which FGF18 showed a 1.72-fold upregulation (P = 3.35 × 10⁻⁹) compared with the 8 normal samples. Given the overall low intensity of the probe sets corresponding to FGF18, we used Kaplan-Meier analysis to compare the outcomes of patients in the highest and lowest 20% for FGF18 expression in a group of 494 women with serous ovarian cancer. We observed a significant association of FGF18 with poor overall survival (log-rank test P = 0.019, Figure 1A; Cox hazard ratio: 1.612; P = 0.0194; 95% CI: 1.076–2.415).
To further confirm the amplification of the FGF18 gene in serous ovarian cancer patients, array CGH analysis was performed on an independent cohort of 72 patients from Massachusetts General Hospital (MGH) between the years 1991 and 2008 (ref. 16 and Figure 1C and Supplemental Figure 2). Compared with the previous study (4), a similar rate of 5q31.3–5q35.3 amplification was observed in approximately 25% of the patients and an average copy number of 4 was shown in both FGF18 and its potential receptor FGFR4 (located in chromosome 5q35.2, Figure 1C and Supplemental Figure 2). This observation was further validated by qPCR analysis correlating the amplification of FGF18/FGFR4 loci with CGH copy number (Figure 1D).
To test the prognostic value of FGF18 protein levels in serous ovarian cancer, IHC was performed in an independent formalin-fixed, paraffin-embedded–based (FFPE-based) tissue microarray consisting of 47 benign ovarian cysts and 209 high-grade, advanced-stage ovarian serous adenocarcinomas with overall survival data. FGF18 protein staining intensity increased from low in benign cysts to strongly positive in a subset of high-grade tumors (1.98-fold, P < 0.0001) (Figure 2, A–E). In addition, Kaplan-Meier analysis correlating FGF18 staining intensity with overall patient survival demonstrated significant prognostic power of FGF18 as a marker of poor outcome (Figure 2F, Cox hazard ratio: 1.742; P = 0.0017; 95% CI: 1.226–2.474).
Figure 2. Validation of the prognostic significance of FGF18 in high-grade, advanced stage serous ovarian cancers through an independent tissue microarray (TMA).

(A–E) Independent TMA validation of FGF18 expression in 47 benign ovarian cysts and 209 high-grade, late-stage serous ovarian cancers. A membrane and cytoplasmic staining pattern was observed for FGF18. Semiquantitative staining intensity evaluation indicated significant upregulation of FGF18 in high-grade serous ovarian tumors (C and D) compared with benign ovarian cysts (A and B). Scale bars: 100 μm. Arrowheads indicate the epithelial layer of the benign ovarian cyst; T and S designate tumor and stromal portions respectively. (F) The impact of FGF18 on overall patient survival in the 209 high-grade advanced-stage serous ovarian cancers on the validation TMA. Kaplan-Meier analysis was employed with the score of 6 (the highest score of FGF18 in benign ovarian cysts) out of 12 accepted as the cut-off. A statistically significant difference was observed indicating a correlation between FGF18 expression and poor prognosis. Black lines, samples with low FGF18; red broken lines, samples with high FGF18; +, censored samples.
From the 209 samples on the tissue array, we have retrieved 192 samples with clinical annotation of the debulking status, tumor grade (2 or 3), and FIGO tumor stage (III or IV). Univariate Kaplan-Meier analysis of these 192 samples revealed significant impact on patient overall survival from the FGF18 level (Cox hazard ratio: 1.941; P = 0.0003; 95% CI: 1.344–2.803), debulking surgery (Cox hazard ratio: 1.457; P = 0.071; 95% CI: 0.966–2.199), and tumor FIGO stage (Cox hazard ratio: 1.975; P = 0.002; 95% CI: 1.268–3.078), but not the tumor grade (Cox hazard ratio: 0.816; P = 0.423; 95% CI: 0.493–1.349) (Supplemental Figure 3). Multivariate analysis through Cox regression model with all 4 parameters (FGF18 level, debulking status, FIGO stage, and tumor grade) demonstrated the independent prognostic significance of FGF18 (hazard ratio: 2.332; P = 0.00004; 95% CI: 1.558–3.491), which is not linked to known prognostic factors such as debulking status and FIGO stage (Supplemental Table 2). Similarly, the prognostic significance of FGF18 on overall survival was also demonstrated through Kaplan-Meier analysis after adjusting debulking status (P = 0.0013, Supplemental Figure 4A and Supplemental Table 3) and FIGO stage (P = 0.0001, Supplemental Figure 4B) (unadjusted P = 0.0003, log-rank test). Moreover, to avoid the subjectivity of cut-off selection, we also viewed the FGF18 IHC score as a continuous variant for Cox regression analysis. Statistical significance for FGF18 as a prognostic factor was observed in univariate analysis (P = 0.0071) as well as multivariate analysis adjusted for debulking (P = 0.0196), FIGO stage (P = 0.0024), or both (P = 0.0047).
FGF18 confers oncogenic effects on ovarian cancer cells in vitro and in vivo.
To explore the mechanism by which FGF18 overexpression modulates ovarian cancer cell biology, we induced ectopic expression and knocked down FGF18 with lentiviral-based vectors. A224 and OVCA429 cell lines were selected for overexpression studies based on their relatively low endogenous FGF18 expression (Figure 3, A and B). Cells were transduced with a FGF18-encoding lentivirus, or a control lentivirus encoding red fluorescent protein (RFP). Overexpression of FGF18 was confirmed by Western blot analysis on total cell lysate and conditioned medium produced by the infected cells. The functional integrity of ectopically expressed FGF18 was confirmed by the increased activation of FRS2 (through phosphorylation on tyrosine 196), a pivotal adaptor protein specific for the signal transduction of FGF receptors (Figure 3B and ref. 17). Despite minimal effects on cellular proliferation (Supplemental Figure 5), ectopic FGF18 overexpression significantly increased cellular migration and invasion of both A224 and OVCA429 cells (Figure 3C). FGF18 is a member of the FGF family of ligands that have profound effects on blood vessel formation in physiological development (9–11). To test the potential role of FGF18 in angiogenesis, we investigated the effect of FGF18 on HUVEC motility and tube formation. Recombinant human FGF18 (100 ng/ml) produced a significant chemotactic effect on HUVEC migration (Figure 3D) and stimulated tube formation by increasing the tube length (Supplemental Figure 6A). Similarly, conditioned medium derived from A224 or OVCA429 cells with FGF18 overexpression significantly promoted HUVEC migration compared with the conditioned medium from RFP control cells (Figure 3D and Supplemental Figure 6B). Administration of a pan-FGFR inhibitor PD173074 at 100-nM concentration completely blocked the effect of recombinant FGF18 on HUVEC cells, but only partially blocked the effect of conditioned medium from FGF18-overexpressing A224 cells. This phenomenon may be due to elevated secretion of other angiogenic factors in response to FGF18 overexpression (Figure 3D).
Figure 3. Oncogenic effects of FGF18 on ovarian cancer cells in vitro.

(A) qRT-PCR analysis of FGF18 from total RNA isolated from 1 normal ovarian surface epithelial culture (HOSE), 2 immortalized HOSE cultures (IOSE), and 10 ovarian cancer cell lines. Fold-change is calculated relative to HOSE. (B) Ectopic FGF18 or RFP (as control) overexpression by lentiviral vectors. Proper processing and secretion of FGF18 were demonstrated through increased phosphorylation of FRS2 and Western blot analysis of the conditioned medium. (C) FGF18 overexpression stimulates migration and invasion in OVCA429 and A224 cells. (D) Recombinant FGF18 (100 ng/ml) and conditioned medium from FGF18-overexpressing A224 cells enhances migration of HUVEC cells. To block the effect of FGF18, a pan-FGFR inhibitor PD173074 was used at 100 nM. (E) Ectopic FGF18 knockdown by 2 lentiviral shRNA constructs that target different regions of FGF18 but not other FGFs. Vector coding an N/S shRNA was used as control. (F) FGF18 knockdown decreases migration and invasion of SKOV3 cells. *P < 0.05; **P < 0.001. Mean ± SD was from 3 independent experiments.
Conversely, inhibition of FGF18 expression by lentivirus-delivered shRNA (nontargeting scrambled [N/S] shRNA as control) in SKOV3 cells (Figure 3E) resulted in no significant difference in proliferation (Supplemental Figure 5), but decreased cell migration and invasion (Figure 3F).
To investigate the effects of FGF18 on ovarian tumor growth in vivo, xenograft studies with SCID mice were performed through s.c. or i.p. injection. In contrast to RFP-expressing A224 cells that failed to develop visible tumor (4-week period for s.c. and i.p.), A224 with FGF18 overexpression established robust xenografts 1 week (s.c.) or 4 weeks (i.p.) after the injection (Figure 4, A and B). Similar results were observed with FGF18-overexpressing SKOV3 cells (Figure 3B and Figure 4C), which showed significantly higher xenograft mass in both s.c. (Figure 4A) and i.p. models (average weights of i.p. tumors at 4 weeks from 5 mice are 0.26 ± 0.16 g for SKOV3-RFP vs. 3.25 ± 1.37 g for SKOV3-FGF18, P = 0.002). Although in vitro proliferation assays showed no significant effect of FGF18 on cell growth (Supplemental Figure 5), IHC staining of Ki-67 indicated enhanced cell proliferation in FGF18-driven xenografts (P < 0.0001, Figure 4C), suggesting a potential role of FGF18 in modulating tumor microenvironment. To address this issue, microvessel density was measured by IHC staining of murine CD31. Consistent with the in vitro observation, increased infiltration of CD31-positive microvessels in tumor stroma was observed in response to increased FGF18 (P = 0.0004, Figure 4C). These observations suggest that angiogenesis contributes to the growth of xenografts generated by FGF18-overexpressing SKOV3 cells.
Figure 4. Oncogenic effects of FGF18 on ovarian cancer cells in vivo.

(A) Ectopic FGF18 overexpression promotes tumorigenicity of ovarian cancer cells s.c. inoculated in SCID mice (5 mice in each group; triangles, RFP-overexpressing cells; circles, FGF18-overexpressing cells). (B) FGF18 overexpression enables the growth of A224 cells in the i.p. mouse xenograft model (5 mice in each group). Representative photos of xenograft nodules (bottom images) are indicated by white arrows. Control RFP-overexpressing cells (top images) failed to develop any visible xenograft during the 4-week period. Scale bars: 0.5 cm (C) IHC staining of i.p. xenografts derived from SKOV3 cells with FGF18 overexpression and control RFP overexpression. Typical sections stained for FGF18, Ki-67, murine CD31, and murine F4/80 were shown. Arrows indicate CD31+ microvessels. Quantification of the IHC from 5 mice in each group was presented as well (P < 0.001 in all cases). Scale bars: 25 μm (FGF18); 100 μm (Ki-67, CD31, and F4/80) (D) FGF18 knockdown reduces the in vivo tumorigenicity of SKOV3 cells inoculated i.p. in SCID mice (9 mice for N/S shRNA as control, 5 mice each for FGF18 shRNA #1 and FGF18 shRNA #2). (E) Pharmacologic inhibition of FGFRs by daily i.p. injection of PD173074 at a dosage of 25 mg/kg/d significantly retards the i.p. growth of FGF18-overexpressing A224 cells. Vehicle (20% DMSO) served as a control. Statistically significant differences were indicated for tumor mass from 5 mice in each group.
Consistently, knockdown of FGF18 in SKOV3 significantly suppressed the growth of i.p. xenografts in SCID mice (P = 0.005, ANOVA) (Figure 4D). Compared with N/S shRNA, FGF18 shRNA significantly decreased the Ki-67 index, microvessel density, and macrophage infiltration in SKOV3-derived xenografts (Supplemental Figure 7).
FGF18 activates multiple signaling events as revealed by expression profiling.
To explore the FGF18-mediated downstream events at the mechanistic level, we used the Affymetrix Human U133 Plus 2.0 GeneChip array to perform expression profiling for a series of RNA samples isolated from A224 cells overexpressing FGF18 or RFP as control in triplicate. A total of 704 probe sets were identified as significantly differentially expressed (more than 2-fold, P < 0.001), including 3 probe sets for FGF18 showing the largest fold-change (Figure 5A and Supplemental Table 4). Changes in transcript levels seen in the microarray data were further validated by qRT-PCR on independent RNA samples with primer sets specific for 14 randomly selected genes with different ranges of fold change in A224 cells (AREG, PLAT, PLAU, HMGA2, CXCL1, CXCL2, IL6, IL8, VEGFC, TGM2, CD73, CFH, and CFI) (Figure 5B). Student’s t test showed that all 14 genes were differentially expressed (P < 0.01). Further validation focused on several FGF18-responsive soluble growth factors and cytokines due to their known oncogenic roles in ovarian tumorigenesis. Significant mRNA upregulation of these genes in response to FGF18 overexpression was observed in OVCA429 and SKOV3 cells (Supplemental Figure 8). Conversely, decreased expressions of AREG, CXCL1, IL1A, IL6, and IL8 were observed in SKOV3 cells in response to FGF18 knockdown, supporting that these are FGF18-responsive genes in ovarian cancer cells (Figure 5C).
Figure 5. Identification of putative FGF18-responsive genes in ovarian cancer cells.

(A) Identification of FGF18-responsive genes in A224 cells by comparing A224 cells with ectopic overexpression of FGF18 or RFP (as control) through microarray analysis with Affymetrix Human U133 Plus 2.0 chips. (B) qRT-PCR validation of randomly selected genes identified in the microarray analysis comparing A224 cells with ectopic overexpression of FGF18 or RFP. qRT-PCR was performed on 3 independent RNA isolates from the respective cell type and plotted next to the fold-change revealed by microarray analysis. (C) Downregulation of FGF18-responsive genes by FGF18 shRNA in SKOV3 cells. N/S shRNA was used as control. Three independent RNA isolates were checked by qRT-PCR. Significant change (P < 0.05) was observed in both FGF18 shRNAs for each gene checked.
We analyzed the 704 differentially expressed probe sets and identified several putative pathways. These included EGF signaling (EREG, AREG), TGF-β signaling (INHBA, TNC), JAK/STAT signaling (IL6, IL7, CSF2, IL15RA, HMGA2), NF-κB signaling (IL1A, IL8, IRAK2, NFKB2, NFKBIA), and tissue remodeling (PLAT, PLAU, PLAUR). Induction of several soluble angiogenic factors such as VEGFC, EREG, AREG, CXCL1, CXCL2, CXCL8/IL8, and TNC was also discovered by microarray analysis, indicating the potential role of FGF18 in modulating the tumor microenvironment and providing a reasonable explanation for the observation shown in Figure 3D.
FGFR4 participates in FGF18 signaling in ovarian cancer cells.
All 18 mammalian FGF ligands exert their functions by activating 1 or more of the 4 distinct cell-surface receptor tyrosine kinases (FGFR1–FGFR4) (17). Administration of PD173074, a pan-FGFR inhibitor, consistently blocked the FGF18-activated phosphorylation of FRS2 and Erk1/2 in both A224 and HUVEC cells (Figure 6A and Supplemental Figure 9). In addition, FGFR blockade by PD173074 inhibited FGF18-induced migration and tube formation in HUVECs (Figure 3D and Supplemental Figure 6A) as well as the FGF18-related cytokine production in A224 cells (Figure 6C). Similarly, i.p. administration of PD173074 at a dosage of 25 mg/kg/d for 7 days significantly reduced the tumor burden of the i.p. xenograft of FGF18-overexpressing A224 cells (Figure 4E).
Figure 6. Identification of signaling events contributing to the effect of FGF18 on A224 cells.

(A) Recombinant human FGF18 activates FRS2 and Erk1/2 signaling in A224 cells, which can be reversed by pan-FGFR inhibitor PD173074 (50 nM) or siRNA-mediated FGFR4 knockdown (15 nM, 48 hours pretreatment, N/S siRNA as control). (B) Activation of FGFR4 by treatment of A224 cells with rhFGF18 for 10 minutes. Total cell lysate was immunoprecipitated by a phosphorylated-tyrosine antibody 4G10 and immunoblotted with antibodies against total FGFR4, total Erk1/2 (as a positive control), and total p38 (as a loading control). (C) Inhibitory effect of pan-FGFR inhibitor PD173074 (100 nM, 48 hours, labeled as PD) on the cytokine production in A224 cells overexpressing RFP (white bars) or FGF18 (black bars). Treatment of cells with 0.1 μl/ml of DMSO was used as control. (D) Effect of FGFR4 siRNA (15 nM, 48 hours) on the cytokine production in A224 cells overexpressing RFP (empty bars) or FGF18 (solid bars). N/S siRNA treatment (15 nM, 48 hours) was used as control. Bar graph represents mean fold change ± SD from 3 independent experiments.
It has been demonstrated that FGFR4, along with FGFR3c, is a receptor for FGF18 (18). We hypothesized that FGFR4 may be an important mediator of FGF18 signaling in ovarian cancer pathogenesis due to physical proximity of the 2 genes within the same amplicon along 5q31–5q35.3 (Figure 1C). In A224 cells, activation of FGFR4 through increased tyrosine phosphorylation was observed upon rhFGF18 treatment, which was effectively blocked by PD173074 (Figure 6B), indicating the potential involvement of FGFR4 in FGF18 signaling. To further validate the receptor specificity between FGF18 and FGFR4 in A224 cells, we specifically “knocked-down” FGFR4 by siRNA (Supplemental Figure 10) and observed decreased FGF18 signaling (Figure 6A). FGFR4 siRNA also blocked the FGF18-induced cytokine production (Figure 6D). Summation of these results implicates FGFR4 as a mediator of FGF18 signaling in serous ovarian cancer cells. The coamplification of both the ligand (FGF18) and the receptor (FGFR4) (Figure 1C) may contribute to the hyperactivation of FGF signal, mediating the 5q31–5q35.3 amplicon–related poor patient survival.
FGF18 promotes cytokine production via NF-κB activation.
One of the most striking features revealed by transcriptome analysis was the induction of cytokines and chemokines in response to FGF18 overexpression. Considering the importance of NF-κB signaling in the production of cytokines and chemokines (19) and based on results obtained from microarray data analysis, we hypothesized that NF-κB activation may mediate FGF18 downstream events in our system. As shown in Figure 7A, application of an NF-κB transactivation inhibitor QNZ reversed FGF18 overexpression-induced upregulation of IL-1A, IL-6, IL-8, CXCL1, and CXCL2 in A224 cells. In contrast, QNZ failed to inhibit the induction of AREG, a growth factor that is not associated with NF-κB signaling (20). Similarly, FGF18 overexpression-induced cytokine production was also susceptible to SN-50 (a competitive substrate against NF-κB nuclear translocation) and TPCA-1 (an IKKβ inhibitor), indicating the involvement of NF-κB dimer translocation and IκB degradation in FGF18-mediated NF-κB activation (Figure 7A). Consistently, nuclear internalization of the NF-κB component p65/Rel-A and p50/NFKB1 could also be observed in A224 cells with FGF18 overexpression (Figure 7B). Taken together, these results suggest that FGF18 increases cytokine production through the canonical NF-κB pathway.
Figure 7. FGF18 as a tumor microenvironment modulator through NF-κB pathway-related cytokine production.

(A) Effects of NF-κB pathway inhibition on the cytokine production in A224 cells overexpressing RFP (white bars) or FGF18 (black bars). NF-κB pathway inhibitor QNZ (20 nM), SN-50 (18 μM), or TPCA-1 (1 μM, specifically inhibits IKKβ but not IKKα) was applied for 48 hours. DMSO (0.1 μl/ml) or water (solvent for SN-50, labeled as UN) was used as control. (B) Ectopic FGF18 overexpression induces nuclear internalization of NF-κB components p65/Rel-A and p50/NFKB1 in A224 cells. The purity and loading of each compartment were indicated by GAPDH (cytoplasmic marker) and Histone H3 (nuclear marker). (C) FGF18 overexpression enhances the chemotactic effect of A224 cell–derived conditioned medium on monocytic THP-1 cells. Adding 100 nM PD173074 to harvested conditioned medium shows no significant effect (untreated THP-1 cells used as control unless specified). *P < 0.05; **P < 0.001. (D) FGF18 overexpression enhances the M2-polarizing potential of A224 cells. THP-1 cells were cocultured with A224 cells overexpressing RFP or FGF18 for 7 days before RNA harvest. qRT-PCR was performed to determine the expression changes of macrophage differentiation markers (for example, IL-10 for oncogenic M2 differentiation, IL-12A for tumor suppressive M1 differentiation) with untreated THP-1 cells as control. The THP-1–polarizing potential from RFP- or FGF18-overexpressing A224 cells was compared through the relative fold-change of each gene and associated P value (by paired t test). Bar graph represents mean fold change ± SD from 3 independent experiments.
FGF18 induces the infiltration of monocytes/macrophages and their M2 polarization.
We hypothesized that FGF18 may play a role in modulating the tumor microenvironment through an effect on TAMs because the FGF18-responsive cytokines (CXCL1, CXCL2, IL-1, IL-6, and IL-8) are strong chemotactic factors for macrophages/monocytes (21, 22). High TAM infiltration has been linked to enhanced metastasis, immunosuppression, angiogenesis and poor prognosis in ovarian cancer (23, 24). In the SKOV3 xenograft model, FGF18 overexpression produced a tumor stroma greatly enriched with TAMs (determined by murine TAM marker F4/80, Figure 4C, P = 0.007), while FGF18 knockdown significantly reduced the murine macrophage infiltration (Supplemental Figure 7). Consistently, conditioned medium from A224 cells with FGF18 overexpression also showed significantly higher chemotactic effect on monocytic leukemia cell line THP-1 in a Boyden chamber assay compared with the conditioned medium from control RFP-overexpressing cells (Figure 7C). Addition of 100 nM PD173074 after harvest showed no significant impact on the chemotactic potential of the conditioned medium from either RFP- or FGF18-overexpressing cells, indicating that enhanced THP-1 migration was dependent on FGF18-induced soluble factors rather than the secreted FGF18 itself.
Once recruited to the tumor tissue, monocytic cells undergo differentiation and mature as M2 macrophages under the influence of tumor cells. The M2 polarization is generally accompanied by the production of trophic and angiogenic growth factors (for example, VEGF, IL-8, IL-1, CXCL1, and CCL2), ECM degrading proteases (for example, MMP2 and MMP9), and immunosuppressors (for example, IL-10 and downregulation of IL-12) by the TAMs to provide a microenvironment conducive to tumor growth and angiogenesis. This was demonstrated by coculture of THP-1 cells with RFP-overexpressing A224 cells in a Transwell system, which triggered the differentiation of THP-1 cells into TAM-like cells that displayed the above-mentioned phenotypic characteristics of M2 macrophages (Figure 7D). Coculture with FGF18-overexpressing A224 cells further potentiated the M2 polarization of THP-1 cells, as reflected by the additional significant enhancement of the M2 characteristic factors tested (Figure 7D). Similar results were obtained by comparing the effect on THP-1 differentiation from SKOV3 cells with RFP or FGF18 overexpression (Supplemental Figure 11). In contrast, directly treating THP-1 cells with rhFGF18 only showed minimal activation of FGF signaling or induction of M2-polarization markers (Supplemental Figure 12). Conversely, adding 100 nM PD173074 to the coculture system significantly abolished the M2 polarizing potential of FGF18-overexpressing A224 cells but not RFP-overexpressing A224 cells (Supplemental Figure 13). FGF18 knockdown also ameliorated the M2-polarizing potential of SKOV3 cells (Supplemental Figure 14). Therefore, despite posing minimal direct effects, FGF18 is required for the M2-polarizing potential of ovarian tumor cells. Taken together, through the accumulation and polarization of TAMs, elevated FGF18 in ovarian tumor cells potentiates dynamic changes in the tumor microenvironment and promotes tumor progression.
FGF18 expression is significantly correlated with microvessel density and TAM infiltration in serous ovarian cancer.
Given the pronounced biologic effect of FGF18 on the tumor microenvironment, we hypothesized that elevated FGF18 expression might be associated with enhanced angiogenesis and TAM infiltration in tumors from ovarian cancer patients. IHC staining was performed on FFPE samples of 25 high-grade, late-stage serous ovarian cancers with antibodies against FGF18, CD31 (marker of microvessels), and CD163 (marker of M2-polarized macrophages) (Figure 8A). Statistically significant correlations were obtained between FGF18 expression and the presence of CD31+ microvessels and CD163+ M2 TAMs (P < 0.0001 in both cases). Furthermore, IHC staining of a tissue microarray with 209 serous ovarian cancers revealed a similar correlation between FGF18 concentration and CD31+ microvessel density (P < 0.0001) (Figure 8B). These data suggest that FGF18 modulates tumor microenvironment by promoting neovascularization as well as recruitment of M2-polarized TAMs in serous ovarian cancer patients.
Figure 8. FGF18 expression correlates with angiogenic activity and the M2 macrophage infiltration in serous ovarian cancer patients.

(A) FGF18 expression correlates with the numbers of CD31+ microvessels and CD163+ M2-polarized TAM in a cohort of 25 serous ovarian tumor samples. Typical staining results from 3 patients were shown. Scale bars: 100 μm. FGF18 was noted to have membrane and cytoplasmic staining under high magnification. Scale bar: 25 μm. FGF18 intensity was scored semiquantitatively and plotted as the x axis. The y axis indicates the number of CD31+ microvessels or CD163+ TAMs per low power field. Statistical significance was checked by Spearman’s ρ test. (B) Correlation between FGF18 and microvessel density in the validation tissue array with 209 high-grade, late-stage serous ovarian cancers. A semi-quantitative grading system was used to evaluate CD31 staining in the tissue array. Tissue sections representative of the CD31 grading system (upper panel) and corresponding FGF18 staining (lower panel) are shown. Scale bars: 100 μm. Statistical evaluation of the correlation between FGF18 level and CD31 score is shown by Spearman’s ρ test on the right.
Discussion
In this study, we provided mechanistic evidence in vitro and in vivo to delineate the oncogenic role of FGF18 in serous ovarian cancer as a prognostic and therapeutic biomarker. By combining our previous CGH work with gene expression profiling in high-grade serous ovarian tumor samples, we have identified FGF18 as an independent survival-associated gene contributing to the prognostic impact of 5q31–5q35.3 amplicon. In addition to gene amplification, our IHC study demonstrated FGF18 overexpression in approximately 50% of high-grade serous tumor cases compared with benign cysts (Figure 2, A–E). We therefore expect additional transcriptional or posttranscriptional mechanisms to contribute to elevated FGF18 in serous ovarian cancers. Although the detailed mechanism is still unknown, it has been demonstrated physiologically that FGF18 expression can be upregulated by intracellular calcium signaling (25), which is also frequently hyperactivated in neoplastic contexts. Second, FGF18 was mainly observed in epithelial tumor cells rather than the stromal component in our IHC studies. However, we did find cases showing substantial positivity in tumor stroma, indicating the potential contribution from stroma-derived FGF18 to ovarian tumorigenesis through paracrine release.
Functionally, FGF18 regulates both tumor cells and tumor microenvironment to facilitate the progression of serous ovarian cancer. In agreement with our in vitro and in vivo data, correlation between FGF18 expression level and clinicopathological features such as microvessel density, tumor-associated macrophage infiltration, and overall patient survival further validated its prognostic value. In addition, pathway analysis also suggested a systematic contribution from deregulated FGF18 to the aberrant signaling pathways responsible for the malignancy. Of the 7 signaling pathways summarized as activated in greater than 50% of ovarian cancers (2), 3 overlap with the potential FGF18 downstream signals. These pathways include MAPK/ERK (FGF18/FGFR, EREG/EGFR, or AREG/EGFR), IL-6R/JAK/STAT (IL6, IL7, IL15RA, and HMGA2), and NF-κB. Furthermore, FGF18-induced upregulation of FZD10, JAG1, HES1, SOX9, and HMGA2 in A224 cells may also indicate a possible relationship between FGF18 signaling and Wnt, Notch, Hedgehog, and epithelial-mesenchymal transition pathways (26, 27).
Activation of NF-κB pathway has been shown to be crucial for the progression of ovarian cancer (28). In this study, we have demonstrated that FGF18-driven NF-κB activation upregulates various proinflammatory cytokines and chemokines including IL-1, IL-6, IL-8, CXCL1, and CXCL2 to provide a microenvironment for tumor growth (reviewed in refs. 29, 30). Canonical NF-κB activation by IKKβ was also shown and is likely stimulated by upstream signaling such as MAPK/ERK, initiated by FGF18 (31). Additionally, the FGF18-mediated upregulation of HMGA1 and HMGA2 (Supplemental Table 4, Figure 5, and Supplemental Figure 8) as DNA-binding adaptor and NF-κB transactivation enhancer (32–34) may also contribute to the enhanced NF-κB activity in response to FGF18 overexpression and will require further investigation.
Besides direct action in ovarian tumor cells, FGF18-mediated events also directly or indirectly modulate the stroma, in particular the vasculature and TAMs, to facilitate the colonization and expansion of tumor cells. Expansion and metastasis of ovarian cancer requires angiogenesis to provide oxygen, other essential nutrients, and possible routes for local and distant dissemination. In addition, the proinflammatory state and corresponding infiltration of TAMs has been shown to be influenced by paracrine signaling at multiple steps of tumor progression and neoplastic angiogenesis (23, 24). Our study revealed an FGF18-mediated orchestration, with contributions from both tumor and stromal cells, that modulates the profile of secretory molecules in the neoplastic microenvironment. These molecules include growth factors (AREG, EREG) (35), proangiogenic growth factors (VEGFA, VEGFC, IL-1, IL-8, CCL2, CXCL1, CXCL2), proangiogenic matrix proteins (TNC, SEMA3C, NRP2), proangiogenic/proinvasive matrix-degrading enzymes (MMP9, MMP2, PLAT, PLAU), and cytokines and chemokines that mediate inflammatory response (CCL2, CXCL1, IL-1, IL-6, IL-8) and immunotolerance (CCL2, IL-6, IL-10, and downregulation of IL-12). In our xenograft model, A224 grew no tumors in the absence of ectopic FGF18 overexpression. The supportive effect of FGF18 on the in vivo tumor growth in FGF18-overexpressing A224 cells has been confirmed by PD174074-mediated tumor inhibition of already established i.p. xenografts (Figure 4E). However, considering that enhanced proliferation or angiogenesis only applies to established tumor masses, regulation of tumor engraftment efficiency may also contribute to FGF18-mediated tumorigenicity. Recently, tumor-associated macrophages have been demonstrated vital for efficient de novo tumor engraftment (36, 37). Therefore, the macrophage recruitment and toning by FGF18 as shown in this study may also potentially contribute to tumor implanting and establishment, clearly worth further investigation. In addition to tumor vasculature and TAMs, considering the prominent physiologic effect of FGF18 on cells with mesenchymal origin (for example in osteogenesis, chondrogenesis, and alveologenesis), future studies may also need to explore the effects of FGF18 on tumor-associated fibroblasts, another important player in the progression of serous ovarian cancer (38). In fact, recent studies have demonstrated that FGF18-related proinflammatory cytokines and chemokines, such as CXCL1, are capable of transforming tumor-associated fibroblasts to a “senescence associated secretory phenotype,” which in turn becomes another important source of soluble factors for tumor growth, metastasis, and angiogenesis (39, 40). In summary, we propose that the aberrant upregulation of FGF18 in ovarian cancer cells may initiate reciprocal heterotypic signaling interactions and cascades in neoplastic cells and nonneoplastic cells within the tumor microenvironment and eventually accelerate the malignant progression to convey a poor outcome in serous ovarian cancer (Figure 9).
Figure 9. The effect of FGF18 on the pathogenesis of serous ovarian cancer.

Genes directly or indirectly induced by FGF18 are labeled in red. Arrows indicate potential interactions that contribute to FGF18-mediated ovarian tumorigenesis. Solid arrows, direct effects; dashed arrows, indirect effects; broken arrows, secretion; blue lines, binding.
In this study, we identified the unique correlation between FGF18 overexpression and patient survival among the human FGF ligands and receptors in serous ovarian cancer (Table 1). Other candidate ovarian cancer–related FGF/FGFR genes identified so far include FGF1 (4), FGF2, FGF7, FGF8 (overexpression, prognostic value unknown) (41), and FGFR4 (42). Unlike FGF18, which shows aberrant upregulation and independent prognostic impact in multiple data sets, these FGF/FGFR associations are based on single-patient cohorts without cross-validation. In this report, we demonstrated the ability of FGFR4 to mediate FGF18 signaling and its biologic activity by activating MAPK/ERK and NF-κB. However, FGFR4 alone failed to show any significant tumor-related upregulation or patient survival correlation in all 3 data sets investigated in this study (refs. 3, 5, 6, and Table 1). One potential explanation is that the function (and impact) of FGFR4 is ligand dependent. Overexpression of FGFR4 itself may not directly contribute to ovarian tumorigenesis without activation from high levels of ligands (most commonly FGF18). This would occur most possibly from coamplification. However, other sources of FGF18 from transcriptional deregulation could also provide neoplastic signaling. Considering the rare activating mutation rate of FGF receptors in ovarian cancer (43), the previously observed prognostic power of FGFR4 (42) may be dependent on the coexpression of prognosis-defining FGF ligands such as FGF18. Conversely, neoplastic signaling could be conveyed by the presence of increased ligand (FGF18) without significant alteration in the expression level of the receptor (FGFR4). This point is especially important for 5q31–5q35.3 amplicon void cancers, in which the coexpression of FGFR4 and FGF18 cannot be achieved by coamplification.
Our initial analysis of the 5q31–5q35.3 amplicon suggested FGF1 was a driver based on its biology (4, 42). This analysis has provided important data to further refine the role of FGF ligands and their receptors in the development and progression of ovarian cancer. Nevertheless, FGF1 was not differentially expressed between normal and serous tumor tissue (Table 1; in TCGA data set [ref. 6], 1.02-fold, P = 0.77; in data set of Wu et al. [ref. 12], 1.05-fold, P = 0.27). FGF1 does also activate FGFR4 and increase the activating phosphorylation of p65/Rel-A at Ser536 (42), but it is not clear whether any of the biologic impacts or downstream signature is mediated through these events. We thus believe FGF18 is the predominant ligand contributing to the biology of clinical outcome described here, although it is conceivable that there are selected tumors in which FGF1 is coamplified and expressed where it contributes to the biology along with FGF18. Taken together, we conclude the FGF18 overexpression–induced hyperactivation of FGF signaling may be one of the mechanisms defining the prognostic power of 5q31–5q35.3 in ovarian cancer patients. Therefore, blocking FGF signaling becomes a rational therapeutic approach for ovarian cancer patients with 5q31–5q35.3 amplification. Evaluation of large-scale patient cohorts is currently ongoing to establish the potential correlation between 5q31–5q35.3 amplification and specific FGF pathway activation.
So far, several therapeutic approaches against FGF signaling have been developed, including receptor tyrosine kinase inhibitors, receptor-neutralizing antibodies, and FGF ligand traps (17, 43, 44). In fact, we have demonstrated the feasibility of FGF18 targeting by using pan-FGFR inhibitor PD173074 in an orthotropic mouse model (Figure 4E). However, long-term blockade of FGF receptors by either small molecules or antibodies has been demonstrated toxic through “on-target” (for example through FGFR4, the receptor for homeostasis related FGF19 and FGF23) induced hyperphosphatemia and renal failure in human clinical trials (44). The alternative approach of identifying and blocking the appropriate FGF ligand thus becomes a more feasible strategy. One of such reagents is the soluble decoy receptor FP-1039, which neutralizes multiple FGF ligands based on their affinity to FGFR1c. Interestingly, the antitumor response of FP-1039 has been shown to be positively correlated with the FGF18 RNA level in a panel of 39 tumor cell lines (44). Although ovarian cancer cell lines were not investigated in the above study, we expect substantial targeting efficacy of FP-1039 in the context of ovarian cancer. The progression of ovarian cancer involves a complex network of biological processes; targeting a versatile gene such as FGF18 which affects both tumor cells and genomically stable tumor stromal cells may improve therapeutic response. Subsequent work will be needed to confirm the prognostic value of FGF18 in larger groups of patients and identify individuals suitable for FGF targeted therapy.
Methods
Reagents and biological samples.
The 53 microdissected, high-grade advanced-stage serous ovarian adenocarcinoma samples for the expression profiling have been described previously (5). The 25 high-grade, late-stage, serous ovarian tissue specimens used to investigate the potential correlation between FGF18 and microvessels or TAM infiltration were available FFPE samples from the CGH study (16). A validation tissue microarray was constructed with 263 FFPE samples obtained from patients with informed consent at the MGH between 1993 and 2009. This tissue microarray included 47 serous cystadenomas (benign cyst) and 216 FIGO stage III/IV high-grade serous ovarian cancers (selected to have >80% tumor tissue and <20% stroma and necrosis). Overall survival information was available for 209 samples, which were used to determine the impact of FGF18 expression on patient prognosis. For IHC staining, all FFPE tissues or tissue arrays were cut into 7-μm sections on Superfrost/Plus slides (Fisher Scientific). All specimens and their corresponding clinical information were collected under protocols approved by the Institutional Review Boards of the MGH.
Gene expression profiles and related clinicopathological data were obtained from Gene Expression Omnibus ( http://www.ncbi.nlm.nih.gov/geo/) (3, 5, 12–14) and the Cancer Genome Atlas Data Portal ( https://tcga-data.nci.nih.gov) (6).
Details of cell lines, antibodies and chemical reagents used in this study are described in the Supplemental Methods.
Immunohistochemistry.
Antigen retrieval for FFPE sections was achieved by heating the slides in 0.01 M citrate buffer (pH 6.1, DAKO) in a 121°C, 15 psi autoclave for 12 minutes (for FGF18 antibody) or in a 100°C waterbath for 30 minutes (for all the other antibodies). Primary antibodies against human FGF18 (1:30), CD31 (marker of endothelial cells, 1:50), and CD163 (marker of M2 differentiated macrophages, 1:100), diluted in DAKO antibody diluent, were applied to sections and incubated in a humidified chamber at room temperature for 1 hour. Antigen visualization was performed with ImmPRESS Peroxidase Polymer Detection Reagents (Vector Laboratories) and 3,3′-diaminobenzidine (DAB), followed by counterstaining with Mayer’s hematoxylin (Sigma-Aldrich). A negative same-species IgG control was included in every experiment.
FGF18 protein expression grading was conducted by determining the percentage and intensity of positive cells in 3 different areas at low-power (×100) magnification. First, the percentage of positive cells in each section was scored with a 5-point scale: 0 for <5%, 1 for 5%–25%, 2 for 26%–50%, 3 for 50%–75%, and 4 for over 75%. Second, the intensity of positive signal was scored with a 3-point scale: 1 for weak staining, 2 for moderate staining, and 3 for intense staining. The weighed score of FGF18 staining intensity of each section was obtained by multiplying the percentage score by the intensity score (the maximum weighed score is 12). Microvessel density was evaluated based on Weidner’s method (45) by averaging the number of microvessels found in 5 selected ×100 fields showing the strongest CD31 positivity. Each CD31+ endothelial cell cluster was counted as an individual vessel in addition to the morphologically identifiable vessels with a lumen. The infiltration of M2 macrophages was assessed by counting the number of CD163+ cells in 5 selected ×100 fields where the most staining was observed. A semiquantitative grading method was used for the evaluation of angiogenesis activity in the tissue microarray (Figure 8B). The number of microvessels was estimated in 3 low-power fields for each sample and the average was taken to determine the CD31 grade as follows: grade 1: number of CD31+ microvessels is less than 15; grade 2: number of CD31+ microvessels is 15–50; grade 3: number of CD31+ microvessels is greater than 50; grade 4: clusters of microvessels observed, CD31+ area is greater than 30% of the field.
The IHC was performed by 2 individuals, including 1 pathologist for independent IHC scoring. The scoring was done blinded to the clinical data.
IHC staining of the FFPE xenograft sections was performed with the same protocol as that used for the staining of patient samples. Dilution rates of primary antibodies against FGF18, Ki-67, CD31, and F4/80 (for TAM infiltration) were optimized as 1:30, 1:100, 1:200, and 1:50, respectively. Antigens were visualized by corresponding ImmPRESS anti-mouse/rabbit, anti-goat, or anti-rat Ig HRP systems (Vector Labs) with DAB as substrate and counterstained with Mayer’s hematoxylin. Staining evaluation was performed in the same way as for patient samples.
Gene expression manipulation.
Ectopic overexpression and knockdown of FGF18 were performed by lentiviral vector-mediated delivery of FGF18 cDNA (pLoc series) or microRNA-adapted shRNA (pGIPZ series) against FGF18. Prevalidated plasmid constructs, control plasmids, and lentiviral packaging system were purchased from Thermo Scientific. 293FT cells and Lipofectamine 2000 for viral production were purchased from Invitrogen. Viral supernatants were harvested 48 hours and 72 hours after transfection, filtered through a 0.45-μm PVDF filter, titrated with 293FT cells, and stored in a –80°C freezer. Ovarian cancer cells A224, OVCA429 (for overexpression), and SKOV3 (for overexpression and knockdown) were infected at an MOI of 3–10. Stably infected cells were maintained in medium containing blasticidin S (for overexpression) or puromycin (for knockdown).
Knockdown of FGFR4 was achieved by transfecting 15 nM of siRNA against FGFR4 for 48 hours. FGFR4 siRNA, N/S siRNA, and HiPerFect Transfection Reagent were purchased from QIAGEN.
Statistics.
Statistical analysis was performed with SPSS 17.0 software (SPSS Inc). Kaplan-Meier analysis (with the P value of log-rank test shown in the figures) and Cox regression analysis were used to determine the prognostic power of FGF18 on overall patient survival. Mean ± SD was used to represent data unless specified. In bar graphs, mean ± SD represented data from 3 independent experiments. Unless otherwise stated, Student’s t test was used to compare the means of different groups. Correlation coefficient was determined by Spearman’s ρ test. All tests were 2-tailed, and a P value of less than 0.05 was considered statistically significant.
Microarray data deposition.
The microarray data generated herein have been deposited in NCBI GEO (GSE48567).
Supplemental Methods.
Details of cell lines and reagents, in vitro proliferation, migration, invasion, and coculture assays on ovarian cancer cells, HUVEC cells and THP-1 cells, animal xenograft studies (including pharmacological treatment of PD173074 on in vivo xenografts), Western blot and immunoprecipitation, qPCR (primer sets for qRT-PCR listed in Supplemental Table 5), expression profiling, and microarray data analysis were described in the Supplemental Methods.
Study approval.
Studies using human tissues and cells were reviewed and approved by the Institutional Review Board of MGH, and informed patient consent was obtained. All animal use was strictly reviewed and supervised by the MGH Subcommittee on Research Animal Care in accordance with the NIH Guideline for Laboratory Animals.
Supplementary Material
Acknowledgments
The financial support of research grants to M.J. Birrer and S.C. Mok is gratefully acknowledged: NIH grant RC4CA156551 (to M.J. Birrer), NIH grant 1R01CA142832 (to M.J. Birrer), NIH grant R01CA169200 (to M.J. Birrer), NIH grant 1U01CA152990 (to M.J. Birrer), The Julie Fund (to M.J. Birrer), NIH grant R01CA133057 (to S.C. Mok), and the MD Anderson Ovarian Cancer SPORE grant P50 CA083639 (to S.C. Mok).
Footnotes
Conflict of interest: The authors have declared that no conflict of interest exists.
Citation for this article: J Clin Invest. 2013;123(10):4435–4448. doi:10.1172/JCI70625.
References
- 1.Siegel R, Naishadham D, Jemal A. Cancer statistics, 2012. CA Cancer J Clin. 2012;62(1):10–29. doi: 10.3322/caac.20138. [DOI] [PubMed] [Google Scholar]
- 2.Bast RC, Jr, Hennessy B, Mills GB. The biology of ovarian cancer: new opportunities for translation. Nat Rev Cancer. 2009;9(6):415–428. doi: 10.1038/nrc2644. [DOI] [PMC free article] [PubMed] [Google Scholar]
- 3.Spentzos D, et al. Gene expression signature with independent prognostic significance in epithelial ovarian cancer. J Clin Oncol. 2004;22(23):4700–4710. doi: 10.1200/JCO.2004.04.070. [DOI] [PubMed] [Google Scholar]
- 4.Birrer MJ, et al. Whole genome oligonucleotide-based array comparative genomic hybridization analysis identified fibroblast growth factor 1 as a prognostic marker for advanced-stage serous ovarian adenocarcinomas. J Clin Oncol. 2007;25(16):2281–2287. doi: 10.1200/JCO.2006.09.0795. [DOI] [PubMed] [Google Scholar]
- 5.Mok SC, et al. A gene signature predictive for outcome in advanced ovarian cancer identifies a survival factor: microfibril-associated glycoprotein 2. Cancer Cell. 2009;16(6):521–532. doi: 10.1016/j.ccr.2009.10.018. [DOI] [PMC free article] [PubMed] [Google Scholar]
- 6.The Cancer Genome Atlas Research Network Integrated genomic analyses of ovarian carcinoma. Nature. 2011;474(7353):609–615. doi: 10.1038/nature10166. [DOI] [PMC free article] [PubMed] [Google Scholar]
- 7.Eswarakumar VP, Lax I, Schlessinger J. Cellular signaling by fibroblast growth factor receptors. Cytokine Growth Factor Rev. 2005;16(2):139–149. doi: 10.1016/j.cytogfr.2005.01.001. [DOI] [PubMed] [Google Scholar]
- 8.Haque T, Nakada S, Hamdy RC. A review of FGF18: Its expression, signaling pathways and possible functions during embryogenesis and post-natal development. Histol Histopathol. 2007;22(1):97–105. doi: 10.14670/HH-22.97. [DOI] [PubMed] [Google Scholar]
- 9.Antoine M, et al. Fibroblast growth factor 16 and 18 are expressed in human cardiovascular tissues and induce on endothelial cells migration but not proliferation. Biochem Biophys Res Commun. 2006;346(1):224–233. doi: 10.1016/j.bbrc.2006.05.105. [DOI] [PubMed] [Google Scholar]
- 10.Liu Z, Lavine KJ, Hung IH, Ornitz DM. FGF18 is required for early chondrocyte proliferation, hypertrophy and vascular invasion of the growth plate. Dev Biol. 2007;302(1):80–91. doi: 10.1016/j.ydbio.2006.08.071. [DOI] [PubMed] [Google Scholar]
- 11.Franco-Montoya ML, et al. Profiling target genes of FGF18 in the postnatal mouse lung: possible relevance for alveolar development. Physiol Genomics. 2011;43(21):1226–1240. doi: 10.1152/physiolgenomics.00034.2011. [DOI] [PMC free article] [PubMed] [Google Scholar]
- 12.Wu R, et al. Mouse model of human ovarian endometrioid adenocarcinoma based on somatic defects in the Wnt/beta-catenin and PI3K/Pten signaling pathways. Cancer Cell. 2007;11(4):321–333. doi: 10.1016/j.ccr.2007.02.016. [DOI] [PubMed] [Google Scholar]
- 13.Stany MP, et al. Identification of novel therapeutic targets in microdissected clear cell ovarian cancers. PLoS One. 2011;6(7):e21121. doi: 10.1371/journal.pone.0021121. [DOI] [PMC free article] [PubMed] [Google Scholar]
- 14.Crum CP, et al. The distal fallopian tube: a new model for pelvic serous carcinogenesis. Curr Opin Obstet Gynecol. 2007;19(1):3–9. doi: 10.1097/GCO.0b013e328011a21f. [DOI] [PubMed] [Google Scholar]
- 15.Tone AA, et al. Gene expression profiles of luteal phase fallopian tube epithelium from BRCA mutation carriers resemble high-grade serous carcinoma. Clin Cancer Res. 2008;14(13):4067–4078. doi: 10.1158/1078-0432.CCR-07-4959. [DOI] [PubMed] [Google Scholar]
- 16.Engler DA, et al. Genome wide DNA copy number analysis of serous type ovarian carcinomas identifies genetic markers predictive of clinical outcome. PLoS One. 2012;7(2):e30996. doi: 10.1371/journal.pone.0030996. [DOI] [PMC free article] [PubMed] [Google Scholar]
- 17.Turner N, Grose R. Fibroblast growth factor signalling: from development to cancer. Nat Rev Cancer. 2010;10(2):116–129. doi: 10.1038/nrc2780. [DOI] [PubMed] [Google Scholar]
- 18.Zhang X, et al. Receptor specificity of the fibroblast growth factor family. The complete mammalian FGF family. J Biol Chem. 2006;281(23):15694–15700. doi: 10.1074/jbc.M601252200. [DOI] [PMC free article] [PubMed] [Google Scholar]
- 19.Richmond A. Nf-κB, chemokine gene transcription and tumour growth. Nat Rev Immunol. 2002;2(9):664–674. doi: 10.1038/nri887. [DOI] [PMC free article] [PubMed] [Google Scholar]
- 20.Bieche I, et al. CXC chemokines located in the 4q21 region are up-regulated in breast cancer. Endocr Relat Cancer. 2007;14(4):1039–1052. doi: 10.1677/erc.1.01301. [DOI] [PubMed] [Google Scholar]
- 21.Murdoch C, Muthana M, Coffelt SB, Lewis CE. The role of myeloid cells in the promotion of tumour angiogenesis. Nat Rev Cancer. 2008;8(8):618–631. doi: 10.1038/nrc2444. [DOI] [PubMed] [Google Scholar]
- 22.Qian BZ, Pollard JW. Macrophage diversity enhances tumor progression and metastasis. Cell. 2010;141(1):39–51. doi: 10.1016/j.cell.2010.03.014. [DOI] [PMC free article] [PubMed] [Google Scholar]
- 23.Robinson-Smith TM, et al. Macrophages mediate inflammation-enhanced metastasis of ovarian tumors in mice. Cancer Res. 2007;67(12):5708–5716. doi: 10.1158/0008-5472.CAN-06-4375. [DOI] [PubMed] [Google Scholar]
- 24.Thompson MS, Mok SC. Immunopathogenesis of ovarian cancer. Minerva Med. 2009;100(5):357–370. [PubMed] [Google Scholar]
- 25.Reinhold MI, et al. FGF18 represses noggin expression and is induced by calcineurin. J Biol Chem. 2004;279(37):38209–38219. doi: 10.1074/jbc.M404855200. [DOI] [PubMed] [Google Scholar]
- 26.Acevedo VD, et al. Inducible FGFR-1 activation leads to irreversible prostate adenocarcinoma and an epithelial-to-mesenchymal transition. Cancer Cell. 2007;12(6):559–571. doi: 10.1016/j.ccr.2007.11.004. [DOI] [PubMed] [Google Scholar]
- 27.Wu J, et al. HMGA2 overexpression-induced ovarian surface epithelial transformation is mediated through regulation of EMT genes. Cancer Res. 2011;71(2):349–359. doi: 10.1158/0008-5472.CAN-10-2550. [DOI] [PMC free article] [PubMed] [Google Scholar]
- 28.White KL, et al. Genomics of the NF-κB signaling pathway: hypothesized role in ovarian cancer. Cancer Causes Control. 2011;22(5):785–801. doi: 10.1007/s10552-011-9745-4. [DOI] [PMC free article] [PubMed] [Google Scholar]
- 29.Tsujimoto H, et al. Roles of inflammatory cytokines in the progression of gastric cancer: friends or foes? Gastric Cancer. 2010;13(4):212–221. doi: 10.1007/s10120-010-0568-x. [DOI] [PubMed] [Google Scholar]
- 30.Goldberg JE, Schwertfeger KL. Proinflammatory cytokines in breast cancer: mechanisms of action and potential targets for therapeutics. Curr Drug Targets. 2010;11(9):1133–1146. doi: 10.2174/138945010792006799. [DOI] [PubMed] [Google Scholar]
- 31.Hayden MS, Ghosh S. Signaling to NF-κB. Genes Dev. 2004;18(18):2195–2224. doi: 10.1101/gad.1228704. [DOI] [PubMed] [Google Scholar]
- 32.Mantovani F, et al. NF-κB mediated transcriptional activation is enhanced by the architectural factor HMGI-C. Nucleic Acids Res. 1998;26(6):1433–1439. doi: 10.1093/nar/26.6.1433. [DOI] [PMC free article] [PubMed] [Google Scholar]
- 33.Perrella MA, et al. High mobility group-I(Y) protein facilitates nuclear factor-kappaB binding and transactivation of the inducible nitric-oxide synthase promoter/enhancer. J Biol Chem. 1999;274(13):9045–9052. doi: 10.1074/jbc.274.13.9045. [DOI] [PubMed] [Google Scholar]
- 34.Noro B, et al. Molecular dissection of the architectural transcription factor HMGA2. Biochemistry. 2003;42(15):4569–4577. doi: 10.1021/bi026605k. [DOI] [PubMed] [Google Scholar]
- 35.Busser B, et al. The multiple roles of amphiregulin in human cancer. Biochim Biophys Acta. 2011;1816(2):119–131. doi: 10.1016/j.bbcan.2011.05.003. [DOI] [PubMed] [Google Scholar]
- 36. Fleming JM, et al. Paracrine interactions between primary human macrophages and human fibroblasts enhance murine mammary gland humanization in vivo. Breast Cancer Res. 2012. 14 (3) [DOI] [PMC free article] [PubMed] [Google Scholar]
- 37.Qian B, et al. A distinct macrophage population mediates metastatic breast cancer cell extravasation, establishment and growth. PLoS One. 2009;4(8):e6562. doi: 10.1371/journal.pone.0006562. [DOI] [PMC free article] [PubMed] [Google Scholar]
- 38.Schauer IG, Sood AK, Mok S, Liu J. Cancer-associated fibroblasts and their putative role in potentiating the initiation and development of epithelial ovarian cancer. Neoplasia. 2011;13(5):393–405. doi: 10.1593/neo.101720. [DOI] [PMC free article] [PubMed] [Google Scholar]
- 39.Yang G, et al. The chemokine growth-regulated oncogene 1 (Gro-1) links RAS signaling to the senescence of stromal fibroblasts and ovarian tumorigenesis. Proc Natl Acad Sci U S A. 2006;103(44):16472–16477. doi: 10.1073/pnas.0605752103. [DOI] [PMC free article] [PubMed] [Google Scholar]
- 40.Coppe JP, Desprez PY, Krtolica A, Campisi J. The senescence-associated secretory phenotype: the dark side of tumor suppression. Annu Rev Pathol. 2010;5:99–118. doi: 10.1146/annurev-pathol-121808-102144. [DOI] [PMC free article] [PubMed] [Google Scholar]
- 41.Burger RA. Overview of anti-angiogenic agents in development for ovarian cancer. Gynecol Oncol. 2011;121(1):230–238. doi: 10.1016/j.ygyno.2010.11.035. [DOI] [PubMed] [Google Scholar]
- 42.Zaid TM, et al. Identification of FGFR4 as a potential therapeutic target for advanced-stage, high-grade serous ovarian cancer. Clin Cancer Res. 2013;19(4):809–820. doi: 10.1158/1078-0432.CCR-12-2736. [DOI] [PMC free article] [PubMed] [Google Scholar]
- 43.Greulich H, Pollock PM. Targeting mutant fibroblast growth factor receptors in cancer. Trends Mol Med. 2011;17(5):283–292. doi: 10.1016/j.molmed.2011.01.012. [DOI] [PMC free article] [PubMed] [Google Scholar]
- 44.Harding TC, et al. Blockade of nonhormonal fibroblast growth factors by FP-1039 inhibits growth of multiple types of cancer. Sci Transl Med. 2013;5(178):178ra39. doi: 10.1126/scitranslmed.3005414. [DOI] [PubMed] [Google Scholar]
- 45.Weidner N. Current pathologic methods for measuring intratumoral microvessel density within breast carcinoma and other solid tumors. Breast Cancer Res Treat. 1995;36(2):169–180. doi: 10.1007/BF00666038. [DOI] [PubMed] [Google Scholar]
Associated Data
This section collects any data citations, data availability statements, or supplementary materials included in this article.