

The transport cycle of plant H+/Suc symporters involves a major conformational change of the transporter, which translocates protons and Suc across the membrane. Here, the authors dissected individual steps within the transport cycle of maize SUCROSE TRANSPORTER1 (SUT1) and demonstrate that the conformational change of the protein limits the velocity of Suc transport.
Abstract
Proton-driven Suc transporters allow phloem cells of higher plants to accumulate Suc to more than 1 M, which is up to ∼1000-fold higher than in the surrounding extracellular space. The carrier protein can accomplish this task only because proton and Suc transport are tightly coupled. This study provides insights into this coupling by resolving the first step in the transport cycle of the Suc transporter SUT1 from maize (Zea mays). Voltage clamp fluorometry measurements combining electrophysiological techniques with fluorescence-based methods enable the visualization of conformational changes of SUT1 expressed in Xenopus laevis oocytes. Using the Suc derivate sucralose, binding of which hinders conformational changes of SUT1, the association of protons to the carrier could be dissected from transport-associated movements of the protein. These combined approaches enabled us to resolve the binding of protons to the carrier and its interrelationship with the alternating movement of the protein. The data indicate that the rate-limiting step of the reaction cycle is determined by the accessibility of the proton binding site. This, in turn, is determined by the conformational change of the SUT1 protein, alternately exposing the binding pockets to the inward and to the outward face of the membrane.
INTRODUCTION
The main metabolites transported in the phloem sap are organic compounds, mostly sugars and amino acids (Dinant et al., 2010). In apoplastic loading species, Suc is the most abundant sugar with concentrations in the phloem sap ranging from, for example, 340 mM in Arabidopsis thaliana (Deeken et al., 2002), ∼850 mM in maize (Zea mays) (Ohshima et al., 1990; Lohaus et al., 2000), and up to 1.8 M in potato (Solanum tuberosum) (Pescod et al., 2007), whereas the apoplastic Suc concentration is usually in the low millimolar range (e.g., in maize leaves 2 to 5 mM; Lohaus et al., 2000). Thus, plasma membrane–localized proton-driven Suc transporters (alternatively named SUTs or SUCs) represent key players for high Suc accumulation (Riesmeier et al., 1994). The pivotal physiological relevance of Suc carriers is underpinned by loss-of-function studies (compared with Gottwald et al., 2000; Slewinski et al., 2009; Slewinski et al., 2010).
Plant Suc transporters group into the same structural superfamily (Major Facilitator Superfamily; Marger and Saier, 1993; Aoki et al., 2003; Saier et al., 2006; Reinders et al., 2012a; Yan, 2013) as the model transporters LacY, an H+-coupled lactose permease from Escherichia coli, and SGLT1, an animal Na+/Glc cotransporter. Lactose permease (LacY) and sodium glucose transporter1 (SGLT1) have been extensively studied to draw a mechanistic model of cation-coupled substrate transport across membranes (Loo et al., 1993, 1998; Abramson et al., 2003; Kaback et al., 2007; Majumdar et al., 2007; Smirnova et al., 2008; Zhou et al., 2008). Site-directed alkylation and fluorescence-based methods as well as single-molecule fluorescence resonance energy transfer support an alternating access model, in which a conformational change is necessary for completion of the LacY transport catalysis (Majumdar et al., 2007; Smirnova et al., 2008). In the case of SGLT1, electrophysiological measurements were combined with voltage-clamp fluorometry (VCF) in Xenopus laevis oocytes (Loo et al., 1993, 1998, 2006). Thereby, site-specific labeling of an introduced Cys residue with environmentally sensitive fluorophores enabled real-time observation of intramolecular movements under various conditions. Based on these studies, a similar six-state reaction scheme for SGLT1 and LacY was proposed (Parent et al., 1992b; Loo et al., 1993, 1998, 2006; Smirnova et al., 2008).
Pioneering studies with transporters of plant cells were conducted using the hexose/H+ transport system of the unicellular alga Chlorella kessleri. The H+/Glc symporter system (Komor, 1973; Komor and Tanner, 1974, 1976), which transports sugars and protons with a stoichiometry of 1:1, is able to accumulate Glc analogs more than 1000-fold (Komor et al., 1973). Later on, three genes coding for Chlorella hexose transport activity were identified (HUP1, HUP2, and HUP3; Sauer and Tanner, 1989; Stadler et al., 1995) that share the overall structure of Major Facilitator Superfamily family members.
Thirty years of biochemical and biophysical analysis of Suc transport in higher plants revealed that Suc transporters mediate the accumulation of Suc by coupling substrate transport to the thermodynamically favorable symport of protons (Geiger et al., 1973; Giaquinta, 1976; Komor et al., 1977; Delrot, 1981; Delrot and Bonnemain, 1981; Bush, 1989; Slone and Buckhout, 1991; Slone et al., 1991; Bossi et al., 2011). Thereby, the free energy, stored in the electrochemical proton gradient across the membrane, is established via the hydrolysis of ATP by primary active pumps (Morsomme and Boutry, 2000; Palmgren, 2001; Gaxiola et al., 2007; Buch-Pedersen et al., 2009).
Biochemical studies using plasma membrane vesicles from sugar beet (Beta vulgaris) leaf tissues revealed kinetic parameters (substrate affinity, pH dependence, stoichiometry, and inhibitor sensitivity) allowing development of the first models for the reaction cycle of Suc transport in plant cells (Bush, 1990, 1993; Buckhout, 1994). Subsequently, Boorer et al. (1996a) and Zhou et al. (1997) expressed potato SUCROSE TRANSPORTER1 (SUT1) and Arabidopsis SUC1 in X. laevis oocytes and conducted two-electrode voltage-clamp measurements of Suc-induced transport currents. Affinities to H+ and Suc and maximal activities of the transporters could be obtained. The observations of Zhou et al. could be sufficiently described by a six-state model, in which the binding at the external side can be random, but it has to be ordered at the inside with the sugar dissociating before the proton. Similarly, Boorer et al. (1996a) used oocytes expressing potato SUT1 to investigate steady state kinetic properties resulting in an eight-state ordered, simultaneous model, with H+ binding before Suc. The authors further supposed that Suc is released before H+ at the cytosolic site of the membrane. Due to uncoupled transport of Suc, the kinetic model was extended by a branch resembling the conformational change of the transporter bound to Suc only.
Maize SUT1 was initially described by Aoki et al. (1999) and was found to mediate Suc-induced proton currents in the µA range, a range sufficiently large enough to allow precise electrophysiological measurements of kinetic parameters in X. laevis oocytes (Carpaneto et al., 2005, 2010; Wippel et al., 2010). Maize SUT1 was characterized as a Suc transporter exhibiting kinetic parameters for Suc as well as for protons with pronounced voltage dependence. Highest affinities were monitored at hyperpolarized membrane potentials and acidic pH conditions (Carpaneto et al., 2005). In agreement with a perfectly coupled thermodynamic machine, SUT1 is facilitating H+/Suc transport across the membrane with a 1:1 stoichiometry. Giant patch clamp studies with SUT1-expressing oocytes provided evidence that the Suc gradient is sufficient to drive the proton transport, which further supports the idea of a strict coupling of proton and Suc transport but contradicts the uncoupled transport found with potato SUT1 (Boorer et al., 1996a). Interestingly, with maize SUT1, the transport direction could be reversed, allowing the release of Suc into the extracellular space under physiological conditions present in sink tissues (Carpaneto et al., 2005).
The capability of Suc transporters to accumulate Suc concentrations of more than 1 M and their flexibility to serve also as release pathways suggest that plants developed transporters with unique structural and functional properties (Lohaus et al., 1994, 1995, 2000; Lohaus and Fischer, 2004; Pescod et al., 2007). Here, we provide insight into the transport mechanism of the maize model Suc transporter SUT1. We could identify sucralose as a competitive inhibitor of Suc-induced SUT1 currents and used this compound as a tool. Electrophysiological analyses in combination with VCF measurements of intramolecular movements of SUT1 suggested that externally applied sucralose locked the Suc carrier in its outward facing conformation. Our approaches also allowed us to dissect and quantify individual steps of the SUT1 transport cycle. The data suggest that the rate-limiting step of the SUT1 reaction cycle is determined by the accessibility of the extracellular proton binding site and, thus, by conformational changes of the SUT1 protein. This study resolves the first step in the reaction cycle of a plant Suc transporter: the binding of protons to the carrier and its interrelationship with the alternating movement of the protein. It therefore provides fundamental insights into the physiologically important process of sugar translocation in plants.
RESULTS
Sucralose, a Competitive Inhibitor of Suc-Induced SUT1-Mediated Transport
Phylogenetic analysis revealed that plant Suc transporters are grouped into three major clades (I to III; Aoki et al., 2003). Clade I Suc carriers are found in eudicots only, but type II transporters are found in all land plants (Aoki et al., 2003; Reinders et al., 2012a). The phylogenetic separation is also reflected in functional differences between members of the two clades. Type II Suc transporters are highly selective for Suc, maltose, salicin, and α-phenylglucoside (Sivitz et al., 2005; Reinders et al., 2006, 2012b; Sun et al., 2010). In contrast with type II transporters, type I Suc carriers transport a broad variety of α- and β-glucosides as well as arbutin, esculin, palatinose, and sucralose (Chandran et al., 2003; Sivitz et al., 2005, 2007; Reinders et al., 2012b). To test the substrate specificity of maize SUT1, belonging to group II, oocytes of X. laevis were injected with SUT1 cRNA and measured with the two-electrode voltage clamp (TEVC) technique after 4 to 5 d of expression. Substrate-induced steady state currents recorded at −100 mV revealed that maize SUT1 favors Suc and maltose over salicin. Monosaccharides, such as Glc, Fru, and Man, the disaccharide lactose as well as the trisaccharide raffinose were not transported (Figure 1A). Thus, maize SUT1 represents a typical member of the type II Suc transporters (Reinders et al., 2012a, 2012b). In contrast with Suc, the artificial sweetener sucralose did not evoke macroscopic SUT1-mediated proton currents (Figure 1A). Sucralose was not transported at any pH value tested (range pH 4.0 to 7.5), whereas Suc-induced currents increased with rising proton concentrations (see Supplemental Figure 1A online). Reinders et al. (2006) showed that sucralose is a competitive inhibitor of Suc transport mediated by the sugarcane transporter SUT1. We therefore investigated the effect of sucralose on maize SUT1 activity. Upon application of 1 mM Suc at pH 4.0 to the external medium, SUT1 mediated sustained proton inward currents at a holding potential of −20 mV. These Suc-induced proton inward currents were suppressed when an excess of 150 mM sucralose was added to the bath medium (Figure 1B). Statistical analysis of the sucralose effect at −100 mV and pH 4.0 suggested that the artificial sweetener inhibits Suc-induced SUT1 currents (see Supplemental Figure 1B online). To quantify the inhibitory effect of sucralose on Suc-induced transport currents, different sucralose concentrations were applied in the presence of a constant Suc concentration (5 mM Suc at pH 5.6 and 1 mM Suc at pH 4.0; Figure 1C). The resulting dose–response curves were described with a Michaelis-Menten equation and revealed a half maximal inhibition constant of 31.5 mM ± 4.5 mM at pH 5.6 and 12.0 mM ± 1.1 mM at pH 4.0. Furthermore, we investigated whether sucralose is a competitive inhibitor of SUT1-mediated Suc transport (compared with Reinders et al., 2006). SUT1 transport currents were recorded at Suc concentrations in the range between 0.1 and 50 mM in the presence and absence of 10 mM sucralose and were plotted as a function of the Suc concentration. Saturation curves could be best described with a Michaelis-Menten equation resulting in a Km (Suc) of 1.5 ± 0.1 mM in the absence of sucralose. In the presence of 10 mM sucralose, the Km for Suc increased to 3.3 ± 0.1 mM, while the maximum level did not change (Figure 1D), indicating that sucralose represents a competitive inhibitor of Suc-induced SUT1 transport.
Figure 1.

Competitive Inhibition of Suc-Induced Maize SUT1 Currents by Sucralose.
(A) Normalized steady state currents (ISS norm) were recorded in the presence of 100 mM sugar at a holding potential (VH) of −100 mV and pH 5.6 (n = 4, ±sd). ISS currents were normalized to the currents observed in the presence of 100 mM Suc.
(B) Suc-induced negative inward currents (ISS) at −20 mV at pH 4.0 were suppressed upon application of sucralose (scl).
(C) Inhibition (in %) of Suc-induced transport currents at −100 mV were plotted as a function of the external sucralose concentration. At pH 5.6 (circles), a constant Suc concentration of 5 mM was present, whereas at pH 4.0 (triangles), 1 mM Suc was present. The half maximal inhibitor concentration (IC50) was calculated with a Michaelis-Menten function. Steady state currents of individual cells were normalized to the extrapolated maximal inhibition (=100% inhibition) at −100 mV (n ≥ 4, ±sd).
(D) Competitive inhibition of Suc-induced currents by sucralose. Steady state currents measured at −100 mV and pH 4.0 were plotted as a function of the external Suc concentration. Steady state currents were normalized to the currents at −100 mV and 3 mM Suc. Experiments were performed either in the presence (circles) or absence of 10 mM sucralose (triangles). The dose response could be described with a Michaelis-Menten function, resulting in the Km (Suc) in the absence or presence of sucralose (n = 4, ±sd).
(E) Membrane capacitance (Cm) changes in response to 0 mM (triangles) or 100 mM Suc (squares) or 100 mM sucralose (circles) at pH 4.0 were plotted against the voltage. Application of saturating Suc concentrations dramatically decreased Cm, whereas sucralose decreased the Cm only slightly. Cm values were normalized to the value at −10 mV in the absence of Suc (n = 7, ±sd).
Other important information on the characteristics of electrogenic Suc transporters can be obtained by measuring voltage-dependent membrane capacitance (Cm) changes and so-called pre–steady state currents (Ipre; Carpaneto et al., 2010). Membrane capacitance measurements are well suited for the observation of intramolecular movements of charged domains in integral membrane proteins or the binding of ions to the protein within the electrical field of the membrane (Parent et al., 1992a; Loo et al., 1993; Klamo et al., 1996; Forster et al., 1998). Charge movements inside membrane proteins were described as a characteristic property of most ion-coupled transporters, both from animal (Parent et al., 1992a; Loo et al., 1993, 1998; Su et al., 1996; Nussberger et al., 1997; Hilgemann and Lu, 1999; Lu and Hilgemann, 1999a, 1999b; Fesce et al., 2002; Giovannardi et al., 2003; Peres et al., 2004; Cherubino et al., 2010) and plant kingdoms (Arabidopsis STP1 and maize SUT1; Boorer et al., 1994; Carpaneto et al., 2010). These charge movements occur also in the absence of the substrate, and then they manifest as a transient current response to rapid voltage steps, the so-called pre–steady state currents. However, saturating amounts of substrate disperse Ipre and favor transport currents (Loo et al., 1993; Lester et al., 1996; Mager et al., 1996; Nussberger et al., 1997; Bossi et al., 1999, 2011; Cherubino et al., 2010). In a previous study on maize SUT1, we showed that in the absence of Suc, the binding of protons to the transporter manifests in rapidly decaying pre–steady state currents (Ipre; Figure 2A) and in voltage-dependent membrane capacitance changes (Carpaneto et al., 2010). Subsequent addition of Suc dramatically decreased Cm (Carpaneto et al., 2010; Figure 1E, squares). Now the protons that were trapped in the transporter can pass together with Suc the membrane converting decaying pre–steady state into lasting transport currents. When instead of Suc, sucralose was added to the bath medium, Cm persisted at a high level (Figure 1E, circles) indicating that the pathway for protons across the membrane remained blocked.
Figure 2.

Pre–Steady State Currents of Maize SUT1 at pH 4.0.
(A) Pre–steady state currents (Ipre) were obtained by subtracting the stationary currents in the presence of saturating Suc concentration (100 mM Suc) from currents in the absence of Suc (0 mM Suc). The pre–steady state currents could be approximated by a sum of two exponential functions indicated as a red line for the −160 mV current trace. Starting at a holding voltage of −20 mV, voltage pulses from +40 mV to −160 mV in 40-mV decrements were applied.
(B) Time constants of the decay of the pre–steady state currents in the absence of substrate versus the applied voltage. The fit of pre–steady state currents (as shown in [A]) by a sum of two exponential functions revealed two time constants: τfast (triangles) and τslow (circles). The value of the fast time constant was smaller than 1 ms and was thus limited by the speed of the voltage clamp (n = 6, ±sd).
(C) Pre–steady state currents in the presence of sucralose (scl) were obtained by subtracting the stationary currents in the presence of 100 mM Suc from currents in the presence of 100 mM sucralose. The same voltage protocol as in (A) was applied. In contrast with the pre–steady state currents measured in the absence of any substrate, the pre–steady state currents in the presence of sucralose could be well approximated by a single exponential function indicated as red line for the −160 mV current trace.
(D) Time constant of the decay of the pre–steady state currents in the presence of 100 mM sucralose was plotted against the applied voltage. Note, the slow time constant disappeared, while τfast remained apparently unaffected in the presence of the competitive inhibitor sucralose (n = 6, ±sd).
(E) Representative pre–steady state current traces in the presence of varying sucralose concentrations recorded at −160 mV: 0 mM (black), 5 mM (red), and 100 mM sucralose (blue).
(F) Amplitude of the slow pre–steady state current component plotted against the logarithmic sucralose concentration at −100 mV (blue), −130 mV (red), and −160 mV (black) (n = 7 each, ±sd). The dose–response curve could be best described with Hill equations (Equation 4; solid lines).
All experiments were performed in standard bath solutions at pH 4.0. Substrate concentrations are indicated.
Sucralose Affects the Gating of Maize SUT1
The competitive inhibitor sucralose enabled us to further dissect individual steps of the reaction cycle of SUT1. We monitored pre–steady state currents in the absence of any substrate and in the presence of either Suc or sucralose at pH 4.0. To obtain pre–steady state currents, first raw currents were elicited by clamping the membrane potential from a holding potential of −20 mV to test voltages from +40 to −160 mV in 10-mV decrements. Subsequently, the stationary level of original current traces was set to zero and the currents in the presence of saturating Suc concentration were subtracted from the currents in the absence of the substrate (Figure 2A) and from the currents in the presence of sucralose (Figure 2C). The decay of the resulting pre–steady state currents in the absence of substrate was best described by a sum of two exponential equations (indicated exemplarily as the red line for one trace in Figure 2A) resulting in two time constants, a slow (τslow) and a fast (τfast) one (Figure 2B; compared with Carpaneto et al., 2010). The fast time constant of <1 ms was limited by the voltage clamp speed of the amplifier (triangles). The slow time constant was around 2 ms (circles). In the voltage interval between 0 and −40 mV, the time constants could not be resolved from the pre–steady state currents because the amplitudes were too small.
Although sucralose is not a substrate for SUT1 and did not evoke any transport currents, pre–steady state currents were still present even at saturating sucralose concentrations (100 mM) (Figure 2C). However, sucralose-induced pre–steady state currents appeared to be different from Ipre recorded in control conditions. Interestingly, pre–steady state currents induced by saturating sucralose concentrations could be satisfyingly described with a monoexponential equation (indicated exemplarily as red line for one trace in Figure 2C). The decay of pre–steady state currents were characterized by only one time constant around 0.5 ms. Thus, the slow Ipre current component was absent (cf. Figures 2C and 2D with Figures 2A and 2B). In summary, these results indicate that in the presence of saturating sucralose concentrations, the association of protons to the proteins proceeds very rapidly and not with a rapid and a slow component as in control conditions. It might thus be hypothesized that sucralose primes the number of transporters being accessible for proton binding.
Sucralose represents a competitive inhibitor for type II Suc transporters, such as sugarcane (Saccharum officinarum) SUT1 (Reinders et al., 2006) and maize SUT1 (Figure 1D), indicating that sucralose can bind to the substrate binding site. It is therefore straightforward to ask how sucralose can influence the slow pre–steady state current component and in turn the reaction cycle of SUT1. To elucidate this question, we monitored Ipre in response to varying sucralose concentrations at pH 4.0. Representative Ipre current traces at −160 mV indicated that application of sucralose reduced the current amplitude of the slow Ipre component rather than affecting the slow time constant (τslow; Figure 2E). To further prove this notion, we determined the amplitude of the slow pre–steady state component by approximating Ipre with a double-exponential equation. When the amplitude was plotted as a function of the applied sucralose concentration (Figure 2F), the resulting dose responses could be well described with a Hill equation. The sucralose dependence of the slow Ipre amplitude was characterized by a half-maximal sucralose concentration of 7.71 ± 2.2 mM at −100 mV (7.27 ± 1.5 mM at −130 mV and 7.06 ± 2.0 mM at −160 mV). Taken together, the fact that pre–steady state currents are observable in the presence of sucralose (Figure 2C) indicates that protons are still able to bind to the transporter when sucralose occupies the substrate binding site. However, the weak (almost absent) effect of sucralose on Cm (Figure 1E) and the suppression of the slow Ipre component point to an impairment of the conformational change of SUT1.
Monitoring Conformational Changes of Maize SUT1 by VCF
The analysis of pre–steady state currents and Cm changes allowed us to investigate the first step in the reaction cycle of SUT1: the binding of protons to the carrier. To further dissect the reaction cycle of SUT1, we chose the VCF technique. It is well accepted that ion-coupled transporters change between two conformations to allow alternating access of the cotransported ion and the substrate to the binding pocket (alternating access model; Kaback et al., 2007; Majumdar et al., 2007; Smirnova et al., 2008; Zhou et al., 2008). To visualize conformational changes of integral membrane proteins, Mannuzzu et al. (1996) introduced the VCF technique. They monitored the movement of the voltage sensor domain S4 of the shaker K+ channel ShH4. VCF is based on the observation of fluorescence changes of environmentally sensitive fluorophores bound to a moving domain of the target protein under defined membrane potentials. If the fluorophore is displaced due to the movement of the protein, for example, from an aqueous environment to the vicinity of the membrane or into a hydrophobic area of the protein, the fluorescence is quenched. This change in fluorescence can be a direct readout for the movement of the protein (Geibel et al., 2003; Egenberger et al., 2012).
Since the fluorophore binding is restricted to protein residues facing the intra- or extracellular space, transmembrane regions of SUT1 were predicted by transmembrane hidden Markov model (TMHMM; http://www.cbs.dtu.dk/services/TMHMM/) to identify protein regions that might be accessible from the experimentally best reachable extracellular side. To minimize nonspecific binding of the fluorophore to native extracellular Cys residues of SUT1, we replaced these Cys residues by Ala and probed the function of the Cys-free mutants by TEVC measurements in oocytes. SUT1 harbors five putative extracellular Cys residues (Cys-139, Cys-223, Cys-224, Cys-227, and Cys-417). Only three of them could be removed without losing Suc transport activity (Cys-139, Cys-224, and Cys-417; the Cys-free triple mutant SUT1-C139A-C224A-C417A was named SUT1-Cys-3). In order to find extracellular domains moving upon transport-associated conformational changes, we introduced Cys residues via site-directed mutagenesis in the background of the Cys-free triple mutant and screened the mutants with the VCF technique. The mutants were labeled in ND96 buffer with 1 µM tetramethylrhodamine-6-maleimid (TMRM) for 5 to 10 min at room temperature in the dark. Fluorescence and currents were recorded in parallel under voltage clamp conditions (Mannuzzu et al., 1996; Loo et al., 1998, 2006; Geibel et al., 2003). Right after turning on the excitation light (532 nm), TMRM-labeled oocytes were clamped to membrane potentials from +80 to −200 mV in 10-mV decrements starting from a holding potential of −20 mV (Figure 3A). To exclude that TMRM-labeled oocytes mediate any voltage-induced fluorescence changes per se, the fluorescence intensity of noninjected SUT1- or SUT1-Cys-3–expressing oocytes were measured upon voltage jumps in the absence or presence of Suc. Neither noninjected oocytes nor oocytes expressing SUT1-WT (wild type) or SUT1-Cys-3 showed fluorescence changes in response to voltage or application of Suc (Figures 3B to 3D). By contrast, voltage-dependent fluorescence changes were observed with the mutants SUT1-Y61C, SUT1-V62C, SUT1-T64C, and SUT1-T72C, where native residues within the loop between transmembrane domain I and II (TMD) were replaced by a Cys. All mutants showed voltage-dependent fluorescence changes in the absence and presence of Suc at pH 4.0 (Figures 3E to 3H). However, most pronounced voltage-dependent fluorescent changes were recorded with SUT1-T72C (Figure 3E).
Figure 3.

Voltage-Dependent Fluorescence Changes of TMRM-Labeled SUT1 Expressed in Oocytes.
Following expression in X. laevis oocytes, maize SUT1 mutants were labeled with TMRM and voltage-dependent fluorescence changes were measured.
(A) Starting from −20 mV, the oocytes were clamped to membrane potentials in the range from +80 to −200 mV in 10-mV decrements. For clarity, only four voltage pulses are shown. The LED-based excitation light was switched on before the voltage pulses were applied and the fluorescence intensity was recorded.
(B) to (D) As negative control, the fluorescence intensity of TMRM-labeled SUT1, SUT1-Cys-3–expressing oocytes, and noninjected oocytes was measured in the absence of substrate and in the presence of 100 mM Suc at pH 4.0. Representative original fluorescence recordings showed no detectable voltage-dependent fluorescence changes under any tested condition. WT, the wild type.
(E) to (H) Four mutants (SUT1-Y61C, -V62C, -T64C, and -T72C) showed voltage-induced fluorescence changes. The fluorescence was recorded in the absence of substrate and in the presence of Suc at pH 4.0.
Following the identification of mutants displaying fluorescence changes, we functionally characterized these mutants with respect to current amplitudes, Suc affinity, pH dependence, and sucralose sensitivity by TEVC measurements (Table 1). With SUT1-WT, -Cys-3, as well as the mutants SUT1-V62C, -T64C, and -T72C, the Suc-induced current amplitudes ranged from 1.5 to 4 µA at −100 mV and a pH value of 4 (Table 1). The mutant SUT1-Y61C mediated Suc-induced currents of only 0.8 µA under identical conditions. Apart from SUT1-T64C exhibiting a Km of 34.72 ± 3.77 mM at −100 mV, pH 5.6, Km values of all other mutants were wild-type-like (Table 1). Concerning pH-dependent Suc transport properties and sucralose sensitivity, SUT1-WT and mutants behaved very similarly (Table 1).
Table 1. Comparison of Basic Biophysical Properties between Maize SUT1-WT and Its Mutants That Were Used for Ipre Measurements and VCF (− = no, + = yes, ++ or +++ indicates the intensity of fluorescence changes).
| Biophysical Properties of Maize SUT1 | The Wild Type | Cys-3 | Y61C | V62C | T64C | T72C |
|---|---|---|---|---|---|---|
| Mean Itr at −100 mV pH 4.0 (µA) | −3.3 ± 0.7 | −1.9 ± 0.3 | −0.8 ± 0.1 | −2.0 ± 0.1 | −2.0 ± 0.1 | −1.6 ± 0.2 |
| Km at −100 mV pH 5.6 (mM Suc) | 10.9 ± 1.4 | 7.7 ± 1.4 | 9.9 ± 0.9 | 6.9 ± 0.9 | 34.7 ± 3.8 | 13.0 ± 1.2 |
| pH dependence | The wild type | Wild-type-like | Wild-type-like | Wild-type-like | Wild-type-like | Wild-type-like |
| Pre–steady state currents (Ipre) | The wild type | Wild-type-like | − | Wild-type-like | Wild-type-like | Wild-type-like |
| Transport of sucralose | − | − | − | − | − | − |
| Inhibition by sucralose | + | + | + | + | + | + |
| Voltage-dependent fluorescence change | − | − | ++ | + | + | +++ |
−, no; +, yes; ++ or +++ indicates the intensity of fluorescence changes.
In order to link Ipre, the binding of protons to SUT1, with the conformational change of the SUT1 protein, we explored whether the VCF mutants display wild-type-like Ipre. Properties very similar to SUT1 wild type were monitored for the mutant SUT1-T72C in the SUT1-Cys-3 background. The other mutants were discarded because of small Suc-induced currents (Y61C), an increased Km value (T64C), or the weak voltage-dependent fluorescence changes (V62C and T64C). SUT1-T72C showed in the absence of any substrate Ipre with two time constants (τslow and τfast) equivalent to SUT1-WT (see Supplemental Figures 2A and 2B online; compared with Figure 2B). The fast time constants were <1 ms (triangles), whereas the slow time constants ranged around 2 ms (circles) for the mutant SUT1-T72C (see Supplemental Figure 2B online). Neither τslow nor τfast showed a pronounced voltage dependence. Furthermore, in the presence of saturating sucralose concentrations, τslow was not detectable for the mutant (see Supplemental Figures 2C and 2D online) identical to the situation observed with SUT1-WT (Figure 2D). In summary, SUT1-T72C displayed biophysical properties very similar to SUT1-WT (summarized in Table 1). Thus, VCF measurements with SUT1-T72C should reflect wild-type-like conformational changes of the loop region between TMD I and II.
To observe conformational changes, TMRM-labeled SUT1-T72C–expressing oocytes were clamped to membrane potentials in the range from +80 to −200 mV in 10-mV decrements starting from a holding potential of −20 mV (compared with Figure 3A). Representative original recordings revealed voltage-induced fluorescence changes, which constituted up to 7% of the entire recorded fluorescence intensity at the holding potential (Ftotal; Figures 3E and 4). At pH 4.0, similar voltage-induced fluorescence signals could be recorded in the absence of substrate or the presence of saturating external Suc concentrations (100 mM; Figures 4A and 4B). With decreasing membrane potentials, the fluorescence signal decreased, and with increasing potentials, it increased. This overall behavior of voltage-induced fluorescence changes could also be detected at pH 5.6 and 7.5, although the amplitude of the fluorescence change was reduced at pH 7.5 by around 50% (see Supplemental Figures 3A, 3D, 3F, and 3G online). When varying the Suc concentration from 0 to 5, 15, and 100 mM at pH 5.6, no major difference in original fluorescence recordings could be recorded either (see Supplemental Figures 3A to 3D online), indicating that the conformational change of the protein proceeds independently of the permeating substrate. However, upon application of the competitive inhibitor sucralose (50 mM at pH 4.0), the voltage-induced fluorescence changes were significantly reduced (Figure 4C). Similar results were obtained when applying the nontransported sugar palatinose (Figure 4D). To quantify the inhibitory effect of sucralose and palatinose on voltage-induced fluorescence changes, we calculated the maximal fluorescence amplitude (ΔF; measured as difference between the values obtained at +80 and −200 mV; compared with Figure 4A). It became apparent that sucralose and palatinose reduced ΔF by 65% ± 3% and 51% ± 3% (±se), respectively (Figure 4E). The inhibitory effect of sucralose on the voltage-induced fluorescence change was even more pronounced at pH 5.6 (see Supplemental Figures 3E and 4A online). These results indicate that the nonpermeating sugars sucralose and palatinose inhibit the movement of the extracellular SUT1 loop between TMD I and II, a phenomenon that is not observable when the permeating sugar Suc is applied instead. In this case, the steady state fluorescence (FSS; compared with Figure 4A) follows almost linearly the membrane voltage (Figure 4F) reminiscent to the linear behavior of Suc-induced steady state currents (compared with Supplemental Figure 1A online).
Figure 4.

Voltage-Dependent Fluorescence Changes of TMRM-Labeled SUT1-T72C Expressed in Oocytes.
Following expression in X. laevis oocytes, SUT1-T72C was labeled with TMRM and voltage-dependent fluorescence changes were measured.
(A) to (D) Representative original fluorescence recordings of TMRM-labeled SUT1-T72C under indicated conditions at pH 4.0. Note, fast voltage-dependent fluorescence changes in the presence and absence of Suc appeared to be almost identical. However, application of the competitive inhibitor sucralose (scl) or isomaltulose (isomal) significantly reduced the voltage-dependent fluorescence signal at all tested membrane potentials.
(E) The amplitude of the fluorescence change between the extreme voltages +80 mV and −200 mV (ΔF) (see [A]) is shown at pH 4.0 and either 100 mM Suc, 50 mM sucralose, 50 mM isomaltulose, or in the absence of substrate. ΔF demonstrates that the fluorescence amplitude significantly decreased in the presence of sucralose (n = 16, ±se).
(F) Steady state fluorescence (FSS; indicated in [A]) monitored with SUT1-T72C–expressing oocytes at pH 4.0 in the absence (triangles) and presence of 100 mM Suc (circles) plotted as a function of voltage. FSS was normalized to the fluorescence at −100 mV in the absence of Suc at pH 4.0 (n = 16, ±sd).
DISCUSSION
Proton-coupled Suc transporters play a pivotal role for cell-to-cell and long-distance transport in plants. Utilizing the hyperpolarized membrane potential and the transmembrane proton gradient, they enable phloem cells to accumulate Suc to concentrations up to ∼1 M in the cytosol, which is ∼1000-fold higher than in the apoplast. The carrier protein can accomplish this task only because proton and Suc transport are tightly coupled. However, molecular insights into this physiologically eminently important process of sugar translocation in plants are still fragmentary. Here, we used the competitive inhibitor sucralose to gain a deeper understanding of the mechanism of Suc accumulation in plant cells. The Suc transporter SUT1 from maize, like other clade II SUTs (e.g., rice [Oryza sativa] SUT1 and sugarcane SUT1; Reinders et al., 2012b), shows a higher specificity for Suc than transporters of clade I. Similar to sugarcane SUT1 (Reinders et al., 2012b), transport currents of maize SUT1 were competitively inhibited by the presence of sucralose (Figure 1D). Using an elegant gene shuffling method (synthetic template shuffling), the lab of John Ward recently demonstrated that replacement of five amino acids was sufficient to convert a highly specific type II Suc transporter to a less specific type I–like Suc carrier/substrate specificity (Reinders et al., 2012b). Key residues determining the specificity of type II Suc carrier involve amino acids located in the extracellular loop1 between TMDI and TMDII, far away from the putative substrate binding site in the middle of the N-terminal TMDs. Interestingly, the authors concluded that the impermeability of type II carriers for sucralose or esculin is not based on differences in substrate binding but on the inability to translocate the bound substrate across the membrane. This conclusion could be further underpinned by the results presented here. With the help of the VCF technique, we visualized conformational changes within the maize SUT1 protein. Most pronounced fluorescence changes could be observed when the fluorescence label was coupled to the extracellular ends of TMDI or TMDII (SUT1-Y61C or -T72C; Figure 3), indicating that loop1 may be involved in substrate recognition/translocation. Application of sucralose inhibits this conformational change of SUT1 (Figures 4C to 4E), providing ultimate evidence that indeed the translocation of Suc derivates, such as sucralose, is hindered.
An experimentally fortunate feature of SUT1 is that this transporter can be highly expressed in the heterologous expression system of X. laevis oocytes and there mediates Suc-induced transport currents in the µA range (Carpaneto et al., 2005). Using the TEVC technique on SUT1-expressing oocytes, Carpaneto et al. (2010) resolved transient currents with fast deactivation kinetics in the absence of any substrate. These so-called pre–steady state currents reflect the binding of protons to SUT1 and thus indicate the first step in the reaction cycle of this transporter. In this study, we analyzed Ipre in deeper detail and combined these analyses with the visualization of protein motion. VCF measurements with the mutant SUT1-T72C revealed that conformational changes of the carrier protein are Suc independent with a weak pH dependence. Moreover, we demonstrated that the rate-limiting step within the reaction cycle of SUT1 is the conformational change between the inward and outward facing conformation. This is well in line with the early work of Komor et al. on the H+/Glc transport system of C. kessleri (Komor et al., 1972, 1973; Komor, 1973).
After applying the competitive inhibitor sucralose, the voltage-induced fluorescence changes decreased and reduced the slow pre–steady state current component in a sucralose concentration–dependent manner, while the fast component remained unaffected. All these results are well explainable by a simple transport mechanism (Figure 5). The proton and Suc binding sites of the H+/Suc transporter are alternately accessible from the cytosol or the extracellular medium (Figure 5, 1↔2). To explain our data, it is sufficient to assume that this switch is not dependent on the transmembrane voltage. However, the binding and the release of the proton is voltage dependent (rate constants KE1 and K1E in Figure 5) because it moves within the transmembrane electric field. The voltage-independent slow time constant τslow that is observable in pre–steady state currents in the absence of any other substrate is in the order of 1/KCE and 1/KEC if we reasonably assume that proton binding and release proceeds much faster than the conformational change of the transporter. Thus, SUT1 changes its access from the cytosolic to the extracellular site with a rate of ∼500 s−1, which coincides very well with known turnover rates of other proton-coupled transporters (Boorer et al., 1996b). If sucralose is offered as substrate at the extracellular side, transporters are blocked in the outward-facing conformation (Figures 4C, 4E, and 5, 2→4 and 3→5). Depending on the sucralose concentration, there are only a few transporters without sucralose that can still alternate between the two positions. This effect is visible in the pre–steady state currents by a decline of the amplitude of the slow time constant (τslow) below the detection limit and the strong reduction of the VCF signal. In summary, the model explains well the observations (1) that sucralose application reduces the mobility of the transporter and (2) that sucralose suppresses the slow time component of the pre–steady state currents. Our study resolves the binding of protons to the carrier and its interrelationship with the alternating movement of the protein. It thus allows us to grasp the molecular basis of the eminently physiologically important process of sugar translocation in plants.
Figure 5.

Schematic Representation of the First Steps in the Reaction Cycle of Maize SUT1.
The unbound Suc transporter alternates with voltage-independent rate constants KEC and KCE between two conformations (1↔2) exposing its H+ and Suc binding sites either to the extracellular (out; 2) or the intracellular face (in; 1). Extracellular protons can enter the transmembrane electrical field and associate with the transporter (3; rate constant [H]⋅KE1). Extracellular application of sucralose (scl) blocks the transporter in the outward-facing conformation (4 and 5).
METHODS
TEVC Analysis in Xenopus laevis Oocytes
The maize (Zea mays) SUT1 cRNA was prepared using AmpliCap-Max T7 High Yield Message Maker Kit (Biozym). Oocyte preparation and cRNA injection have been described elsewhere (Becker et al., 1996). For TEVC studies or pre–steady state measurements oocytes were perfused with a standard solution containing 30 mM potassium chloride (KCl), 1 mM calcium chloride2, 1mM magnesium chloride2, and 1 mM lanthanum chloride3 based on Tris/MES buffers for the pH values 5.6 and 7.5 or based on citrate/Tris buffers for the pH values 4.0 and 5.0. The Suc concentrations and pH values are indicated in the text and figure legends. Solutions were adjusted to 220 mOsmol kg−1 using d-sorbitol. To allow fast clamping, especially for pre–steady state measurements, the tips of the capillaries were broken to ∼1 µm diameter and back-filled with 1% agarose in 3 M KCl to prevent leakage of the 3 M KCl solution around the electrode, resulting in a constant 0.1 to 0.3 MΩ resistance (Schreibmayer et al., 1994).
Transport Currents and Membrane Capacitance Measurements
Parallel measurements of transport currents (Itr) and membrane capacitance (Cm) were performed using the TURBO-TEC10X amplifier (NPI Electronic) controlled by the Patchmaster software (HEKA Electronics). Based on paired voltage ramps, Cm was measured continuously using the approach from Schmitt and Koepsell (2002). During the TEVC measurements, the holding potential was −20 mV, while the oocytes were perfused with different bath solutions. The Suc-induced currents and the Suc-induced capacitance changes were measured in the voltage range between +60 and −160 mV in 10-mV decrements. Cm values were normalized to the value at −10 mV in the absence of Suc. SUT1-mediated transport currents (Itr) were calculated by subtracting the currents in the absence of substrate from the currents in the presence of substrate. The Suc-induced steady state currents were measured at fixed substrate concentration, pH, and membrane potential. From describing the currents with the Michaelis-Menten equation,
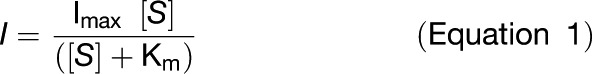 |
where [S] represents the Suc concentration, we obtained Km, the half-maximal ligand concentration, and Imax, the maximum current. The percentage of current inhibition induced by sucralose (Iin) was calculated as 100(I0 – Iscl)/I0, where I0 and Iscl were the currents recorded in the absence and in the presence of sucralose, respectively. Data were mathematically approximated by the equation:
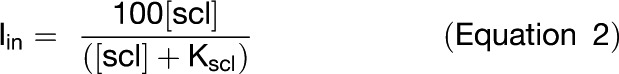 |
where [scl] is the sucralose concentration and Kscl the half-inhibition constant (IC50).
Pre–Steady State Currents
Pre–steady state currents were recorded using the TEVC technique essentially as described by Carpaneto et al. (2010). In brief, the current traces at saturating Suc concentration (100 mM) were subtracted from the traces in the absence of the substrate after forcing the stationary level to zero. From a holding potential of −20 mV, 20-ms voltage pulses from +60 to −160 mV in 10-mV decrements were applied.
For analysis of the inhibitory effect of sucralose, pre–steady state currents were obtained using the standard procedure described above with the exception that traces recorded at pH 4.0 in saturating external Suc were subtracted from traces in the presence of sucralose.
To investigate the effect of sucralose on the amplitude of the slow component of pre–steady state currents, we applied varying sucralose concentrations in the range of 1 to 100 mM sucralose. After subtracting traces of saturating Suc concentrations, the decay of Ipre was approximated by a sum of two exponential functions:
 |
For proper determination of the amplitude of the slow component of Ipre, both time constants were fixed to the average values obtained from independent pre–steady state analysis of more than 30 SUT1-expressing oocytes (τfast = 0.5 ms; τslow = 2 ms). At all tested sucralose concentrations, pre–steady state currents were described very well using this procedure. The obtained amplitude of the slow component of pre–steady state currents plotted as a function of the sucralose concentration was described with a Hill equation:
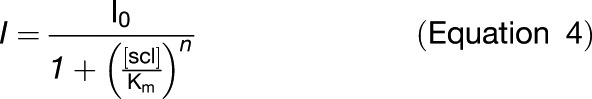 |
where [scl] represents the sucralose concentration, I0 the current at zero sucralose, and Km the sucralose concentration, at which the amplitude was 50% of the maximal amplitude at zero sucralose.
Labeling of Maize SUT1 Cys Residues with TMRM6
The sulfhydryl reagent TMRM (TMRM6; Molecular Probes, Life Technologies) is able to bind covalently to accessible Cys side chains of proteins. Oocytes expressing SUT1 mutants with artificially introduced Cys residues were incubated for 5 to 10 min at room temperature in the dark in freshly prepared ND96 buffer, pH 7.5, containing 10 µM TMRM6. After extensive washing in ND96 buffer, oocytes were kept in the dark until they were measured. Chosen time intervals and concentrations proved to be a reasonable compromise to receive good labeling results while minimizing unspecific labeling.
Two-Electrode Voltage Clamp (Epi)Fluorescence Measurements
Measurements were performed in a perfusion chamber with a cover slip at its bottom mounted on the stage of an inverse epifluorescence microscope (Zeiss IM35). Fluorescence was collected by a ×40 oil immersion objective (Zeiss Fluar ×40/1.3 oil), and currents were recorded under voltage clamp conditions using a TURBO-TEC10X amplifier (NPI Electronic) and an AD/DA interface ITC 18 (Instrutech). Fluorescence was excited by a high-power LED-based excitation system (CoolLED pE; Visitron Systems). A dichroic filter system (F41-007: Cy3, TRITC, Alexa 546/555; exciter HQ 545/30x; dichroic Q570 LP; emitter HQ 610/75m; AHF Analysentechnik) was used for TMRM6 excitation and fluorescence emission filtering. The fluorescence was detected with a photodiode-based fluorescence detection unit and a control unit with signal processing capabilities that provide signal conditioning (offset and gain) and simplify acquisition and analysis of the output signal (TILLPhotonics). The photodiode detector head consists of three-lens optics and a low-noise, high-sensitivity photodiode (0.4-mm diameter of sensitive area; Hamamatsu S5973-02) and a low-noise, high-gain current-to-voltage converter, which converts photocurrents to a voltage signal. Simultaneous measurements of the SUT1-mediated currents and the fluorescence were performed between +80 and −200 mV in 20-mV decrements controlled by Patchmaster software (HEKA Electronics).
Accession Number
Sequence data from this article can be found in the GenBank/EMBL databases under accession number AB008464 (maize SUT1).
Supplemental Data
The following materials are available in the online version of this article.
Supplemental Figure 1. Competitive Inhibition of Suc-Induced SUT1 Currents by Sucralose.
Supplemental Figure 2. Pre–Steady State Currents of SUT1-T72C at pH 4.0.
Supplemental Figure 3. Voltage-Dependent Fluorescence Changes of TMRM-Labeled SUT1-T72C Expressed in Oocytes.
Supplemental Figure 4. Maximal Fluorescence Changes of TMRM-Labeled SUT1-T72C upon Membrane Potential Steps.
Acknowledgments
D.G. and C.D. were supported by the Deutsche Forschungsgemeinschaft with Grant GE2195/1-1. I.D. was supported by grants from the Spanish Ministerio de Economía y Competitividad (BFU2011-28815) and a Marie-Curie Career Integration Grant (FP7-PEOPLE-2011-CIG No. 303674, Regopoc). A.C. was supported by grants from the Italian “Progetti di Ricerca di Interesse Nazionale” (PRIN2010CSJX4F).
AUTHOR CONTRIBUTIONS
A.C., C.D., D.G., E.B., and I.D. designed the research. A.W. and C.D. performed research. A.C. and I.D. contributed new analytic/computational tools to analyze pre–steady state currents and to simulate the SUT1 transport cycle. A.C., A.W., C.D., D.G., and I.D. analyzed data. A.C., C.D., D.G., and I.D. wrote the article.
Glossary
- VCF
voltage-clamp fluorometry
- TEVC
two-electrode voltage clamp
- TMRM
tetramethylrhodamine-6-maleimid
- TMD
transmembrane domain
References
- Abramson J., Smirnova I., Kasho V., Verner G., Kaback H.R., Iwata S. (2003). Structure and mechanism of the lactose permease of Escherichia coli. Science 301: 610–615 [DOI] [PubMed] [Google Scholar]
- Aoki N., Hirose T., Scofield G.N., Whitfeld P.R., Furbank R.T. (2003). The sucrose transporter gene family in rice. Plant Cell Physiol. 44: 223–232 [DOI] [PubMed] [Google Scholar]
- Aoki N., Hirose T., Takahashi S., Ono K., Ishimaru K., Ohsugi R. (1999). Molecular cloning and expression analysis of a gene for a sucrose transporter in maize (Zea mays L.). Plant Cell Physiol. 40: 1072–1078 [DOI] [PubMed] [Google Scholar]
- Becker D., Dreyer I., Hoth S., Reid J.D., Busch H., Lehnen M., Palme K., Hedrich R. (1996). Changes in voltage activation, Cs+ sensitivity, and ion permeability in H5 mutants of the plant K+ channel KAT1. Proc. Natl. Acad. Sci. USA 93: 8123–8128 [DOI] [PMC free article] [PubMed] [Google Scholar]
- Boorer K.J., Frommer W.B., Bush D.R., Kreman M., Loo D.D., Wright E.M. (1996b). Kinetics and specificity of a H+/amino acid transporter from Arabidopsis thaliana. J. Biol. Chem. 271: 2213–2220 [DOI] [PubMed] [Google Scholar]
- Boorer K.J., Loo D.D., Wright E.M. (1994). Steady-state and presteady-state kinetics of the H+/hexose cotransporter (STP1) from Arabidopsis thaliana expressed in Xenopus oocytes. J. Biol. Chem. 269: 20417–20424 [PubMed] [Google Scholar]
- Boorer K.J., Loo D.D., Frommer W.B., Wright E.M. (1996a). Transport mechanism of the cloned potato H+/sucrose cotransporter StSUT1. J. Biol. Chem. 271: 25139–25144 [DOI] [PubMed] [Google Scholar]
- Bossi E., Centinaio E., Castagna M., Giovannardi S., Vincenti S., Sacchi V.F., Peres A. (1999). Ion binding and permeation through the lepidopteran amino acid transporter KAAT1 expressed in Xenopus oocytes. J. Physiol. 515: 729–742 [DOI] [PMC free article] [PubMed] [Google Scholar]
- Bossi E., Renna M.D., Sangaletti R., D’Antoni F., Cherubino F., Kottra G., Peres A. (2011). Residues R282 and D341 act as electrostatic gates in the proton-dependent oligopeptide transporter PepT1. J. Physiol. 589: 495–510 [DOI] [PMC free article] [PubMed] [Google Scholar]
- Buch-Pedersen M.J., Pedersen B.P., Veierskov B., Nissen P., Palmgren M.G. (2009). Protons and how they are transported by proton pumps. Pflugers Arch. 457: 573–579. [DOI] [PubMed] [Google Scholar]
- Buckhout T.J. (1994). Kinetics analysis of the plasma membrane sucrose-H+ symporter from sugar beet (Beta vulgaris L.) leaves. Plant Physiol. 106: 991–998 [DOI] [PMC free article] [PubMed] [Google Scholar]
- Bush D.R. (1989). Proton-coupled sucrose transport in plasmalemma vesicles isolated from sugar-beet (Beta vulgaris L. cv Great Western) leaves. Plant Physiol. 89: 1318–1323 [DOI] [PMC free article] [PubMed] [Google Scholar]
- Bush D.R. (1990). Electrogenicity, ph-dependence, and stoichiometry of the proton-sucrose symport. Plant Physiol. 93: 1590–1596 [DOI] [PMC free article] [PubMed] [Google Scholar]
- Bush D.R. (1993). Inhibitors of the proton-sucrose symport. Arch. Biochem. Biophys. 307: 355–360 [DOI] [PubMed] [Google Scholar]
- Carpaneto A., Geiger D., Bamberg E., Sauer N., Fromm J., Hedrich R. (2005). Phloem-localized, proton-coupled sucrose carrier ZmSUT1 mediates sucrose efflux under the control of the sucrose gradient and the proton motive force. J. Biol. Chem. 280: 21437–21443 [DOI] [PubMed] [Google Scholar]
- Carpaneto A., Koepsell H., Bamberg E., Hedrich R., Geiger D. (2010). Sucrose- and H-dependent charge movements associated with the gating of sucrose transporter ZmSUT1. PLoS ONE 5: e12605. [DOI] [PMC free article] [PubMed] [Google Scholar]
- Chandran D., Reinders A., Ward J.M. (2003). Substrate specificity of the Arabidopsis thaliana sucrose transporter AtSUC2. J. Biol. Chem. 278: 44320–44325 [DOI] [PubMed] [Google Scholar]
- Cherubino, F., Bossi, E., Miszner, A., Ghezzi, C., and Peres, A. (2010). Transient currents in the glycine cotransporter GlyT1 reveal different steps in transport mechanism. J. Mol. Neurosci. 41: 243–251. [DOI] [PubMed] [Google Scholar]
- Deeken R., Geiger D., Fromm J., Koroleva O., Ache P., Langenfeld-Heyser R., Sauer N., May S.T., Hedrich R. (2002). Loss of the AKT2/3 potassium channel affects sugar loading into the phloem of Arabidopsis. Planta 216: 334–344 [DOI] [PubMed] [Google Scholar]
- Delrot S. (1981). Proton fluxes associated with sugar uptake in Vicia faba leaf tissues. Plant Physiol. 68: 706–711 [DOI] [PMC free article] [PubMed] [Google Scholar]
- Delrot S., Bonnemain J.L. (1981). Involvement of protons as a substrate for the sucrose carrier during phloem loading in Vicia faba leaves. Plant Physiol. 67: 560–564 [DOI] [PMC free article] [PubMed] [Google Scholar]
- Dinant S., Bonnemain J.L., Girousse C., Kehr J. (2010). Phloem sap intricacy and interplay with aphid feeding. C. R. Biol. 333: 504–515 [DOI] [PubMed] [Google Scholar]
- Egenberger B., Gorboulev V., Keller T., Gorbunov D., Gottlieb N., Geiger D., Mueller T.D., Koepsell H. (2012). A substrate binding hinge domain is critical for transport-related structural changes of organic cation transporter 1. J. Biol. Chem. 287: 31561–31573 [DOI] [PMC free article] [PubMed] [Google Scholar]
- Fesce R., Giovannardi S., Binda F., Bossi E., Peres A. (2002). The relation between charge movement and transport-associated currents in the rat GABA cotransporter rGAT1. J. Physiol. 545: 739–750 [DOI] [PMC free article] [PubMed] [Google Scholar]
- Forster I., Hernando N., Biber J., Murer H. (1998). The voltage dependence of a cloned mammalian renal type II Na+/Pi cotransporter (NaPi-2). J. Gen. Physiol. 112: 1–18 [DOI] [PMC free article] [PubMed] [Google Scholar]
- Gaxiola R.A., Palmgren M.G., Schumacher K. (2007). Plant proton pumps. FEBS Lett. 581: 2204–2214 [DOI] [PubMed] [Google Scholar]
- Geibel S., Kaplan J.H., Bamberg E., Friedrich T. (2003). Conformational dynamics of the Na+/K+-ATPase probed by voltage clamp fluorometry. Proc. Natl. Acad. Sci. USA 100: 964–969 [DOI] [PMC free article] [PubMed] [Google Scholar]
- Geiger D.R., Giaquinta R.T., Sovonick S.A., Fellows R.J. (1973). Solute distribution in sugar beet leaves in relation to phloem loading and translocation. Plant Physiol. 52: 585–589 [DOI] [PMC free article] [PubMed] [Google Scholar]
- Giaquinta R. (1976). Evidence for phloem loading from the apoplast: Chemical modification of membrane sulfhydryl groups. Plant Physiol. 57: 872–875 [DOI] [PMC free article] [PubMed] [Google Scholar]
- Giovannardi S., Fesce R., Bossi E., Binda F., Peres A. (2003). Cl− affects the function of the GABA cotransporter rGAT1 but preserves the mutal relationship between transient and transport currents. Cell. Mol. Life Sci. 60: 550–556 [DOI] [PMC free article] [PubMed] [Google Scholar]
- Gottwald J.R., Krysan P.J., Young J.C., Evert R.F., Sussman M.R. (2000). Genetic evidence for the in planta role of phloem-specific plasma membrane sucrose transporters. Proc. Natl. Acad. Sci. USA 97: 13979–13984 [DOI] [PMC free article] [PubMed] [Google Scholar]
- Hilgemann D.W., Lu C.C. (1999). GAT1 (GABA:Na+:Cl-) cotransport function. Database reconstruction with an alternating access model. J. Gen. Physiol. 114: 459–475 [DOI] [PMC free article] [PubMed] [Google Scholar]
- Kaback H.R., Dunten R., Frillingos S., Venkatesan P., Kwaw I., Zhang W., Ermolova N. (2007). Site-directed alkylation and the alternating access model for LacY. Proc. Natl. Acad. Sci. USA 104: 491–494 [DOI] [PMC free article] [PubMed] [Google Scholar]
- Klamo E.M., Drew M.E., Landfear S.M., Kavanaugh M.P. (1996). Kinetics and stoichiometry of a proton/myo-inositol cotransporter. J. Biol. Chem. 271: 14937–14943 [DOI] [PubMed] [Google Scholar]
- Komor E. (1973). Proton-coupled hexose transport in Chlorella vulgaris. FEBS Lett. 38: 16–18 [DOI] [PubMed] [Google Scholar]
- Komor E., Haass D., Komor B., Tanner W. (1973). The active hexose-uptake system of Chlorella vulgaris Km-values for 6-deoxyglucose influx and efflux and their contribution to sugar accumulation. Eur. J. Biochem. 39: 193–200. [DOI] [PubMed] [Google Scholar]
- Komor E., Haass D., Tanner W. (1972). Unusual features of the active hexose uptake system of Chlorella vulgaris. Biochim. Biophys. Acta 266: 649–660 [DOI] [PubMed] [Google Scholar]
- Komor E., Rotter M., Tanner W. (1977). A proton-cotransport system in a higher plant: Sucrose transport in Ricinus communis. Plant Sci. Lett. 9: 153–162 [Google Scholar]
- Komor E., Tanner W. (1974). The hexose-proton symport system of Chlorella vulgaris Specificity, stoichiometry and energetics of sugar-induced proton uptake. Eur. J. Biochem. 44: 219–223. [DOI] [PubMed] [Google Scholar]
- Komor E., Tanner W. (1976). The determination of the membrane ptoential of Chlorella vulgaris Evidence for electrogenic sugar transport. Eur. J. Biochem. 70: 197–204. [DOI] [PubMed] [Google Scholar]
- Lester H.A., Cao Y., Mager S. (1996). Listening to neurotransmitter transporters. Neuron 17: 807–810 [DOI] [PubMed] [Google Scholar]
- Lohaus G., Burba M., Heldt H.W. (1994). Comparison of the contents of sucrose and amino-acids in the leaves, phloem sap and taproots of high and low sugar-producing hybrids of sugar-beet (Beta-vulgaris L). J. Exp. Bot. 45: 1097–1101 [Google Scholar]
- Lohaus, G., and Fischer, K. (2004). Intracellular and intercellular transport of nitrogen and carbon. In Photosynthetic Nitrogen Assimilation and Associated Carbon and Respiratory Metabolism, C. Foyer and G. Noctor, eds (Dordrecht, The Netherlands: Springer), pp. 239–263. [Google Scholar]
- Lohaus G., Hussmann M., Pennewiss K., Schneider H., Zhu J.J., Sattelmacher B. (2000). Solute balance of a maize (Zea mays L.) source leaf as affected by salt treatment with special emphasis on phloem retranslocation and ion leaching. J. Exp. Bot. 51: 1721–1732 [DOI] [PubMed] [Google Scholar]
- Lohaus G., Winter H., Riens B., Heldt H.W. (1995). Further-studies of the phloem loading process in leaves of barley and spinach - The comparison of metabolite concentrations in the apoplastic compartment with those in the cytosolic compartment and in the sieve tubes. Bot. Acta 108: 270–275 [Google Scholar]
- Loo D.D., Hazama A., Supplisson S., Turk E., Wright E.M. (1993). Relaxation kinetics of the Na+/glucose cotransporter. Proc. Natl. Acad. Sci. USA 90: 5767–5771 [DOI] [PMC free article] [PubMed] [Google Scholar]
- Loo D.D., Hirayama B.A., Gallardo E.M., Lam J.T., Turk E., Wright E.M. (1998). Conformational changes couple Na+ and glucose transport. Proc. Natl. Acad. Sci. USA 95: 7789–7794 [DOI] [PMC free article] [PubMed] [Google Scholar]
- Loo D.D., Hirayama B.A., Karakossian M.H., Meinild A.K., Wright E.M. (2006). Conformational dynamics of hSGLT1 during Na+/glucose cotransport. J. Gen. Physiol. 128: 701–720 [DOI] [PMC free article] [PubMed] [Google Scholar]
- Lu C.C., Hilgemann D.W. (1999a). GAT1 (GABA:Na+:Cl-) cotransport function. Kinetic studies in giant Xenopus oocyte membrane patches. J. Gen. Physiol. 114: 445–457 [DOI] [PMC free article] [PubMed] [Google Scholar]
- Lu C.C., Hilgemann D.W. (1999b). GAT1 (GABA:Na+:Cl-) cotransport function. Steady state studies in giant Xenopus oocyte membrane patches. J. Gen. Physiol. 114: 429–444 [DOI] [PMC free article] [PubMed] [Google Scholar]
- Mager S., Kleinberger-Doron N., Keshet G.I., Davidson N., Kanner B.I., Lester H.A. (1996). Ion binding and permeation at the GABA transporter GAT1. J. Neurosci. 16: 5405–5414. [DOI] [PMC free article] [PubMed] [Google Scholar]
- Majumdar D.S., Smirnova I., Kasho V., Nir E., Kong X., Weiss S., Kaback H.R. (2007). Single-molecule FRET reveals sugar-induced conformational dynamics in LacY. Proc. Natl. Acad. Sci. USA 104: 12640–12645 [DOI] [PMC free article] [PubMed] [Google Scholar]
- Mannuzzu L.M., Moronne M.M., Isacoff E.Y. (1996). Direct physical measure of conformational rearrangement underlying potassium channel gating. Science 271: 213–216 [DOI] [PubMed] [Google Scholar]
- Marger M.D., Saier M.H., Jr (1993). A major superfamily of transmembrane facilitators that catalyse uniport, symport and antiport. Trends Biochem. Sci. 18: 13–20 [DOI] [PubMed] [Google Scholar]
- Morsomme P., Boutry M. (2000). The plant plasma membrane H(+)-ATPase: Structure, function and regulation. Biochim. Biophys. Acta 1465: 1–16 [DOI] [PubMed] [Google Scholar]
- Nussberger S., Steel A., Trotti D., Romero M.F., Boron W.F., Hediger M.A. (1997). Symmetry of H+ binding to the intra- and extracellular side of the H+-coupled oligopeptide cotransporter PepT1. J. Biol. Chem. 272: 7777–7785 [DOI] [PubMed] [Google Scholar]
- Ohshima T., Hayashi H., Chino M. (1990). Collection and chemical-composition of pure phloem sap from Zea-Mays L. Plant Cell Physiol. 31: 735–737 [Google Scholar]
- Palmgren M.G. (2001). Plant plasma membrane H+-ATPases: Powerhouses for nutrient uptake. Annu. Rev. Plant Physiol. Plant Mol. Biol. 52: 817–845 [DOI] [PubMed] [Google Scholar]
- Parent L., Supplisson S., Loo D.D., Wright E.M. (1992a). Electrogenic properties of the cloned Na+/glucose cotransporter: I. Voltage-clamp studies. J. Membr. Biol. 125: 49–62 [DOI] [PubMed] [Google Scholar]
- Parent L., Supplisson S., Loo D.D., Wright E.M. (1992b). Electrogenic properties of the cloned Na+/glucose cotransporter: II. A transport model under nonrapid equilibrium conditions. J. Membr. Biol. 125: 63–79 [DOI] [PubMed] [Google Scholar]
- Peres, A., Giovannardi, S., Bossi, E., and Fesce, R. (2004). Electrophysiological insights into the mechanism of ion-coupled cotransporters. News Physiol. Sci. 19: 80–84. [DOI] [PubMed]
- Pescod K.V., Quick W.P., Douglas A.E. (2007). Aphid responses to plants with genetically manipulated phloem nutrient levels. Physiol. Entomol. 32: 253–258 [Google Scholar]
- Reinders, A., Sivitz, A.B., and Ward, J.M. (2012a). Evolution of plant sucrose uptake transporters. Front. Plant Sci. 3: 22. [DOI] [PMC free article] [PubMed]
- Reinders A., Sivitz A.B., Hsi A., Grof C.P., Perroux J.M., Ward J.M. (2006). Sugarcane ShSUT1: Analysis of sucrose transport activity and inhibition by sucralose. Plant Cell Environ. 29: 1871–1880 [DOI] [PubMed] [Google Scholar]
- Reinders A., Sun Y., Karvonen K.L., Ward J.M. (2012b). Identification of amino acids important for substrate specificity in sucrose transporters using gene shuffling. J. Biol. Chem. 287: 30296–30304 [DOI] [PMC free article] [PubMed] [Google Scholar]
- Riesmeier J.W., Willmitzer L., Frommer W.B. (1994). Evidence for an essential role of the sucrose transporter in phloem loading and assimilate partitioning. EMBO J. 13: 1–7 [DOI] [PMC free article] [PubMed] [Google Scholar]
- Saier M.H., Jr, Tran C.V., Barabote R.D. (2006). TCDB: The Transporter Classification Database for membrane transport protein analyses and information. Nucleic Acids Res. 34 (Database issue): D181–D186 [DOI] [PMC free article] [PubMed] [Google Scholar]
- Sauer N., Tanner W. (1989). The hexose carrier from Chlorella. cDNA cloning of a eucaryotic H+-cotransporter. FEBS Lett. 259: 43–46 [DOI] [PubMed] [Google Scholar]
- Schmitt B.M., Koepsell H. (2002). An improved method for real-time monitoring of membrane capacitance in Xenopus laevis oocytes. Biophys. J. 82: 1345–1357 [DOI] [PMC free article] [PubMed] [Google Scholar]
- Schreibmayer W., Lester H.A., Dascal N. (1994). Voltage clamping of Xenopus laevis oocytes utilizing agarose-cushion electrodes. Pflugers Arch. 426: 453–458 [DOI] [PubMed] [Google Scholar]
- Sivitz A.B., Reinders A., Johnson M.E., Krentz A.D., Grof C.P.L., Perroux J.M., Ward J.M. (2007). Arabidopsis sucrose transporter AtSUC9. High-affinity transport activity, intragenic control of expression, and early flowering mutant phenotype. Plant Physiol. 143: 188–198 [DOI] [PMC free article] [PubMed] [Google Scholar]
- Sivitz A.B., Reinders A., Ward J.M. (2005). Analysis of the transport activity of barley sucrose transporter HvSUT1. Plant Cell Physiol. 46: 1666–1673 [DOI] [PubMed] [Google Scholar]
- Slewinski T.L., Garg A., Johal G.S., Braun D.M. (2010). Maize SUT1 functions in phloem loading. Plant Signal. Behav. 5: 687–690 [DOI] [PMC free article] [PubMed] [Google Scholar]
- Slewinski T.L., Meeley R., Braun D.M. (2009). Sucrose transporter1 functions in phloem loading in maize leaves. J. Exp. Bot. 60: 881–892 [DOI] [PMC free article] [PubMed] [Google Scholar]
- Slone J.H., Buckhout T.J. (1991). Sucrose-dependent H+ transport in plasma-membrane vesicles isolated from sugar-beet leaves (Beta-Vulgaris L) - Evidence in support of the H+-symport model for sucrose transport. Planta 183: 584–589 [DOI] [PubMed] [Google Scholar]
- Slone J.H., Buckhout T.J., Vanderwoude W.J. (1991). Symport of proton and sucrose in plasma membrane vesicles isolated from spinach leaves. Plant Physiol. 96: 615–618 [DOI] [PMC free article] [PubMed] [Google Scholar]
- Smirnova I.N., Kasho V., Kaback H.R. (2008). Protonation and sugar binding to LacY. Proc. Natl. Acad. Sci. USA 105: 8896–8901 [DOI] [PMC free article] [PubMed] [Google Scholar]
- Stadler R., Wolf K., Hilgarth C., Tanner W., Sauer N. (1995). Subcellular localization of the inducible Chlorella HUP1 monosaccharide-H+ symporter and cloning of a co-induced galactose-H+ symporter. Plant Physiol. 107: 33–41 [DOI] [PMC free article] [PubMed] [Google Scholar]
- Su A., Mager S., Mayo S.L., Lester H.A. (1996). A multi-substrate single-file model for ion-coupled transporters. Biophys. J. 70: 762–777 [DOI] [PMC free article] [PubMed] [Google Scholar]
- Sun Y., Reinders A., LaFleur K.R., Mori T., Ward J.M. (2010). Transport activity of rice sucrose transporters OsSUT1 and OsSUT5. Plant Cell Physiol. 51: 114–122 [DOI] [PMC free article] [PubMed] [Google Scholar]
- Wippel K., Wittek A., Hedrich R., Sauer N. (2010). Inverse pH regulation of plant and fungal sucrose transporters: A mechanism to regulate competition for sucrose at the host/pathogen interface? PLoS ONE 5: e12429. [DOI] [PMC free article] [PubMed] [Google Scholar]
- Yan N. (2013). Structural advances for the major facilitator superfamily (MFS) transporters. Trends Biochem. Sci. 38: 151–159 [DOI] [PubMed] [Google Scholar]
- Zhou Y., Guan L., Freites J.A., Kaback H.R. (2008). Opening and closing of the periplasmic gate in lactose permease. Proc. Natl. Acad. Sci. USA 105: 3774–3778 [DOI] [PMC free article] [PubMed] [Google Scholar]
- Zhou J., Theodoulou F., Sauer N., Sanders D., Miller A.J. (1997). A kinetic model with ordered cytoplasmic dissociation for SUC1, an Arabidopsis H+/sucrose cotransporter expressed in Xenopus oocytes. J. Membr. Biol. 159: 113–125 [DOI] [PubMed] [Google Scholar]