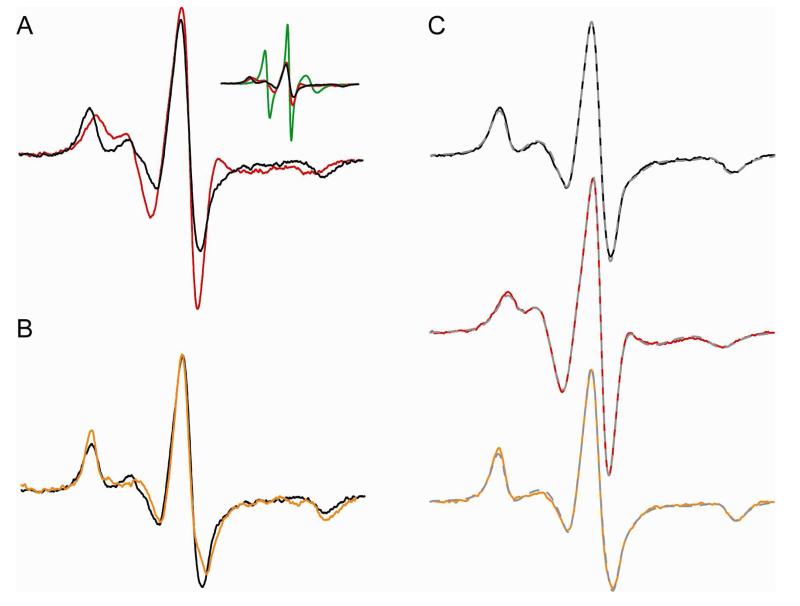
Figure 4.
CW-EPR data show Ca2+-induced dimerization of recoverin. (A) CW-EPR spectra for myristoylated recoverin (110 μM), spin labeled at the native cysteine residue (Cys39) in the Ca2+ free state (red) and Ca2+ bound state (black). Inset shows spectral comparison with the normalized spectrum of denatured protein (10% SDS; green trace). (B) CW-EPR spectra for Ca2+-bound recoverin in the presence of 30% sucrose (orange trace) and without sucrose (black). (C) Simulated EPR spectra (broken gray traces) are overlayed on top of the experimental spectra of recoverin in Ca2+-bound state (black), Ca2+-free state (red) and Ca2+-bound state in the presence of sucrose (orange trace). The simulated spectra were generated by the NLSL program. The rotational correlation times derived from the simulated spectra were 13 ns (Ca2+-free), 29 ns (Ca2+-bound), and 53 ns (Ca2+-bound in the presence of 30% sucrose (w/v)).

