

Abstract
Some serine hydrolases also catalyze a promiscuous reaction – reversible perhydrolysis of carboxylic acids to make peroxycarboxylic acids. Five x-ray crystal structures of these carboxylic acid perhydrolases show a proline in the oxyanion loop. Here, we test whether this proline is essential for high perhydrolysis activity using Pseudomonas fluorescens esterase (PFE). The L29P variant of this esterase catalyzes perhydrolysis 43-fold faster (kcat comparison) than wild type. Surprisingly, saturation mutagenesis at the 29 position of PFE identified six other amino acid substitutions that increase perhydrolysis of acetic acid at least fourfold over wild type. The best variant, L29I PFE, catalyzed perhydrolysis 83 times faster (kcat comparison) than wild-type PFE and twice as fast as L29P PFE. Despite the different amino acid in the oxyanion loop, L29I PFE shows a similar selectivity for hydrogen peroxide over water as L29P PFE (β0 = 170 M−1 vs. 160 M−1), and a similar fast formation of acetyl-enzyme (140 U/mg vs. 62 U/mg). X-ray crystal structures of L29I PFE with and without bound acetate show an unusual mixture of two different oxyanion loop conformations. The type II β-turn conformation resembles the wild-type structure and is unlikely to increase perhydrolysis, but the type I β-turn conformation creates a binding site for a second acetate. Modeling suggests that a previously proposed mechanism for L29P PFE can be extended to include L29I PFE where an acetate accepts a hydrogen bond to promote faster formation of the acetyl enzyme.
Keywords: esterase, perhydrolysis, protein engineering, peracetic acid, x-ray crystallography, kinetics, mechanism
Introduction
Perhydrolysis is the formation of peroxycarboxylic acids from hydrogen peroxide and either carboxylic acids or carboxylic acid esters. Some serine hydrolases also catalyze perhydrolysis as a promiscuous reaction and are sometimes called perhydrolases. Some were initially called metal-free haloperoxidases.[1] Perhydrolysis of carboxylic acids and perhydrolysis of carboxylic acid esters have different requirements, so perhydrolases are usually efficient for only one of these reactions. This paper focuses on perhydrolysis of carboxylic acids, but includes a few experiments measure the perhydrolysis of esters to determine the relative amounts of hydrolysis and perhydrolysis. A future paper will focus on perhydrolysis of esters in more detail. Perhydrolysis is an important reaction to make peroxycarboxylic acids, which are useful oxidants in organic chemistry[2], for lignin removal[3,4] and pulp bleaching[5] and for disinfecting wastewater[6] and disinfecting equipment for food and medical applications.[7–9]
The defining structural feature of all carboxylic acid perhydrolases identified so far is a proline in the oxyanion loop, Figure 1. The five x-ray crystal structures of carboxylic acid perhydrolases all show a proline in the oxyanion loop with a cis amide bond. Compared to a related esterase, (Pseudomonas fluorescens esterase, PFE[10]) this proline residue moves the oxyanion loop closer to the active site. In a typical esterase like PFE, the distance between carbonyl oxygen of amino acid after proline and the active site S94-Oγ is 6.2 Å. For perhydrolases this distance is ~1 Å closer: 5.1 Å in bromoperoxidase A1,[11] 5.3 Å in (−)-γ-lactamase,[12] 5.6 Å in chloroperoxidase-T,[11] 5.2 Å in chloroperoxidase-L,[11] and 5.3 Å in dihydrocoumarin hydrolase[13] (based on a homology model using Pseudomonas putida esterase, [14] which shares 76% sequence identity, as a template). Site-directed mutagenesis of PFE to introduce this proline increased its perhydrolysis activity 43-fold and, as in other perhydrolases, moved the carbonyl oxygen of W28 closer to the active.[15,16] The O–O distance from W28 carbonyl oxygen to the active site S94-Oγ decreased to 5.5 Å. This L29P substitution fully accounted for the difference in perhydrolysis abilities between the esterase PFE and perhydrolases.
Figure 1.

All carboxylic acid perhydrolases identified up to now contain a shortened O–O distance between S94-Oγ and a carbonyl oxygen next to the proline in the oxyanion loop (5.1–5.5 Å). Abbreviations and protein data bank codes: bromoperoxidase-A1, BPO-A1 (1a8q); chloroperoxidase-T CPO-T (1a7u); chlorperoxidase-L, CPO-L, (1a88); dihydrocoumarin hydrolase, DCH (modeled from 1zoi); (−)-γ-lactamase (1hkh; shows two conformations of the S94-Oγ.).
The catalytic mechanism for serine-hydrolase catalyzed perhydrolysis is similar to that for hydrolysis.[16] First, acetic acid reacts with the active site serine to form an acetyl enzyme intermediate. Second, hydrogen peroxide react with the acetyl enzyme to form peracetic acid. The rate determining step in perhydrolysis of carboxylic acids is the first step. Perhydrolases catalyze the formation of the acetyl enzyme faster than esterases and therefore catalyze perhydrolysis faster than esterases.[17]
It is unlikely that perhydrolysis is the natural function of perhydrolases. Peroxycarboxylic acids are reactive oxidants often used as disinfectants,[6–9] so it is unlikely that evolution would favor formation of peroxycarboxylic acids. Second, the natural concentrations of hydrogen peroxide are low[18], so very small amounts of peroxycarboxylic acids could be formed by perhydrolysis of carboxylic acids. Instead, perhydrolysis is an accidental[19] function of these enzymes. The serine hydrolases that catalyze carboxylic acid perhydrolysis also catalyze hydrolysis of lactones[13] or lactams[12] and this may be their natural role. Understanding the molecular basis of perhydrolysis is an important step to the design of more efficient enzymes for this reaction and to understand how new, unnatural functions occur in enzymes. If perhydrolysis is an accidental activity, then perhydrolases have not evolved to optimize perhydrolysis activity. There may be other oxyanion loop conformations that promote perhydrolysis. In this paper, we test this hypothesis by site-saturation mutagenesis at the 29 position of Pseudomonas fluorescens esterase (PFE). We find that L29I PFE is an even better carboxylic acid perhydrolase than L29P for kcat, but the x-ray crystal structure of L29I PFE shows an unexpected orientation of the oxy-anion loop. This alternative solution is novel for three reasons. First, the substitution is very different from proline, but yields similar kinetic behavior. Second, it is a solution that does not occur in nature; the fact that perhydrolysis is an unnatural activity may be reason. Third, the apparently minor change of leucine in the wild type to isoleucine causes a large change in perhydrolysis activity. We propose a general mechanism to speed up perhydrolysis that is consistent with both structures as summarized in Figure 2.
Figure 2.
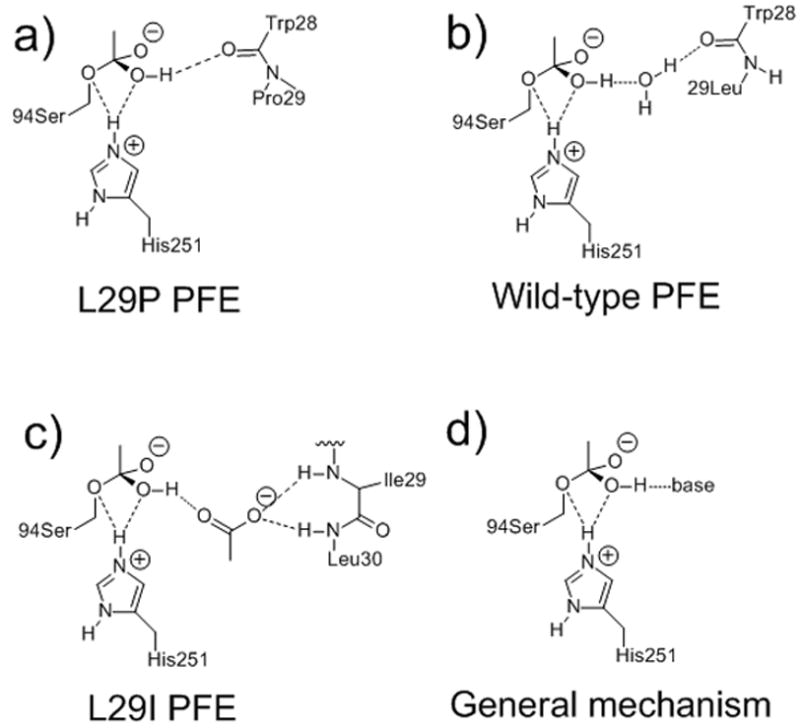
Molecular mechanisms to promote acetyl enzyme formation, which is the rate-limiting step in perhydrolysis of acetic acid. a) Carboxylic acid perhydrolases with a proline in the oxyanion loop, such as L29P PFE, use the main chain carbonyl as a base to accept a hydrogen bond from the Td1-OH intermediate. b) Wild-type PFE requires a water molecule bridge to accept a hydrogen bond from the Td1-OH, but the bridge can also donate a hydrogen bond to Td1-OH, which hinders water loss. c) L29I PFE uses an acetate, held by the main chain amides (N–H) of I29 and L30, to accept a hydrogen bond. d) General mechanism. For clarity, all diagrams omit the oxyanion hole (main chain amide of M95 and W28) and the catalytic aspartate.
Results
Saturation mutagenesis at Leu29 of PFE
Saturation mutagenesis at position 29 of PFE revealed that variant L29I PFE catalyzed perhydrolysis of acetic acid at 14 U/mg, which is even faster than L29P PFE (9.9 U/mg). Figure S1 contains details of the screening experiments.
Relative initial rates of perhydrolysis and hydrolysis from steady state kinetics
Perhydrolysis of acetic acid and ethyl acetate were measured using the monochlorodimedone assay[20] with wild-type, L29I, and L29P PFE. Varying acetic acid or ethyl acetate concentration at a constant hydrogen peroxide concentration of 10 mM (2–6 × Km for these variants) yielded the steady state kinetic constants for acetic acid or ethyl acetate, while varying the hydrogen peroxide concentration at a constant acetic acid concentration of 2 M (approximately 4–10 × Km) yielded the steady state kinetic constants for hydrogen peroxide, Table 1. L29I PFE catalyzed the perhydrolysis of acetic acid with similar efficiency (kcat/Km comparison) as L29P PFE while being 100-fold more efficient than wild-type PFE. L29I PFE catalyzes perhydrolysis of ethyl acetate 440-fold more efficiently (kcat/Km comparison) than L29P PFE. The higher efficiency comes from both higher kcat and lower Km for ethyl acetate. Compared to wild-type PFE, L29I PFE is twofold less efficient at perhydrolysis of ethyl acetate; the twofold higher Km towards ethyl acetate causes this decrease.
Table 1.
Steady state kinetic constants for perhydrolysis of acetic acid and ethyl acetate, and hydrolysis of ethyl acetate and peracetic acid catalyzed by wild-type, L29P and L29I PFE.
| Enzyme | varied substrate | kcat [s−1] | Km (H2O2) [mM] | Km (acetyl donor) [mM] | kcat/Km (H2O2) [s−1 M−1] | kcat/Km (acetyl donor) [s−1 M−1]a |
|---|---|---|---|---|---|---|
| Perhydrolysis
| ||||||
| Wild-type PFEb | acetic acidc | 0.12 ± 0.02 | 500 ± 140 | 0.2 | ||
| Wild-type PFEb | hydrogen peroxide | 0.094 ± 0.002 | 3.3 ± 0.2 | 28 | ||
| L29P PFEb | acetic acidc | 5.1 ± 0.4 | 210 ± 60 | 20 | ||
| L29P PFEb | hydrogen peroxide | 4.4 ± 0.2 | 1.8 ± 0.2 | 2000 | ||
| L29I PFE | acetic acidc | 10 ± 1 | 400 ± 50 | 25 | ||
| L29I PFE | hydrogen peroxide | 11 ± 1 | 5.7 ± 0.9 | 2000 | ||
| Wild-type PFEd | ethyl acetate | 12 ± 0.5 | 15 ± 2 | 800 | ||
| L29P PFEd | ethyl acetate | <0.5e | >600 | 0.9 | ||
| L29I PFEd | ethyl acetate | 14 ± 0.5 | 36 ± 5.4 | 400 | ||
|
| ||||||
| Hydrolysisf
| ||||||
| Wild-type PFEb | ethyl acetate | 8.8 ± 1.1 | 33 ± 1 | 300 | ||
| L29P PFEb | ethyl acetate | 0.67 ± 0.05 | 160 ± 30 | 4 | ||
| L29I PFE | ethyl acetate | 16 ± 2.6 | 29 ± 1.3 | 550 | ||
| Wild-type PFEb | peracetic acid | 100 ± 3 | 0.041 ± 0.005 | 2 × 10⁶ | ||
| L29P PFEb | peracetic acid | 139 ± 2 | <0.003 | >5 × 10⁷ | ||
| L29I PFE | peracetic acid | 240 ± 2 | <0.003 | >8 × 10⁷ | ||
Experimental error limits the values of kcat/KM to one significant figure in most cases.
From reference 6.
Acetic acid is the substrate for the enzyme, even though at pH 5.5 approximately 85 mol% is in the acetate form. The concentrations refer to the sum of both acetic acid and acetate.
Kinetic constants for acetic acid and L29I were obtained by varying acetic acid concentrations at a constant hydrogen peroxide concentration of 10 mM, which may not completely saturate some variants. In these cases, the kinetic constants are apparent kinetic constants. Kinetic constants for hydrogen peroxide and L29I were obtained by varying hydrogen peroxide concentration at constant acetic acid concentration of 2.0 M. The pH was 5.5. Rate of perhydrolysis of ethyl acetate was measured using the monochlorodimedone at pH 6.5 with 100 mM citrate buffer. The kcat values assume that all the enzyme molecules in solution are catalytically active. The enzymes maintain full activity in 10 mM hydrogen peroxide for at least several hours.
Estimated from the observed rate at the highest ethyl acetate concentration.
Hydrolysis was measured using a pH indicator assay[21] at pH 7.2. The solutions contained 0.9 mM p-nitrophenol as a pH indicator in 5.0 mM BES buffer and were monitored spectrophotometrically at 404 nm. Hydrolysis of peracetic acid was measured at 23 °C using a pHstat at pH 5.5.
Hydrolysis of ethyl acetate was measured using p-nitrophenol[21] as a pH indicator at pH 7.2, while hydrolysis of peracetic acid was measured using a pH-stat at pH 5.5.[16] L29I PFE was 140-times more efficient than L29P PFE at hydrolysis of ethyl acetate. L29I PFE was also twofold more efficient than wild-type PFE. L29I PFE is more efficient both due to a higher kcat and a lower Km. L29I PFE catalyzed hydrolysis of peracetic acid approximately twice as fast (kcat) as wild-type PFE and L29P PFE. The Km of L29I PFE toward peracetic acid is very low and could not be measured using pH-stat method; the minimum value of kcat/Km value is near the limit of diffusion.
The catalytic activity of this new perhydrolase toward acetic acid is comparable to some natural perhydrolases, but less than that of others. The first order rate constant for L29I PFE (10 s−1) is faster than BPO-A2 (7.5 s−1),[22] nearly as fast as CPO-L(19 s−1)[23] and BPO-A1(22 s−1),[22] but much slower than DCH(100 s−1).[13] These first order rate constants were calculated from the reported specific activities (U/mg) of these perhydrolases and are minimum values for these rate constants. Carboxylic acid perhydrolases are typically poor hydrolases and perhydrolases for esters; for example, L29P PFE shows very slow hydrolysis or perhydrolysis of ethyl acetate. L29I PFE is an exception because it catalyzes hydrolysis and perhydrolysis of ethyl acetate at rates similar to wild-type PFE.
Selectivity of L29I for hydrogen peroxide over water is similar to that for L29P PFE
The selectivities of L29I PFE for hydrogen peroxide over water were measured using methyl acetate as the substrate.[17] Methyl acetate can form either acetic or peracetic acid, allowing measurement of the nucleophile selectivity. A pH-stat detected hydrolysis of methyl acetate at pH 7.2 where the product acetic acid ionizes completely. Competing perhydrolysis forms peracetic acid, which ionizes to a relatively small amount (10%) at pH 7.2, and thus contributes little to the pH change. To determine the rate of peracetic acid formation, the reaction is repeated with added sodium bromide to the hydrogen peroxide solution. Sodium bromide reacts with peracetic acid to form hypobromous acid and eventually bromine. Hydrogen peroxide reduces bromine to hydrogen bromide,[24] which is detected by the pH stat. Thus, measuring the rate of proton release without NaBr reveals the rates of hydrolysis, while measuring the rate of proton release with NaBr reveals the sum of hydrolysis and perhydrolysis. The rate of perhydrolysis is the difference between the two rates, eq. 1.
| (1) |
A plot of the rate of perhydrolysis relative to hydrolysis (the selectivity for perhydrolysis) as a function of hydrogen peroxide concentration shows a hyperbolic saturation curve, Figure 3. The relative amount of perhydrolysis increases with increasing hydrogen peroxide concentration and then reaches a plateau.
Figure 3.

The ratios of initial rates of perhydrolysis and hydrolysis of methyl acetate catalyzed by wild-type, L29P, and L29I PFE vary with hydrogen peroxide concentration. The selectivity constants, determined by fitting data to the formula shown, are β0, which is the perhydrolysis over hydrolysis ratio at low nucleophile concentrations and 1/γ, which is the perhydrolysis over hydrolysis ratio at saturating nucleophile concentrations. Data for L29P and wild-type PFE data are from reference [17].
The saturation behavior for nucleophile selectivity is similar to amine transfer reactions for penicillin acylase. A kinetic model that allows competition between the nucleophile and water at low concentration and possible hydrolysis even when the enzyme is saturated with nucleophile predict the hyperbolic behavior in Figure 3. The data are fit to the equation based on the selectivity constants derived by Youshko et al.[25] The selectivity of L29I PFE at both low (β0) and saturating concentrations (1/γ) of hydrogen peroxide were, within experimental error, the same as those for L29P PFE: L29I PFE: β0 = 160 ± 19 M−1, 1/γ = 10 ± 0.5; L29P PFE: β0 = 170 ± 20 M−1, 1/γ = 11 ± 0.1.
Rate of acetyl enzyme formation measured using H218O exchange
The initial rate of isotope exchange of 18O-water with acetic acid at pH 5.0 was measured as described previously.[17] Isotope exchange involves formation of the acetyl enzyme intermediate, so faster isotope exchange indicates faster acetyl enzyme formation.
L29I PFE catalyzed isotope exchange between 18O-water and acetic acid more than twice as fast as L29P PFE (185 versus 84 U/mg). This increase is similar to the twice as fast perhydrolysis catalyzed by L29I as compared to L29P PFE. Thus, the increased rate of perhydrolysis catalyzed by L29I is due to the increased rate of formation of the acetyl enzyme intermediate. A control without enzyme showed <3% of wild-type PFE (<3.4 U/mg) of spontaneous isotope exchange.
The isotope exchange experiment is further evidence that despite the different amino acid at the 29 position, the kinetic behavior of L29I PFE toward perhydrolysis of acetic acid is similar to that for L29P PFE and differs significantly from wild type. The rate constants of L29I PFE (kcat = 5.1 s−1) and L29P PFE (kcat = 10 s−1) for perhydrolysis of acetic acid are within a factor of two. The selectivity for hydrogen peroxide at low and high concentrations is within the experimental error of the measurements. Compared to wild-type PFE, both L29P PFE and L29I PFE catalyzes the perhydrolysis of acetic acid 43- and 83-times faster, respectively. Both L29P and L29I PFE are twofold less selective for hydrogen peroxide at low nucleophile concentrations compared to wild-type PFE. To understand how both the isoleucine and proline substitutions alter the behavior of wild-type PFE, we solved the x-ray crystal structure of resting L29I PFE and an enzyme-substrate complex of L29I PFE with acetate.
X-ray crystal structure of L29I PFE
Crystals of L29I PFE formed under conditions similar to wild-type PFE and the wild-type structure served as the model to solve the structure by molecular replacement. The unit cell contains six nearly identical polypeptide chains having an α/β fold.[26] Superposition of the L29I and the wild-type structures show little difference: average rmsd of 0.14 Å; chain b of both structures matched most closely with an rmsd of 0.11 Å.
The major difference between L29I and wild-type PFE is in the oxyanion loop, which contains the L29I substitution. This loop occurs after strand β3 in the α/β-hydrolase fold and contains W28, whose main chain N–H donates a hydrogen bond to the oxyanion intermediate during catalysis. (See Figure 2a of reference [17]). In wild-type PFE this loop adopts a type II β-turn conformation, while in L29I PFE this loop is an approximately equal mixture of a type II and a type I β-turn conformation, Figure 4.
Figure 4.

Structure of the oxyanion loop in wild-type PFE and L29I PFE. The ‘i’ notation refers to the β-turn starting with G27 (i) and ending with L30 (i+3). (a) The oxyanion loop in wild-type PFE (PDB code: 1VA4) is a type II β-turn where the carbonyl group of W28 (i+1) points into the plane of the paper, which is toward the active site. (b) The oxyanion loop in L29I PFE contains an approximately equal mixture of type I and II β-turns. In the type I conformation shown, the carbonyl group of W28 (i+1) points out of the plane of the paper, which is to away from the active site. (c) Model of the active site of L29I PFE showing both type I and II β-turns overlaid with 2(Fo-Fc) density map. Two water molecules in the active site form hydrogen bond networks, but likely only for the type I β-turn. For the type II β-turn, the water molecule WAT2 is too close to the carbonyl oxygen, so it is either missing or in a different location.
β-turns reverse the direction of the peptide chain and consist of four amino acid residues where the first and last residues (i and i + 3) form a hydrogen bond between C=O (i) to N–H (i + 3).[27, 28] This hydrogen bond is similar to the one between adjacent antiparallel β-strands; hence the name β-turn. The two central residues in a β-turn (second and third residues called i + 1 and i + 2, respectively) lack hydrogen bonds between the main chain carbonyl and N–H groups. This lack of hydrogen bond is critical for catalysis in ester hydrolysis and acyl transfer since the i + 1 N–H group stabilizes the oxyanion intermediate by donating a hydrogen bond.
The central residues in a β-turn can adopt different conformations. The type I β-turn contains Φi+1 = −60°,ψi+1 = −30°, Φi+2 = −90°, ψi+2 = 0°, while the type II β-turn contains Φi+1 = −60°, ψi+1 = 120°, Φi+2 = 80°, ψi+2 = 0°. Variations of ±30° from these ideal values are still classified with these conformations. In PFE these angles are −66°, 135°, 87°, −21° and thus correspond to a type II β-turn (i + 1 = W28, i + 2 = L29). The structure of L29I shows an approximately equal mixture of both type I and type II conformations. In the type I conformation these angles are −71°, −93°, −89°, 60° and correspond to a type I β-turn (i + 1 = W28, i + 2 = I29), while in the type II conformation of L29I, these angles are −96°, 137°, 54°, 50°. The barrier to interconversion of type I and type II β-turns is small[29], so both conformations are accessible during catalysis.
The type II β-turn orientation of the oxyanion loop does not differ significantly from wild-type and is therefore unlikely to cause the increase in perhydrolysis. Thus, the type I β-turn orientation of the oxyanion loop is hypothesized to allow more efficient perhydrolysis. However, the type I β-turn orientation makes it impossible for the main-chain carbonyl to accept a hydrogen bond with hydrogen peroxide because the carbonyl points away from the active site. The W28 carbonyl groups of wild-type PFE and L29P PFE point into the active site, while the W28 carbonyl group of the type I β-turn conformation in L29I PFE points away from the active site. Thus, the molecular basis for the higher perhydrolysis of L29I PFE must differ from that for L29P PFE and the other known carboxylic acid perhydrolases.
X-ray structure of L29I PFE acetic acid complex
To solve the x-ray structure of L29I PFE with acetic acid, crystals of L29I PFE were briefly immersed in mother liquor with 0.5 M acetate at pH 5.0 and 10 mM H2O2, then mounted on a cryo-loop and frozen in liquid nitrogen. After data collection, the structure was solved by molecular replacement using the wild-type PFE structure as the model. Like the oxyanion loop of L29I PFE, the oxyanion loop of L29I/Ac showed a mixture of type I and II β-turns and two acetate or acetic acid molecules, ACT1 and ACT2, Figure 5. ACT1 is positioned for reaction with the active site serine. The carbonyl carbon is 2.9 Å from the S94-Oγ and the attack angle Oγ–C=O is 150°. Both the distance and angle are those expected for nucleophilic attack at a carbonyl. The C=O of ACT1 is near the oxyanion hole amides of W28 (N–O distance 3.7 Å) and M95 (N–O distance 3.5 Å), but farther than the <3.5 Å expected for a hydrogen bond. Even though the crystallization solution contained hydrogen peroxide, there is no evidence that it bound to the protein or affected the orientation of ACT1 or ACT2. The structure shows hydrogen peroxide only near the surface of the protein.
Figure 5.
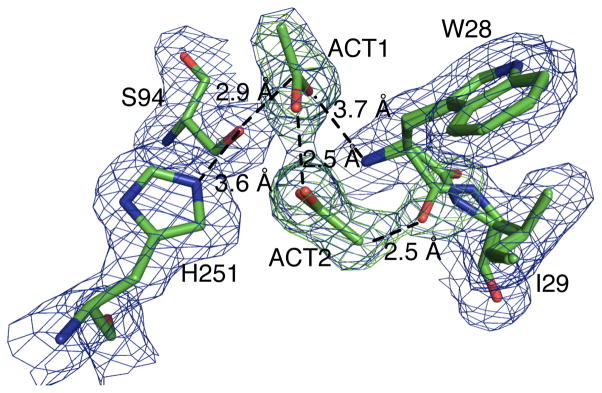
Active site region of the model for L29I/Ac with electron density map showing occupied electron densities (blue) overlaid with unoccupied electron densities (green). ACT1 is an acetic acid oriented for nucleophilic attack by the catalytic serine. The ACT2 molecule lies perpendicular from the viewer’s perspective, thus one of the oxygen is obscured by the other. ACT2 is likely present only in the type I conformation because the methyl group of ACT2 is too close to the carbonyl oxygen (2.5 Å) in the type II β-turn conformation.
ACT1 is most likely in the acetic acid form. The pH of the solution was low (5.0) and a significant portion of the acetate species exist as acetic acid. Additionally, a previous x-ray structure of a similar enzyme (CPO-F) with a bound propionate (crystallized at pH 6.6)[11] shows a different orientation. The propionate carboxylate oxygen accepted a hydrogen bond from the catalytic His-Nε-H; S94-Oγ also accepts a hydrogen bond from this histidine. The absence of such hydrogen bonds with ACT1 suggests ACT1 is in the acetic acid form.
ACT2 lies near the oxyanion loop, which has two conformations. The electron density for ACT2 fits acetate well, but not hydrogen peroxide. The location of ACT2 near the type II β-turn conformation is unrealistically short. The distance between the methyl group of ACT2 and the carbonyl oxygen of W28 in II β-turn is within the van der Waals radii, 2.5 Å. The likely explanation is that the type II β-turn does not contain ACT2 due to this steric clash, but that the type I β-turn contains ACT2 in the location shown in Figure 5. In this location, ACT2 accepts a hydrogen bond (O–O distance 2.5 Å) from ACT1. The high concentration of acetic acid used for crystallization (0.5 M) is typical of the reaction conditions used for perhydrolysis, so during catalysis two acetic acid or acetate molecules are likely in the active site.
The L29I structure complexed with acetate shows a different rotamer of I29 side chain than the L29I resting structure, see Supplemental Information. Although the steric strains are different in the two rotamers, both side-chains of I29 crowd the oxyanion loop to a similar extent.
Molecular modeling of the acetate complex of L29I PFE
To identify a catalytic role for the type I β-turn orientation of the oxyanion loop, we modeled the tetrahedral intermediate for formation of the acetyl enzyme and included an acetate or acetic acid in a location similar to that for ACT2 in the x-ray structure. The geometry of these complexes were optimized using molecular mechanics (OPLS 2005 forcefield[30]).
The model of the type I β-turn of L29I Td1 with ACT2 as acetate, Figure 6, contains all four catalytically important hydrogen bonds: the catalytic histidine donates a hydrogen bond to Td1-OH and S94-Oγ, while the oxyanion accepts hydrogen bonds from the two main chain amides (M95 and W28). Acetate ACT2 accepts three hydrogen bonds: one from Td1-OH and two from main chain amides (I29 and L30). This pair of main chain amides create an oxyanion-hole-like pocket to bind the acetate. The hydrogen bond from Td1-OH may have a catalytic role. It can speed formation of the acetyl enzyme because the hydrogen bond favors loss of water from the Td1 intermediate.
Figure 6.

The geometry optimized model of Td1 in L29I PFE with the type I β-turn of the oxyanion loop and ACT2 as acetate in the active site. The backbone N–H’s of I29 and L30 donate hydrogen bonds to the ACT2 acetate and position it to accept a hydrogen bond from the OH of Td1. This hydrogen bond promotes loss of water from Td1 because it favors protonation of the leaving OH by the catalytic histidine.
The model of the type II β-turn of L29I Td1 with ACT2 as acetate, Figure S4c, also contains all four catalytically important hydrogen bonds, but ACT2 is not held tightly. It accepts a hydrogen bond from Td1-OH, but not main chain amides of I29 and L30. The main chain amide of L29 points away from the acetate, thereby disrupting the oxyanion-hole-like structure that formed in the type I β-turn. For this reason, ACT2 acetate binds poorly to this structure. ACT2 acetate accepts a hydrogen bond from Td1-OH, so it would be able to speed acetyl enzyme formation, but the lack of binding suggests that this conformation does not contribute significantly to catalysis.
The two remaining models of Td1 contain ACT2 as acetic acid and both lack two catalytically important hydrogen bonds and are therefore not deemed catalytically productive. The acetic acid can donate a hydrogen bond to the oxyanion oxygen of the L29I Td1 intermediate in both the type I and II turn conformations, Figures S4b and d. This unusual hydrogen bond disrupts two catalytically important hydrogen bonds: H251-NεH does not donate a hydrogen bond to S94-Oγ and the main chain amide of M95 does not donate a hydrogen bond to the oxyanion. Thus, we suggest ACT2 as acetic acid does not contribute to catalysis.
Discussion
The L29I PFE variant showed 83-fold higher specific activity for acetic acid perhydrolysis than the wild-type and twofold higher than L29P PFE. This is the first example of a good acetic acid perhydrolase despite the absence of the proline residue at the 29 position in the oxyanion loop. The L29P PFE-catalyzed reverse reaction – hydrolysis of peracetic acid – occurs nearly as fast as diffusion, so protein engineering cannot increase it significantly.[16] For this reason, the forward reaction – formation of peracetic acid – also cannot increase significantly. The observed twofold increase over L29P PFE may be nearly as large an increase as is possible. Similar to L29P PFE, the L29I variant was less selective for hydrogen peroxide over water than wild-type PFE (β0 = 160 versus 330 for wild-type). This is a second example of a PFE variant with increased activity for perhydrolysis of acetic acid, but without an increase in the selectivity of hydrogen peroxide over water.
We hypothesize the higher perhydrolysis activities of L29P PFE and L29I PFE stems from a faster formation of the acetyl enzyme intermediate from acetic acid. A previous paper explains how the proline could increase the rate of acetyl enzyme formation.[17] Modeling of L29P Td1 intermediate based on the x-ray crystal structure of the acetic acid complex, shows that the hydroxyl group of Td1 donates a hydrogen bond directly to the W28 carbonyl oxygen, see schematic in Figure 2a. This hydrogen bond promotes protonation of the leaving group water and accelerates acetyl enzyme formation.
In wild-type PFE the W28 carbonyl oxygen is 1.1 Å further away. A water molecule can bridge this gap and accept a hydrogen bond from Td1-OH, Figure 2b, but it costs free energy to hold this water molecule in place. The water molecule can also donate a hydrogen bond to the Td1-OH, which would have the opposite effect and slow acetyl-enzyme formation. Thus, L29P PFE, but not wild-type PFE, accepts a hydrogen bond from Td1 that speeds acetyl enzyme formation.
In L29I PFE type I β-turn conformation, a bound acetate can accept a hydrogen bond from the Td1 hydroxyl, Figure 2c. The type I β-turn conformation creates an oxyanion-like hole where two main chain amides hold an acetate in place by donating two hydrogen bonds. This acetate can accept a hydrogen bond from Td1 that potentially quickens acetyl enzyme formation. A general mechanism that includes both structural motifs is a base that accepts a hydrogen bond from Td1 thereby speeding acetyl enzyme formation, Figure 2d.
It is surprising that changing a leucine to an isoleucine caused such a large change in catalysis and that main chain not side chain, interactions caused this difference. Main chain interactions are harder to identify by sequence comparison, but can nevertheless be critical to catalysis. For example, main chain amides create the oxyanion hole in serine hydrolases.
Fast formation of the acetyl-enzyme model can rationalize why other L29X variants show improved perhydrolysis activity. Variants L29V, L29A, L29G, and L29M may act analogously to L29I. The substitution could switch the oxyanion loop from a type II to I turn that would create more room and allow a second acetate at the active site. The variants L29S, L29E, and L29T may act as proton acceptors in place of a water molecule to stabilize the acetic acid substrate for nucleophilic attack. Thus, the general mechanism rationalizes the improved perhydrolysis activity of some hydrolases toward acetic acid.
Other hydrolases such as (−)-γ-lactamase and dihydrocoumarin hydrolase likely use the same mechanism as L29P PFE for perhydrolysis of acetic acid since both all of these catalysts contain a proline at the oxyanion loop.
Since the perhydrolysis of acids is a promiscuous catalytic activity, not an activity that has been optimized by evolution, it may be possible to engineer other acid perhydrolases. So far, all amino acid substitutions that increase perhydrolysis activity are in the oxyanion loop of an α/β hydrolase scaffold. This location can position a base to accept a hydrogen bond from the Td1 hydroxyl to speed acetyl enzyme formation. Other structural motifs beside the two identified so far may also promote perhydrolysis.
Since the improvement does not involve hydrogen peroxide, these acid perhydrolases may also be useful for other reactions where formation of an acyl enzyme from a carboxylic acid is important. Possible reactions include ester and amide formation from carboxylic acids. The L29P variants are not suitable for these reaction because the proline hinders the nucleophile pocket, but the L29I variants do not suffer this limitation.
Experimental Procedures
General
Water used in all experiments was 18 mega-ohm purity using Milli-Q Water System (Milli-pore, Billerica, MA). Chemicals were from Sigma Aldrich (St. Louis, MO); E. coli DH5a-T1 competent cells were from Invitrogen (Carlsbad, CA). All primers were from Integrated DNA Technologies (Coralville, IA). Enzyme activity was measured in 96-well plates using a diode-array microplate reader. Kinetic constants (Vmax and Km) were determined by measuring the specific activity as a function of substrate concentration. Data was fit to the Michaelis-Menten equation: rate = Vmax * [S]/(Km + [S]) using Origin v. 8.0 software (OriginLab, Northhampton, MA). R2 values were >0.97 for both mutants and wild-type PFE.
Saturation mutagenesis of PFE at the 29 position
Plasmid pL29P[16] contains the L29P PFE gene, a mutant previously made by site-directed mutagenesis of pJOE2792. The plasmid pJOE2792[31] contains the wild-type P. fluorescens SIK WI inserted as an NdeI/BamHI fragment. Expression of the recombinant protein, which contains an N-terminal 6x-His tag, is regulated by a rhamnose-inducible promoter. In this paper, the plasmid containing the L29P PFE plasmid (pL29P) was used as the template for saturation mutagenesis at the 29 position. The large size of pL29P (5.1 Kbp) prevents full amplification during PCR. Therefore, 2 sets of primers were made to amplify two halves of pL29P. A second PCR step was done linking the 2 amplified DNA from the first PCR. Mutagenic primers, Table 2, were designed so that the amplified products from the first PCR would have a 19–20 mer overlap. The first PCR reaction (50 μL) for saturation mutagenesis, using Platinum taq DNA polymerase kit (Invitrogen, Carlsbad, CA), was performed by initially heating the mixture of pL29P (50 ng), dNTPs (0.2 mM), primers (0.2 pmol), MgSO4 (1.5 mM), and 1X buffer to 96 °C for 2 min, followed by 29 cycles of 96 °C for 30 s, 55 °C for 30 s, 72 °C for 3 min and then a final extension step for 10 min at 72 °C.
Table 2.
Sequences of PCR primers for saturation mutagenesis.a
| Name | Sequence | |
|---|---|---|
| set 1 | PFE_L29_saturation_Fb | tgttgttcagccacggttggNNKctggatgccgacatgtggg |
| PFE2700Rc | CCTTATCCGGTAACTATCGTCTTGAGTCCA | |
|
| ||
| set 2 | PFE_L29_R | accgtggctgaacaacaccggtttaccgc |
| PFE2700F | TGGACTCAAGACGATAGTTACCGGATAAGG | |
Two sets of primers are required to amplify the entire pL29P plasmid.
The mutagenesis position is in upper case with bold characters.
Letters in uppercase represent sequences in the primer that are complementary to both sets.
The amplified PCR products were separately treated with DpnI (1 U for 1 h at 37 °C, Invitrogen, Carlsbad, CA), an endonuclease that cleaves template DNA, which is methylated, but not the amplified product DNA. Next, the PCR product was purified to remove enzymes, primers, buffers, and dNTPs using MinElute (Stratagene, Santa Clara). The purified PCR products were mixed together in a 1:1 ratio for a second round of PCR to join the two DNA strands. Reaction conditions were similar to the first round of PCR except the template was product 1 and 2 (200 ng for both). The 5.1 Kb product was purified using MinElute (Stratagene, Santa Clara), then transformed into E. coli BL21-DE3 competent cells by the heat-shock method. Transformed cells were plated on LB (lysogeny broth)-agar containing ampicillin (0.1 mg/mL) and grown for 17 h at 37 °C. Individual colonies were picked and inoculated into sterile 96-well plates containing LB (1.2 mL with 0.1 mg/mL ampicillin) and grown for 17 h at 37 °C with shaking. The overnight culture was inoculated sterile onto LB-agarose containing 0.1 mg/mL ampicillin using sterile 96 pins, grown overnight at 37 °C, then kept at 4 °C for up to 2 weeks. Plasmids were isolated from the 17-h culture using a high-throughput robot (Qiagen, Valencia). The mutations were confirmed by DNA sequencing using sequencing primers in both the forward (64 bps upstream from the start codon, ATG) and reverse (15 bps downstream from the stop codon, TGA) by the Biomedical Genomics Center (University of Minnesota) using ABI BigDye Terminator version 3.1 chemistry.
Protein expression and purification
Typically, 5 mL of lysogeny broth (LB media) containing 0.1 mg/mL ampicillin was inoculated from a single colony, then grown overnight at 37 °C. The overnight grown culture was diluted (1:100) with fresh LB media (100 mL containing 0.1 mg/mL ampicillin) and grown at 37 °C until the absorbance reached 0.6 at 600 nm. Filter-sterilized rhamnose (20% w/v) was added to a concentration of 2% (w/v) to induce protein expression and the culture was incubated for an additional 3 h at 37 °C. The induced culture was centrifuged (4,000 × g, 15 min) and the cell paste was resuspended in buffer A (50 mM NaH2PO4, 300 mM NaCl, 20 mM imidazole) to a concentration of 20% (w/v). The resuspended culture was flash frozen in liquid nitrogen, thawed to room temperature, lysozyme added (final concentration of 1 mg/mL) and incubated on ice for 30 min. The cell lysate was centrifuged (10,000 × g, 60 min) and the supernatant was poured onto a column of Ni-NTA agarose resin (5 mL, Invitrogen) pre-equilibrated with buffer A (25 mL). The column was washed with buffer B (50 mL, 50 mM NaH2PO4, 300 mM NaCl, 40 mM imidazole) and the protein was eluted with buffer C (10 mL, 50 mM NaH2PO4, 300 mM NaCl, 250 mM imidazole). Typical yield was 10–15 mg protein. Protein concentrations were measured by absorbance at 280 nm using the calculated extinction coefficient of PFE (35,410 M−1cm−1).[32]
Assay of L29X variants
Hydrolysis of p-nitrophenyl acetate, perhydrolysis of acetic acid, and perhydrolysis of ethyl acetate were assayed using purified PFE variants. Values are in U/mg protein where 1 U = 1 μmol product formed/min. Initial rates for hydrolysis of p-nitrophenyl acetate at pH 7.2 with 5 mM N,N-bis(2-hydroxyethyl)-2-aminoethanesulfonic acid (BES) and 8% acetonitrile were measured spectrophotometrically by monitoring the increase in absorption of p-nitrophenoxide (ε404 = 16,600M−1cm−1) at 404 nm.[16] Initial rates for perhydrolysis of acetic acid was determined using the monochlorodimeodone assay.[15] The assay solution contains 1.0 M acetic acid/acetate at pH 5.5, 10 mM hydrogen peroxide, 166 mM sodium bromide, and 0.22 mM monochlorodimedone. Peracetic acid reacts with sodium bromide to form hypobromous acid which then reacts with monochlorodimedone to form a colorless product. The disappearance of monochlorodimedone was monitored spectrophotometrically at 290 nm (ε290 = 19,900 M−1cm−1). Initial rates for perhydrolysis of 400 mM ethyl acetate was measured using the monochlorodimedone assay similar to that for acetic acid. In one exception, 50 mM citrate buffer at pH 6.5 substituted for acetate buffer.
Steady-state kinetics for the hydrolysis of ethyl acetate
Initial rates were measured using a pH indicator assay – formation of acetic acid causes a decreases in absorption of p-nitrophenoxide[21] upon protonation to the phenol (ε404 = 16,600M−1cm−1) at pH 7.2 at 23 °C. A typical reaction mixture contained ethyl acetate (0.2–200 mM), p-nitrophenoxide (0.81 mM), BES (5 mM), and enzyme (0.01–5 μg). The BES buffer stabilizes the pH of the solution. The calculation of rated accounts for the protons that were buffered by BES: vtrue = vobsd(1 +(5 mM BES)/(0.81 mM pNP)).
Steady-state kinetic constants for perhydrolysis of acetic acid and ethyl acetate
Kinetic constants for perhydrolysis were determined using the monochlorodimedone (MCD) assay[20], where the amount of enzyme added was adjusted to give a linear dependence of the reaction rate to enzyme concentration. All reactions contained MCD (0.0472 mM) and sodium bromide (149 mM). The concentrations of hydrogen peroxide and acetic acid were varied to give evenly spaced data points above and below Km. When varying the concentration of hydrogen peroxide, the concentration of acetic acid was 2.00 M; when varying the concentration of acetic acid or ethyl acetate, the concentration of hydrogen peroxide was 10 mM. For perhydrolysis of ethyl acetate, 50 mM citrate at pH 5.5 was substituted for acetate.
Steady-state kinetic constants for hydrolysis of peracetic acid
Initial rates were measured using a pHstat to monitor the release of acetate from hydrolysis of peracetic acid at pH 7.2 by titration using 0.01N NaOH. The amount of substrate was varied from 5 to 0.05 mM peracetic acid in a 10 mL solution. A solution of 0.01N NaOH was added to increase the pH to 7.2. The amount of enzyme added was 10 ng to insure that the initial rates for the first few minutes were linear.
Steady-state kinetic constants for perhydrolysis of ethyl acetate
Initial rates for perhydrolysis were determined using the monochlorodimedone (MCD) assay[20], where the amount of enzyme added was adjusted (5 ng/mL to 100 ng/mL) to give a linear dependence of the reaction rate to enzyme concentration. All reactions contained MCD (0.0472 mM) and sodium bromide (149 mM) and 100 mM citrate buffer at pH 6.5. The concentration of ethyl acetate were varied to give a minimum of 3 data points above and below Km, while hydrogen peroxide concentration was kept constant at 14.7 mM. The kinetic constants were found by fitting the initial rates to the Michaelis-Menten equation using nonlinear regression using Origin v. 8.0 software (OriginLab, Northhampton, MA). The single substrate Michaelis-Menten model is valid because the second substrate, hydrogen peroxide is completely saturated.
Perhydrolysis to hydrolysis ratio
The perhydrolysis to hydrolysis ratio of ethyl acetate was determined by measuring the concentration of peracetic and acetic acids using HPLC. To generate peracetic acid, 0.1 mg/mL of L29X enzyme (final concentration) was mixed with 250 mM H2O2, 600 mM ethyl acetate, and 100 mM citrate at pH 6.5. The reaction mixture was allowed to react under 37 °C for 20 minutes with the shaking speed of 700 rpm before being quenched by diluting one part of the reacting mixture in nine parts of 50 mM phosphoric acid. The concentration of peracetic acid was measured as described previously[4], which is a modified Karst assay.[33] The assay involves oxidation of thioanisole with peracetic acid and quantifying the resulting sulfoxide by HPLC. To measure acetic acid, the quenched solution was analyzed by HPLC using ACE 5 C18 column (250 × 4.6 mm) eluted with 0.1% H3PO4 with 20 mM H2SO4 with a flow rate of 0.5 mL/min and detected at 210 nm. The retention times for acetic acid was 10.5 min. A standard curve was measured using the peak area of acetic acid versus concentration, Figure S2.
Nucleophile competition between hydrogen peroxide and water
Initial rates for perhydrolysis and hydrolysis were determined by pH-stat at 23 °C with 0.01N NaOH as the titrant. The amount of hydrogen peroxide was varied from 14.7 to 147 mM while the concentration of methyl acetate was held constant at 1.5 M. The reaction solution was adjusted with 0.01N NaOH before the addition of enzyme to pH 7.2. The amount of protein added was 1.2 μg/mL for wild-type PFE and L29I PFE. For perhydrolysis, the 166 mM of NaBr is added to react with peracetic acid to form BrOH. At pH 7.2, BrOH ionizes to release a proton. This initial rate accounts for both hydrolysis and perhydrolysis. For hydrolysis in the presence of hydrogen peroxide, the amount of acid released corresponds to the amount of titrant added. Additionally, 166 mM of NaCl is added as a substitute for the absence of NaBr. Subtraction of perhydrolysis plus hydrolysis rate from rate of hydrolysis gives the rate for perhydrolysis. The initial rate data was fit using the formula which describes on β0, a parameter used to describe the selectivity of competing nucleophiles.
Isotope exchange of acetic acid with 18O-water
Initial rates for enzyme catalyzed isotope exchange was measured by observing the relative abundance of acetic acid and 18O-acetic acid using gas chromatography/mass spectrometry. In a typical reaction, 45 mol% of 18O-water and 1M acetic acid pH 5.0 are mixed with enzyme (0.08 mg for L29I, 0.16 mg for L29P, 1.0 mg for wild-type PFE) to a final volume of 0.10 mL. At time points of 3, 5, 7, 10, and 13 minutes (for wild-type, the time points are taken from 21 to 60 minutes at 7 minute intervals), 1.0 μL aliquot is withdrawn and flash frozen in liquid nitrogen. Before the sample is analyzed, the 1.0 μL aliquot is diluted with 1.5 mL of 2.5 mM phosphoric acid, mixed and a 1.0 μL aliquot is injected into a gas chromatography (Varian Star 3400 CX) with DB-FFAP column (Agilent, Santa Clara). A quadrupole ion trap mass spectrometer is used to detect the relative abundance of both isotopes by integrating their respective area.
Crystallization, data collection and structure determination of L29I PFE
Initial crystallization conditions were screened using the sitting-drop vapor-diffusion method in a 96-well plate. Hampton Crystallization HT (Hampton, Aliso Viejo) was used as the precipitating reagent. After 1 week of growth at 20 °C, several crystals were observed in a well containing 2 M (NH4)2SO4 and 0.1 M Bis-Tris. Crystallization conditions were further optimized by: varying the pH from 5.0–8.0, varying the concentration of (NH4)2SO4 from 1.5 to 2 M, varying the concentration of Bis-Tris from 0.05 to 0.1 M. Drops were set up between 1.9 M (NH4)2SO4 and 0.05–0.2 M Bis-Tris and varying the concentration of protein solution from 10 to 18 mg/mL. The best crystallization conditions were 1.75 M (NH4)2SO4, 0.1 M Bis-Tris pH 6.6, (3 μl to 7 μl of protein [15 mg/mL]) incubated for 1.5 weeks at 20 °C. For the L29I/acetate complex, crystals were immersed in soak solutions containing mother liquor, 500 mM acetate at pH 5.0, 10 mM H2O2, and 25% glycerol for 30 s. The crystals were transferred two more times in fresh soak solutions for a total soak time of 90 s. Crystals were flash-frozen to 77 K. Data for L29I PFE was collected remotely on the Molecular Biology Consortium Beamline 4.2.2 at the Advanced Light Source (ALS) synchrotron (Berkeley, CA). PyMOL (Schrödinger, New York), d*TREK[34], CCP4[35] and Coot[36] were used for all visualization, integration, data reduction and refinement, Table 3. Wild-type PFE (PDB 1VA4)[37] was used as the model for molecular replacement. Initial refinement using CCP4 showed unresolved densities around the oxyanion loop (carbonyl of W28 and I29-Nα) in the 2(Fobs−Fcalc) electron density map. Our initial model with 100% occupancy of the protein backbone in the type I β-turn showed residual density in the Fo-Fc map around the carbonyl of W28 and not enough density modeled around Nα of I29. Upon flipping the peptide backbone to a type II β-turn and another round of refinement, the 2(Fobs−Fcalc) map showed residual density around the Nα of I29 and a lack of density around the carbonyl of W28. A good fit of electron density to the model was obtained by setting the occupancy of the W28 carbonyl and the I29 αN to 50% in each orientation.
Table 3.
Data-collection and refinement statistics for L29I and L29I/Ac PFE.[a]
| L29I PFE (3T4U) | L29I PFE/Ac (3T52) | |
|---|---|---|
| Data Collection | ||
| Space Group | P32 | P32 |
| Unit-cell parameters | ||
| a = b (Å) | 145.88 | 146.02 |
| c (Å) | 128.59 | 128.95 |
| α = β (°) | 90 | 90 |
| γ(°) | 120 | 120 |
| No. reflections | ||
| Observed | 696418 | 1285074 |
| Unique | 198019 | 207522 |
| Highest Shell | (2.07–2.02 Å) | (2.05–2.00 Å) |
| Rsym (%) | ||
| Overall (highest shell) | 8.9(27.7) | 6.5(27.9) |
| Completeness (%) | ||
| Overall (highest shell) | 98.7(97.7) | 99.9 (99.9) |
| I/σ (I) | ||
| Overall | 5.7 (1.9) | 6.3 (2.3) |
| Refinement | ||
| Resolution range (Å) | 48.3–2.02 | 47.8–2.00 |
| Rwork (highest shell) (%) | 19.4 (22.5) | 18.5 (24.3) |
| Rfree (highest shell) (%) | 22.0 (27.9) | 21.1 (27.9) |
| R.m.s deviations from ideality | ||
| Bond lengths (Å) | 0.016 | 0.015 |
| Bond angles (°) | 1.39 | 1.37 |
| Ramachandran analysis | ||
| Most favored (%) | 98.1 | 98.2 |
| Allowed (%) | 1.9 | 1.8 |
| Disallowed (%) | 0 | 0 |
| Final model | ||
| No. of atoms | ||
| Protein | 12720 | 12719 |
| Solvent | 1273 | 1575 |
| Mean B factor (Å2) | ||
| Main chain | 23.54 | 23.06 |
| Side chain | 24.51 | 26.44 |
| Solvent | 41.01 | 30.85 |
Data for the highest resolution shell are given in parentheses. Rwork = |Σhkl Σi|Ii(hkl) − <I(hkl)>|/Σhkl Σi|Ii (hkl), where I(hkl) is the observed intensity and <I(hkl)> is the average intensity obtained from multiple observations of symmetry-related reflections after rejection. R = Σ||Fo| − |Fc||/Σ|Fo|, where Fo and Fc are the observed and calculated structure factors, respectively. Rfree is calculated using 5.0% of the reflections randomly excluded from refinement.
Molecular Modeling
The enzyme complex with the first tetrahedral intermediate was modeled using molecular mechanics using the program Macromodel v 9.9 (Schrödinger, New York) and the OPLS 2005 forcefield.[30] Starting from the x-ray crystal structures of the acetate complexes, L29I PFE/acetate (PDB 3T52), Protein Preparation Wizard software (Schrödinger, New York) was used to remove water molecules further than 5 Å from the nearest heteroatom, remove glycerol and sulfate, remove five out of the six protein chains in the crystal structure, add hydrogen atoms to all heteroatoms and optimize the geometry of the hydrogen atoms until an rmsd of <0.05 Å was reached. The entire protein structure was geometry optimized using the same forcefield until an rmsd of < 0.3 Å was reached.
The enzyme-Td1 intermediate was built using Maestro (Schrödinger, New York) by attaching the acetic acid within the active site to S94-Oγ. The geometry of the intermediate along with additional acetate or water present in the structure was geometry optimized until an rmsd of <0.05 Å was reached; finally, the entire protein and water molecules were geometry optimized until a rmsd of 0.05 Å was reached.
Supplementary Material
Acknowledgments
We thank the National Science Foundation (CBET-0932762) and the Korea Science and Engineering Foundation funded by the Ministry of Education, Science and Technology (WCU program R32-2008-000-10213-0) for financial support. VMP was supported by NIH Research Grant GM24689 (John Lipscomb). We thank the Minnesota Supercomputing Institute for access to computers and software for computer modeling. We thank Jay Nix for support with ALS data collection. The Advanced Light Source is supported by the Director, Office of Science, Office of Basic Energy Sciences, of the U.S. Department of Energy under Contract No. DE-AC02-05CH11231.
Footnotes
Supplemental Information. Supplemental data (11 pages) contains details on saturation mutagenesis at position 29, calibration curve for measuring acetate concentrations by HPLC, analysis of steric interactions involving Ile29 in the L29I-PFE x-ray crystal structure and molecular modeling of tetrahedral intermediates in L29I-PFE.
References
- 1.Picard M, Gross J, Lubbert E, Tolzer S, Krauss S, van-Pee KH, Berkessel A. Angew Chem, Int Ed Engl. 1997;36:1196–1199. [Google Scholar]
- 2.Swern D. Chem Rev. 1949;45:1–68. [Google Scholar]
- 3.Teixeira LC, Linden JC, Schroeder HA. Appl Biochem Biotechnol. 2000;84:111–127. doi: 10.1385/abab:84-86:1-9:111. [DOI] [PubMed] [Google Scholar]
- 4.Yin DL, Jing Q, AlDajani WW, Duncan S, Tschirner U, Schilling J, Kazlauskas RJ. Bioresour Technol. 2011;102:5183–5192. doi: 10.1016/j.biortech.2011.01.079. [DOI] [PubMed] [Google Scholar]
- 5.Poppius-Levlin K, Jaaskelainen AS, Seisto A, Fuhrmann A. ACS Symp Ser. 2000;742:471–489. [Google Scholar]
- 6.Mehmet K. Environ Int. 2004;30:47–55. [Google Scholar]
- 7.Harakeh MS. FEMS Microbiol Lett. 1984;23:27–30. [Google Scholar]
- 8.Kampf G, Bloss R, Martiny H. J Hosp Infect. 2004;57:139–143. doi: 10.1016/j.jhin.2004.02.004. [DOI] [PubMed] [Google Scholar]
- 9.Malchesky PS. Artif Organs. 1993;17:147–152. doi: 10.1111/j.1525-1594.1993.tb00423.x. [DOI] [PubMed] [Google Scholar]
- 10.Krebsfanger N, Zocher F, Altenbuchner J, Bornscheuer UT. Enzyme Microb Technol. 1998;22:641–646. [Google Scholar]
- 11.Hofmann B, Tolzer S, Pelletier I, Altenbuchner J, van Pee KH, Hecht JJ. J Mol Biol. 1998;279:889–900. doi: 10.1006/jmbi.1998.1802. [DOI] [PubMed] [Google Scholar]
- 12.Line K, Isupov MN, Littlechild JA. J Mol Biol. 2004;338:519–532. doi: 10.1016/j.jmb.2004.03.001. [DOI] [PubMed] [Google Scholar]
- 13.Kataoka M, Honda K, Shimizu S. Eur J Biochem. 2000;267:3–10. doi: 10.1046/j.1432-1327.2000.00889.x. [DOI] [PubMed] [Google Scholar]
- 14.Elmi F, Huang HT, Hsieh YC, Wang YL, Chen YJ, Shaw SY, Chen CJ. J Bacteriol. 2005;187:8470–8476. doi: 10.1128/JB.187.24.8470-8476.2005. [DOI] [PMC free article] [PubMed] [Google Scholar]
- 15.Bernhardt P, Hult K, Kazlauskas RJ. Angew Chem, Int Ed Engl. 2004;44:2742–2746. doi: 10.1002/anie.200463006. [DOI] [PubMed] [Google Scholar]
- 16.Yin DL, Bernhardt P, Morley KL, Jiang Y, Cheeseman JD, Purpero V, Schrag JD, Kazlauskas RJ. Biochemistry. 2010;49:1931–1942. doi: 10.1021/bi9021268. [DOI] [PMC free article] [PubMed] [Google Scholar]
- 17.Yin DL, Kazlauskas RJ. Chem Eur J. 2012;18:8130–8139. doi: 10.1002/chem.201200052. [DOI] [PubMed] [Google Scholar]
- 18.Draper WM, Crosby DG. Arch Environ Contam Toxicol. 1983;12:121–126. [Google Scholar]
- 19.Khersonsky O, Tawfik DS. Annu Rev Biochem. 2010;79:471–505. doi: 10.1146/annurev-biochem-030409-143718. [DOI] [PubMed] [Google Scholar]
- 20.Shaw PD, Hager LP. J Biol Chem. 1959;234:2565–2569. [PubMed] [Google Scholar]
- 21.Janes LE, Lowendahl AC, Kazlauskas RJ. Chem Eur J. 1998;4:2324–2331. [Google Scholar]
- 22.Weng M, Pfeifer O, Krauss S, Lingens F, van Pee KH. J Gen Microbiol. 1991;137:2539–2546. doi: 10.1099/00221287-137-11-2539. [DOI] [PubMed] [Google Scholar]
- 23.Bantleon R, Altenbuchner J, van Pee KH. J Bacteriol. 1994;176:2339–2347. doi: 10.1128/jb.176.8.2339-2347.1994. [DOI] [PMC free article] [PubMed] [Google Scholar]
- 24.Bray WC, Livingston RS. J Am Chem Soc. 1923;45:1251–1271. [Google Scholar]
- 25.Youshko MI, Chilov GG, Shcherbakov TA, Svedas VK. Biochim Biophys Acta, Prot Proteom. 2002;1599:134–140. doi: 10.1016/s1570-9639(02)00413-2. [DOI] [PubMed] [Google Scholar]
- 26.Carr PD, Ollis DL. Prot Pept Lett. 2009;16:1137–1148. doi: 10.2174/092986609789071298. [DOI] [PubMed] [Google Scholar]
- 27.Rose GD, Gierasch LM, Smith JA. Adv Protein Chem. 1985;37:1–109. doi: 10.1016/s0065-3233(08)60063-7. [DOI] [PubMed] [Google Scholar]
- 28.Wilmot CM, Thornton JM. J Mol Biol. 1998;203:221–232. doi: 10.1016/0022-2836(88)90103-9. [DOI] [PubMed] [Google Scholar]
- 29.Gunasekaran K, Gomathi L, Ramakrishnan C, Chandrasekhar J, Balaram P. J Mol Biol. 1998;284:1505–1516. doi: 10.1006/jmbi.1998.2154. [DOI] [PubMed] [Google Scholar]
- 30.Jorgensen WL, Maxwell DS, Tirado-Rives J. J Am Chem Soc. 1996;118:11225–11236. [Google Scholar]
- 31.Choi KD, Jeohn GH, Rhee JS, Yoo OJ. Agric Biol Chem. 1990;54:2039–2045. [PubMed] [Google Scholar]
- 32.Gasteiger E, Hoogland C, Gattiker A, Duvaud S, Wilkins MR, Appel RD, Bairoc A. In: The Proteomics Protocols Handbook. Walker JM, editor. Humana Press; 2005. pp. 571–607. [Google Scholar]
- 33.Pinkernell U, Effkemann S, Karst U. Anal Chem. 1997;69:3623–3627. doi: 10.1021/ac9701750. [DOI] [PubMed] [Google Scholar]
- 34.Pflugrath J. Acta Crystallogr, Sect D: Biol Crystallogr. 1999;55:1718–1725. doi: 10.1107/s090744499900935x. [DOI] [PubMed] [Google Scholar]
- 35.Bailey S. Acta Crystallogr, Sect D: Biol Crystallogr. 1994;50:760–763. doi: 10.1107/S0907444994003112. [DOI] [PubMed] [Google Scholar]
- 36.Emsley P, Cowtan K. Acta Crystallogr, Sect D: Biol Crystallogr. 2004;60:2126–2132. doi: 10.1107/S0907444904019158. [DOI] [PubMed] [Google Scholar]
- 37.Cheeseman JD, Tocilj A, Morley K, Park S, Schrag JD, Kazlauskas RJ. Acta Crystallogr D Biol Crystallogr. 2004;60:1237–1243. doi: 10.1107/S0907444904010522. [DOI] [PubMed] [Google Scholar]
Associated Data
This section collects any data citations, data availability statements, or supplementary materials included in this article.