

Abstract
Interstitial Randall’s plaques and collecting duct plugs are distinct forms of renal calcification thought to provide sites for stone retention within the kidney. Here we assessed kidney stone precursor lesions in a random cohort of stone formers undergoing percutaneous nephrolithotomy. Each accessible papilla was endoscopically mapped following stone removal. The percent papillary surface area covered by plaque and plug were digitally measured using image analysis software. Stone composition was determined by micro-computed tomography and infrared analysis. A representative papillary tip was biopsied. Twenty-four hour urine collections were used to measure supersaturation and crystal growth inhibition. The vast majority (99%) of stone formers had Randall’s plaque on at least 1 papilla, while significant tubular plugging (over 1% of surface area) was present in about one-fifth of patients. Among calcium oxalate stone formers the amount of Randall’s plaque correlated with higher urinary citrate levels. Tubular plugging correlated positively with pH and brushite supersaturation but negatively with citrate excretion. Lower urinary crystal growth inhibition predicted the presence of tubular plugging but not plaque. Thus, tubular plugging may be more common than previously recognized among patients with all types of stones, including some with idiopathic calcium oxalate stones.
Keywords: Calcium oxalate, calcium phosphate, collecting duct, Randall’s plaque, tubular plug
Introduction
Plaque on the papillary surface was first described in 1937 by Alexander Randall, who posited a connection between these non-inflammatory subepithelial calcifications and the formation of kidney stones1. Researchers are still trying to understand their pathogenesis and precise connection to this common disease2 which affects 6–12% of the population3. Endoscopic mapping of kidney surfaces4 and papillary tip biopsies5 support the idea that idiopathic calcium oxalate (CaOx) stones can form upon these calcium phosphate (CaP) deposits that originate in basement membranes of the thin loops of Henle. At some point the plaque is thought to erode through the papillary surface urothelium and become a potential attachment point. Plaque quantity on the papillary surface has been directly linked to kidney stone number6 as well as low urine volume, low urine pH, and high urinary calcium7. However, Randall’s plaques are not thought to be a universal feature of stone formation. Intratubular plugs have been documented in brushite (BR) stone formers where they were associated with interstitial fibrosis, papillary scarring, nephron loss8. Patients who form CaOx stones, but have had a history of bowel resections and enteric hyperoxaluria, distal renal tubular acidosis, or primary hyperparathyroidism, have also been reported to have minimal plaque but prominent plugs2, 5, 9–11.
Previous studies of plaque and plug distribution have focused on uniform groups of highly-selected stone forming patients. In the current study we quantitatively mapped and biopsied 78 consecutive patients that presented for percutaneous stone removal procedures in order to define the prevalence of plaque and plug and their correlation with stone type and severity, medical history, urine composition, and urinary macromolecular crystal growth inhibition. Results indicate that tubular plugging was common, even among CaOx stone formers, and correlated with current stone number and commonly measured urinary risk factors, as well as calcium oxalate crystal growth inhibition. However, the amount of Randall’s plaque did not strongly correlate with urine factors or current stone number, even among those with idiopathic calcium oxalate stones.
Results
Patient Outcomes
Percutaneous nephrolithotomy was performed on 78 patients with an age (mean ± SD) of (57 ± 14). By chance, more women (n = 51) than men (n = 27) presented to our institution during the time period covered by this report. A majority (49/78) of patients were recurrent having had a previous stone event (mean 1.8 ± 1.7; median 1.5) requiring an average of 2.3 ± 5 procedures (median 1.0). Age at diagnosis differed by stone type (p = 0.005). Those with calcium phosphate (CaP) stones were youngest (mean 45 years), followed by the other group (mean 46 yrs). Micro computed tomography (micro CT) combined with directed infrared (IR) analysis was used to obtain a detailed representation and composition mixture based upon volume (Table 1). The CaOx group was further divided into those with malabsorption (CaOxMal, n = 8) and without (CaOx, n = 37). No CaOx patient had evidence of renal tubular acidosis (low serum bicarbonate and concurrent high urine pH, low urine citrate), hyperparathyroidism (hypercalcemia), or primary hyperoxaluria (urine oxalate > 0.7 mmol/day). The other group contained primary hyperoxaluria (n = 3) and primary hyperparathyroidism (n = 2) and dihydroxyadenine, unidentifiable crystal, and matrix stones (n = 1 each). On average 4.5 ± 2.4 calyces (range 1–11) were mapped in each patient depending on anatomy and accessibility, and did not differ by stone category. Compute tomography (CT) images revealed an average of 3.9 ± 6.3 kidney stones per kidney mapped (median 2).
Table 1.
Patient information and urinary values by stone type
| CaOx (N = 37) |
CaOx-MAL (N = 8) |
CaPO4 (N = 12) |
Struvite (N = 9) |
UricAcid (N = 4) |
Other (N = 8) |
p value | |
|---|---|---|---|---|---|---|---|
| Age | 0.0047 | ||||||
| Mean (SD) | 62.5 (9.7) | 61.1 (9.8) | 44.6 (14.2) | 59.2 (16.4) | 53.3 (8.4) | 45.7 (20.2) | |
| Gender | 0.71 | ||||||
| Male | 11 (29.7%) | 2 (25.0%) | 5 (41.7%) | 5 (55.6%) | 1 (25.0%) | 3 (37.5%) | |
| Stones on CT | 0.53 | ||||||
| Median | 1.5 | 2.0 | 4.0 | 1.0 | 1.0 | 3.0 | |
| Plaque, average % | 0.87 | ||||||
| Mean (SD) | 3.6 (4.2) | 3.1 (2.3) | 2.8 (2.6) | 2.1 (2.0) | 1.7 (1.5) | 2.3 (1.5) | |
| Median | 1.8 | 2.5 | 1.9 | 1.7 | 1.1 | 1.7 | |
| Plug, average % | 0.18 | ||||||
| Mean (SD) | 0.3 (0.7) | 1.1 (2.6) | 3.4 (7.7) | 0.5 (1.3) | 0.2 (0.3) | 0.8 (1.1) | |
| Median | 0.0 | 0.1 | 1.1 | 0.0 | 0.1 | 0.4 | |
| Plug, > 1% | 0.013 | ||||||
| Yes | 4 (10.8%) | 2 (25.0%) | 7 (58.3%) | 1 (11.1%) | 0 (0.0%) | 2 (25.0%) | |
|
Current Medications |
|||||||
| Thiazides | 5 | 1 | 0 | 0 | 0 | 2 | |
| Citrate | 1 | 2 | 1 | 1 | 0 | 1 | |
| Allopurinol | 1 | 2 | 0 | 0 | 2 | 3 | |
| Urine Labs: Mean(SD) | |||||||
| Cr mg/24hr | 1207 (439) | 951 (355) | 1174 (340) | 1016 (338) | 1419 (385) | 1130 (421) | 0.45 |
| Na mmol/24hr | 145 (63) | 104 (81) | 137 (53) | 121 (44) | 120 (76) | 167 (124) | 0.88 |
| Phos mg/24hr | 775 (407) | 644 (267) | 899 (248) | 752 (418) | 798 (268) | 846 (381) | 0.44 |
| K mmol/24hr | 58 (21) | 44 (37) | 82 (80) | 58 (24) | 56 (25) | 65 (34) | 0.17 |
| UA mg/24hr | 522 (199) | 352 (155) | 510 (110) | 500 (163) | 504 (229) | 406 (172) | 0.29 |
| Cl mmol/24hr | 133 (58) | 111 (65) | 136 (81) | 110 (37) | 122 (78) | 157 (136) | 0.82 |
| Ca mg/24hr | 210 (101) | 133 (66) | 228 (55) | 212 (66) | 130 (88) | 140 (114) | 0.036 |
| Mg mg/24hr | 95 (38) | 110 (67) | 103 (42) | 106 (32) | 94 (78) | 112 (43) | 0.82 |
| Oxalate mmol/24hr | 0.3 (0.2) | 0.4 (0.3) | 0.3 (0.1) | 0.3 (0.2) | 0.3 (0.2) | 0.6 (0.3) | 0.17 |
| Osm | 466 (155) | 426 (158) | 563 (193) | 465 (216) | 701 (112) | 379 (79) | 0.031 |
| pH | 6.2 (0.5) | 5.9 (0.5) | 6.5 (0.5) | 6.4 (0.6) | 5.3 (0.3) | 6.2 (0.5) | 0.0088 |
| Citrate mg/24hr | 618 (304) | 214 (239) | 459 (220) | 378 (202) | 738 (298) | 292 (400) | 0.0007 |
| Sulfate mmol/24hr | 17 (8) | 11 (4) | 17 (4) | 16 (6) | 21 (7) | 14 (7) | 0.12 |
| Volume mL | 2046 (802) | 1798 (878) | 1797 (738) | 2040 (929) | 1294 (488) | 2393 (914) | 0.33 |
| CaOx SS (DG) | 1.4 (0.8) | 1.6 (0.7) | 1.9 (0.4) | 1.8 (0.3) | 0.9 (1.6) | 1.4 (0.8) | 0.59 |
| Brushite SS (DG) | −0.3 (1.3) | −1.1 (1.2) | 1.0 (0.8) | 0.6 (1.0) | −2.3 (0.8) | −0.9 (1.2) | 0.0002 |
| Apatite SS (DG) | 4.1 (2.2) | 2.8 (2.1) | 6.2 (1.4) | 5.2 (2.0) | 0.2 (1.2) | 3.7 (2.8) | 0.0005 |
| Uric Acid SS (DG) | −1.4 (2.8) | −0.7 (3.2) | −2.7 (3.0) | −2.3 (3.5) | 3.7 (1.0) | −2.8 (3.8) | 0.045 |
| Sodium Urate SS (DG) | 0.6 (1.2) | −0.4 (1.3) | 1.1 (0.9) | 0.6 (1.3) | 1.0 (3.0) | 0.1 (0.8) | 0.12 |
Urine chemistries
Table 1 also lists 24-hr urinary risk factors by stone category. Overall, values were as expected for each stone group. Calcium excretion was greatest in CaOx and CaP stone formers (mean 210 ± 101 and 228 ± 55 mg/24hr, respectively). CaP stone formers also had the highest 24-hr pH (6.5 ± 0.5), while uric acid (UA) stone formers were lowest (5.3 ± 0.3). UA stone formers were also characterized by the lowest urine volume (1294 ± 488 ml/24-hr). CaOx-Mal stone formers had the highest oxalate levels (at 0.43 ± 0.32 mmol/24hr) and the lowest levels of citrate (214 ± 239 mg/24hr). Calculated urinary supersaturations corresponded to stone type (Table 1).
Urinary and patient group correlations with Randall’s plaque
Randall’s plaque appeared as glossy white regions, either exposed or directly under the papillary epithelium, when visualized under the digital nephroscope (Figure 1). On Yasue stained sections plaque appeared as darkly stained nodules extending from the basement membrane and surrounding tubules in the interstitium (Figure 2). Randall’s plaque was noted endoscopically in one or more calyx in 99% of the patients (77 of 78). The majority (53 out of 78; 67.9%) had plaque in each mapped calyx. The average amount of papillary plaque surface coverage was 3.0% (± 3.3%) for all patients and did not vary significantly by stone type (Table 1). CaOx stone formers had the greatest amount of plaque coverage (3.4% ± 4.0%) of the papillary surface) while uric acid stone formers had the least (1.7% ± 1.5%).
Figure 1. Endoscopic mapping.

A papillary still image from a CaOx stone former taken by video is shown pre-processing (Panel A) and post-processing (Panel B) with plaque (green) and plug (yellow) regions outlined and labeled.
Figure 2.

A biopsy from the same patient as in Figure 1 as shown by H&E overview (Panels A, C) and Yasue stain (Panels B, D), Subepithelial interstitial plaque (arrows, Panels A,B) and intratubular plugs (stars, Panels C, D) were both observed.
Rank correlations with all patients in a single group failed to show any significant trends between amount of plaque and urinary analytes (Table 2). CaOx stone formers were also analyzed as a separate group, since Randall’s plaque has been implicated in this group in particular, revealing a significant positive correlation with 24 hour citrate excretion (r = 0.33, p = 0.049). Multiple linear regression analysis using pH, calcium, citrate, oxalate, creatinine and volume to predict plaque (log scale) did not reveal any statistically significant independent predictors among all subjects or the CaOx subset (Table 3A). Current/past use of citrates or thiazides did not correlate with mean plaque percentage, and in a sensitivity analyses current use of thiazides or citrate did not change associations of plaque with urinary parameters in multivariate models. The amount of plaque or plug did not correlate with a history of previous stones or procedures for the group as a whole or for the CaOx stone formers. Furthermore, the current number of stones on CT did not correlate significantly with the overall plaque percentage (r = −0.01, p = 0.95).
Table 2.
Rank correlations of plaque and plug with urinary values for all subjects and for those with CaOx stones
| All | CaOx | |||
|---|---|---|---|---|
| N = 78 | N = 37 | |||
| Plaque | Plug (binary) | Plaque | Plug (binary) | |
| r | r | r | r | |
| Age | 0.07 | −0.01 | −0.11 | 0.33* |
| No. stones | −0.01 | 0.22* | −0.11 | 0.06 |
| Cr mg/24hr | 0.18 | −0.14 | 0.15 | −0.29 |
| Na mmol/24hr | 0.10 | 0.01 | 0.08 | −0.05 |
| Phos mg/24hr | 0.09 | −0.07 | −0.03 | −0.30 |
| K mmol/24hr | 0.14 | −0.02 | 0.14 | −0.29 |
| UA mg/24hr | −0.08 | −0.05 | −0.06 | −0.12 |
| Cl mmol/24hr | 0.12 | 0.00 | 0.07 | −0.09 |
| Ca mg/24hr | 0.13 | 0.03 | 0.19 | −0.14 |
| Mg mg/24hr | −0.05 | −0.12 | 0.17 | −0.26 |
| Oxalate mmol/24hr | −0.19 | −0.14 | −0.15 | −0.15 |
| Osm | 0.00 | 0.08 | −0.01 | 0.02 |
| pH | −0.20 | 0.25* | −0.21 | 0.28 |
| Citrate mg/24hr | 0.10 | −0.25* | 0.33* | −0.20 |
| Sulfate mmol/24hr | −0.00 | 0.01 | 0.01 | −0.16 |
| Volume mL | 0.04 | −0.05 | 0.11 | −0.23 |
| CaOx SS (DG) | −0.17 | 0.03 | −0.10 | 0.06 |
| Brushite SS (DG) | −0.06 | 0.32** | −0.08 | 0.24 |
| Apatite SS (DG) | −0.14 | 0.31** | −0.13 | 0.29 |
| Uric Acid SS (DG) | 0.09 | −0.29** | 0.10 | −0.27 |
| Sodium Urate SS (DG) | −0.07 | 0.10 | −0.15 | 0.15 |
| *.01 < = p < = .05 | ||||
| **p < 01 | ||||
Table 3A.
Multivariable evaluation of selected predictors of plaque and plug
Plaque (log transformation) – multiple linear regression
| All Subjects (n = 78) | CaOx only(n = 37) | |||||
|---|---|---|---|---|---|---|
| Estimate (SE) | P-value | Estimate (SE) | P-value | |||
| pH (per 0.1) | −0.018 (0.024) | 0.45 | −0.0057 (0.0458) | 0.90 | ||
| Calcium mg/24hr (per 10) | 0.0082 (0.0182) | 0.65 | 0.014 (0.0294) | 0.64 | ||
| Citrate mg/24hr (per 100) | −0.0125 (0.0445) | 0.78 | 0.032 (0.089) | 0.73 | ||
| Oxalate mmol/24hr (per 0.1) | −0.061 (0.065) | 0.35 | −0.083 (0.117) | 0.48 | ||
| Cr mg/24hr (per 100) | 0.030 (0.037) | 0.42 | 0.063 (0.067) | 0.35 | ||
| Volume ml (per 100) | 0.0056 (0.0200) | 0.78 | −0.023 (0.035) | 0.51 | ||
Urine chemistry and patient group correlations with Collecting Duct Plugs
Tubular plugging was also detected on the papillary surface of a large number of patients (33 out of 78; 42.3%). Plugs appeared as yellowish protrusions from the papillary surface on mapping (Figure 1) and as intratubular deposits on histological sections (Figure 2). Significant tubular plugging (> 1% of the surface area by mapping) was detected in 16 (20.1%) patients. The number of stones found in the kidneys of those with significant plugs was significantly higher as well (median 4.0 vs. 2.0, p = 0.05). The amount of plugging correlated positively with urinary pH and BR SS and negatively with citrate excretion and uric acid SS (p < 0.05, Figure 3). Plugging was also associated with CaP stone formation (Table 1). When the CaP stone formers were subdivided into BR and apatite groups, the BR group had plugging in 5 out of 7 cases, compared to 2 of 5 apatite cases; Figure 4).
Figure 3. Urinary predictors of significant tubular plugging (> 1%).

Urinary pH (Panel A), Citrate (Panel B), and Brushite SS (Panel C) were all significantly correlated with the incidence of papillary plugging among all stone formers. (p < 0.05).
Figure 4. CaPstone formers have the highest incidence of severe tubular plugging (> 1% surface area) compared to CaOx formers and CaOx stone formers with maladsorption.

Within the CaP group, the brushite stone formers had a greater percentage with plugs than those with apatite stones. Black = plugs > 1%, Grey = 0 < plugs < 1%, White = no plugs.
Increased urinary pH and decreased 24 hour citrate excretion correlated with significant plugging (Table 2, p < 0.05). In a multiple logistic regression model using pH, calcium, citrate, oxalate, creatinine, and volume, significant plugging was independently associated with increased urinary pH and lower 24-hr citrate excretion (Table 3B, p < 0.01). Current/past use of citrates or thiazides did not correlate with the presence of significant tubular plugs. Current/past use of citrates or thiazides did not correlate with the presence of significant tubular plugs, nor did adjustment for their use change associations of plug with urinary parameters in multivariate models.
Table 3B.
Plug (< 0.01 vs > = 0.01), n = 78, 16 events-- Logistic regression
| Odds Ratio (95% CI) | P-value | ||
|---|---|---|---|
| pH (per 0.1) | 1.27 (1.07, 1.52) | 0.0076* | |
| Calcium mg/24hr (per 10) | 1.03 (0.94, 1.13) | 0.50 | |
| Citrate mg/24hr (per 100) | 0.63 (0.45, 0.88) | 0.0067* | |
| Oxalate mmol/24hr (per 0.1) | 0.62 (0.34, 1.10) | 0.10 | |
| Cr mg/24hr (per 100) | 1.01 (0.83, 1.22) | 0.96 | |
| Volume ml (per 100) | 0.96 (0.86, 1.07) | 0.43 |
Crystal Growth Inhibition
The assay for CaOx growth inhibition measures the net effect of all urinary macromolecules at their ambient relative concentration on growth of CaOx crystals in a supersaturated solution. Randall’s plaque coverage did not correlate significantly with CaOx crystal growth inhibition activity. However, stone formers with significant plugs had a much lower CaOx crystal growth inhibition than those without significant plugs (0.27 vs 0.37, p = 0.004; Figure 5). Among the CaOx stone formers, there was an even larger difference between those with significant plugging and those without (0.24 vs 0.38, p = 0.01).
Figure 5. Inhibition activity (Ia) of urine relative to the presence of tubular plugs.

Patients with significant plugs (> 1% of the surface area) had reduced crystal growth inhibition activity both among the cohort as a whole (Panel A; p < 0.01) or the CaOx group (Panel B; p < 0.01).
Correlations between endoscopic and histological mapping
Representative areas of Yasue positive Randall’s plaque or plug are represented in Figure 2. The average amount of plaque cross sectional area, quantified on the biopsies using image analysis, was 4.8% (± 10.0%), compared with 3.0% (± 3.3%) of the papillary surface area by digital nephroscope mapping. Significant plugging was detected on 20 out of 65 of the biopsies (30.8%), compared with only 20.5% of the endoscopically mapped kidneys. Overall, the amount of plaque and plug for each patient detected by biopsy and mapping correlated (p < 0.001, Figure 6). Thus results of endoscopic mapping represent underlying histology.
Figure 6. Correlation of endoscopic mapping and histologic staining.
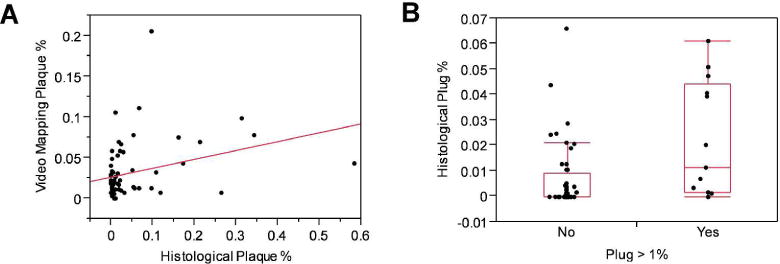
Plaque (Panel A) and plug (Panel B) amounts quantitated by endoscopic video mapping using a digital nephroscope correlated significantly with histologic measurements made on a representative papillary tip biopsy (p < 0.05).
Discussion
In the current study 78 consecutive patients that consented to endoscopic mapping were placed into one of 6 currently accepted clinical groupings. Both Randall’s plaque and tubular plugs were common, being found in 98.7% and 42.3% of all patients, respectively. Tubular plugging was more common than previously appreciated, and predictably correlated with urinary measures. Clinical predictors of Randall’s plaque were more subtle. These results suggest accurate phenotyping of stone precursor lesions may be necessary if we are to advance knowledge regarding important pathogenic factors in stone formation.
Multiple papers have associated Randall’s plaque with idiopathic CaOx stone formation5–7, 12–14. Likewise, we commonly observed plaque in our CaOx population. However, the plaque surface area coverage was somewhat lower (3.6% ± 4.2%) than that observed in a previous report (7.4% in CaOx patients versus 0.5% in a control group)7. Further, the percent plaque coverage was not dramatically different among stone types in our study, with many CaOx stone formers exhibiting minimal plaque.
Interestingly, 32% of the CaOx patients had some tubular plugging, which was severe in 10.8% and correlated with poor CaOx crystal growth inhibition. All of our CaOx-MAL patients also had plaque, with a median percentage that was greater than the CaOx group (2.5 vs 1.8%). Half of them also had plugging which was significant (> 1%) in 25%. Therefore, the path to stone appears mixed in our sampling of these two clinically-defined groups of CaOx stone formers.
CaP stone formers had a similar amount of Randall’s plaque as the CaOx group (median 1.9% vs 1.8%). However, they also exhibited severe plugging, with 58% having > 1%. Interestingly, 5 out of 7 patients with severe plugging were BR stone formers, as opposed to 2 out of 5 in the apatite subgroup. The association of plugging with BR stones confirms previous findings.8 The factors that associated with plug were those that favor higher CaP precipitation, namely higher pH, lower citrate and increased CaP SS. Interestingly, urinary crystal growth inhibition also correlated with plug, which also makes intuitive sense. Our assay evaluated total urinary macromolecules that might include contributions from any molecule larger than 5 kDa including osteopontin15, inter-α-trypsin inhibitor16, Tamm-Horsfall protein17, and glycosaminoglycans18. These results suggest that study of urinary macromolecular inhibitors remains valid as a cause of stone disease, and that a focus on these factors in patients with significant plugging might be more justified.
As expected UA stone formers had generally acidic and concentrated urine19. Plaque has previously been observed in UA stone formers and was also seen in our population.14 However, we also detected plugging by videomapping in 50% of our UA stone formers, which has not been previously described.20 Although higher urinary pH correlated with severe plugging in other stone groups within our cohort, this was not true for UA stone formers. Therefore, the nature and pathogenesis of plaques and plugs among UA patients remains to be defined.
Limitations include availability of a single urine collection for most patients, and that a control group without stone disease was not evaluated, since such individuals rarely have percutaneous kidney surgery. However, patients with struvite stones are an interesting comparator group since their stone disease is thought to be secondary to urinary infection. Interestingly, we found endoscopic evidence of plaque on all 9 of the struvite stone formers enrolled in this study ranging from 0.7% to 7.0%, with a median of 1.7%. This is similar to the CaOx and CaP groups. Previous reports by Low and Stoller14 reported only 20% (2 of 10) of struvite patients to have plaque on the papilla. In addition, 33.3% (3 of 9) of the struvite formers in our study had plugs, perhaps consistent with their alkaline pH, although only one of them had severe plugging > 1%. The common presence of precursor lesions in the struvite group supports the previous observation that many of these patients may have underlying metabolic risks for stones21.
Results of this study are in general consistent with those of Evan and colleagues5, 9, 11. We found the most plaque in the CaOx group, least plaque in the UA group, and most plugs in the BR group. However, the amount of plaque in the CaOx group was lower in the current study than previously reported7. This may be related to differences in the patient populations studied. Our idiopathic CaOx group represented a non-preselected population that presented for stone surgery and were of a relatively older age (mean 62.5 yrs) and a higher proportion female (70%) than previous CaOx cohorts5. In addition the urinary calcium excretion of the current CaOx group was lower (mean 210 mg). Indeed, the previous idiopathic CaOx group included only those with hypercalciuria5, which may represent a distinct subset of CaOx stone formers. Nevertheless, it is important to keep these differences in mind, and the current results may not be generalizable to all patients with idiopathic CaOx stone disease.
Another apparent difference from previous studies is a lack of a clear-cut correlation of plaque with urinary factors (pH, calcium, volume). However, correlations in the only published series were heavily influenced by a larger number of hypercalciurics with heavy plaques and a smaller number of normocalciuric controls with minimal plaque7. Our study suggests there may be other groups of CaOx patients without marked hypercalciuria and who form stones via pathways other than Randall’s plaque. For example a small number (n = 4 or approximately 10%) of the CaOx group demonstrated higher amounts (> 1%) of tubular plugging. There were no statistically significant features that differentiated these patients, although numbers were small for comparison. However, it is possible that the role of plaque in CaOx stone pathogenesis may differ between apparently clinically similar individuals, and plaque may be most important in the severely hypercalciuric stone former. The current study certainly suggests that all patients with clinically-defined “idiopathic CaOx stone disease” are not alike, and in particular not all appear to have underlying Randall’s plaque as a part of their stone diathesis. Others have likewise suggested the pathway to stone may include multiple subgroups of patients involving different mixtures of plaque and plug2.
In conclusion, tubular plugging may be more common than previously recognized among patients with all types of stones, correlates with urinary factors, and is associated with stone severity. Plaque is also common among all stone types but it did not clearly correlate with urinary factors. Common clinical classification schemes do not accurately characterize CaOx patients with respect to underlying pathologic patterns. Since findings on histologic examination of papillary tip biopsy correlated with those on endoscopic mapping, mapping alone is a valid method to document patterns of microcalcification that has the potential to improve characterization of stone patients for clinical studies.
Methods
The Mayo Institutional Review Board approved this study. Non-pregnant patients over the age of 18 years undergoing elective percutaneous nephrolithotomy for symptomatic upper tract urolithiasis were informed of our study. All eligible patients seen at our tertiary center were offered enrollment, and this report describes the first 78 that provided informed consent. The patients completed a structured questionnaire and all medical records were reviewed to obtain kidney stone formation risk factors. CT images were available prior to the procedure to assess current stone burden. Twenty-four hour urine studies were obtained with patients on a random diet.
Percutaneous access was placed in either an upper or lower pole posterior renal calyx to maximize stone removal. One fragment of the removed stone was sent for culture, and the remainder for detailed structural and compositional analysis by micro CT and directed IR22. After all stone material was removed the internal papillary structures of the kidney were systematically evaluated and videotaped using a flexible digital nephroscope. The location of each papilla was determined using fluoroscopy with instillation of contrast through the nephroscope. Once the entire kidney was mapped, a papillary tip biopsy was taken endoscopically from a calyx containing plaque and/or plug when one or both was present in that patient. This was typically not the calyx containing the symptomatic stone under treatment and the calyx was selected based on the ability to provide the best biopsy specimen within the confines of the surgical access and instruments. A plug was defined as a crystalline structure extruding from a duct of Bellini which can be physically removed and a plaque was defined as discolored and slightly raised urothelium consistent with subepithelial crystal deposition7, 23.
Image Analysis
Representative still images of each papilla were captured from the video footage. A single urologist who performed the surgery (AEK) assisted by an image processing technician (MK) reviewed all videos and images to determine the location and distribution of the papillae, plaque, and plugs. Using video editing software the area of the papillae, individual plaques (green), and plugs (yellow) were outlined as shown in Figure 1 to calculate the percent surface area of plaque and plug.
Histology
Papillary tip biopsies were fixed in 10% formalin overnight, dehydrated through graded ethanol, passed into xylenes, and paraffin embedded. Serial sections were cut at 5 μm and placed on charged slides. One slide was prepared using Hematoxylin and Eosin staining and one was stained for calcifications using the method of Yasue.24 Yasue-stained slides were imaged at 10 X magnification and quantitatively analyzed using Adobe Photoshop®. Randall’s plaques were defined by their diffuse nature in and around the basement membrane of tubules and collecting ducts, while plugs were identified within the tubular space where they were often surrounded by intact epithelium (Figure 2). The Yasue positive tissue was defined as either histological plaque or plug and was divided by the total tissue area of the section in order to obtain percentages.
Urine Chemistries
Twenty-four hour urine collections obtained within 6 months of the percutaneous nephrolithotomy date were analyzed. All were obtained before surgery, or a minimum of 8 weeks afterwards. A minority of patients were on medications at the time of urine studies including thiazides (n = 8), citrate (n = 6), or allopurinol (n = 8), which were corrected for during data analysis. All urine measurements were performed in the Mayo Clinic Renal Testing Laboratory (Rochester, MN, USA). EQUIL2 was utilized to calculate urinary supersaturations.25 Data from inappropriate collections (> 20% discrepancy of measured versus expected creatinine excretion) was not utilized.
CaOx Crystal Growth Inhibition Assay
To prepare a total urinary macromolecule isolate, an aliquot from the 24 hour urine collection was spun at 3,600 rpm, 4 ºC, for 10 minutes. The supernatant was concentrated with a Vivaspin 6 concentrator (5,000 MW cut off, Sartorius, Goettingen, Germany), then rinsed 3 times with PBS (6 ml) containing Roche Complete® protease inhibitor (1 tablet per 1000 ml) in the same Vivaspin concentrator. The protein concentration in 200 μl of the resulting filtrate was measured using a bicinchoninic acid assay kit (Pierce, Rockford, IL), after which PBS was added to achieve a final concentration of 1 mg/ml.
CaOx monohydrate (COM) crystal growth inhibition was measured using the seeded crystal growth assay of Nakagawa and colleagues.26 This assay quantitates the ability of total urinary macromolecules to inhibit deposition of soluble [14C]oxalate upon a COM crystal slurry, with results expressed as a percentage of a blank sample (no macromolecules added)
Kidney Stone Classification
Patients were classified as CaOx stone formers if their stones contained > 50% COM, CaOx dihydrate (COD), or a combination of the two. Those with a clinical history consistent with malabsorption (previous intestinal resection, bariatric surgery for weight loss, chronic pancreatitis, or inflammatory bowel disease) were placed in the in the CaOx malabsorption group (CaOxMal). The CaP group contained both BR (> 50%) and apatite (> 50%) stone formers. Patients with any struvite were classified as such (minimum 36% in this cohort). UA stone formers had > 50% UA in their stone. The remainder, including those with primary hyperoxaluria or primary hyperparathyroidism, were classified as “other”. Stone events (passage or surgical removal) prior to the current PCNL were quantified as 0, 1, 2, 3, or 4+, since patients with 4 or more stones often could not provide an accurate number of events, and those with 1 or more previous events were classified as recurrent.
Statistical Analysis
Bivariate associations of plaque (continuous) and plug (binary) with the other risk factors were initially evaluated using rank correlations and the rank sum test. Stone group associations were also tested using chi-square and non-parametric ANOVA tests. Linear regression (plaque, log transformation) and Logistic regression (plug, binary) analyses were used to identify possible risk factors. In sensitivity analyses, models were constructed that accounted for medication use. All reported p-values were two-sided, with p < 0.05 was considered statistically significant. Statistical analyses were performed using SAS software, version 9.1 (SAS Institute, www.sas.com) and version 9 JMP.
Acknowledgments
The authors thank David Holmes of the Mayo Biomedical Imaging Resource Core for assistance with processing and analysis of the mapping videotapes.
Footnotes
Disclosure Statement
This work was supported by the Mayo Clinic O’Brien Urology Research Center P50 DK083007 from the National Institute of Diabetes and Digestive and Kidney Diseases and Grant Number UL1 TR000135 from the National Center for Advancing Translational Sciences (NCATS). Its contents are solely the responsibility of the authors and do not necessarily represent the official views of the NIH.
References
- 1.Randall A. The origin and growth of renal calculi. Annals of Surgery. 1937;105:1009–1020. doi: 10.1097/00000658-193706000-00014. [DOI] [PMC free article] [PubMed] [Google Scholar]
- 2.Coe FL, Evan AP, Lingeman JE, et al. Plaque and deposits in nine human stone diseases. Urological research. 2010;38:239–247. doi: 10.1007/s00240-010-0296-z. [DOI] [PMC free article] [PubMed] [Google Scholar]
- 3.Lieske JC, Pena de la Vega LS, Slezak JM, et al. Renal stone epidemiology in Rochester, Minnesota: An update. Kidney Int. 2006;69:760–764. doi: 10.1038/sj.ki.5000150. [DOI] [PubMed] [Google Scholar]
- 4.Miller NL, Gillen DL, Williams JC, Jr, et al. A formal test of the hypothesis that idiopathic calcium oxalate stones grow on Randall’s plaque. BJU international. 2009;103:966–971. doi: 10.1111/j.1464-410X.2008.08193.x. [DOI] [PMC free article] [PubMed] [Google Scholar]
- 5.Evan AP, Lingeman JE, Coe FL, et al. Randall’s plaque of patients with nephrolithiasis begins in basement membranes of thin loops of Henle. J Clin Invest. 2003;111:602–605. doi: 10.1172/JCI17038. [DOI] [PMC free article] [PubMed] [Google Scholar]
- 6.Kim SC, Coe FL, Tinmouth WW, et al. Stone formation is proportional to papillary surface coverage by Randall’s plaque. J Urol. 2005;173:117–119. doi: 10.1097/01.ju.0000147270.68481.ce. discussion 119. [DOI] [PubMed] [Google Scholar]
- 7.Kuo RL, Lingeman JE, Evan AP, et al. Urine calcium and volume predict coverage of renal papilla by Randall’s plaque. Kidney Int. 2003;64:2150–2154. doi: 10.1046/j.1523-1755.2003.00316.x. [DOI] [PubMed] [Google Scholar]
- 8.Evan AP, Lingeman JE, Coe FL, et al. Crystal-associated nephropathy in patients with brushite nephrolithiasis. Kidney Int. 2005;67:576–591. doi: 10.1111/j.1523-1755.2005.67114.x. [DOI] [PubMed] [Google Scholar]
- 9.Evan AP, Lingeman JE, Worcester EM, et al. Renal histopathology and crystal deposits in patients with small bowel resection and calcium oxalate stone disease. Kidney international. 2010;78:310–317. doi: 10.1038/ki.2010.131. [DOI] [PMC free article] [PubMed] [Google Scholar]
- 10.Coe FL, Evan AP, Worcester EM, et al. Three pathways for human kidney stone formation. Urological research. 2010;38:147–160. doi: 10.1007/s00240-010-0271-8. [DOI] [PMC free article] [PubMed] [Google Scholar]
- 11.Evan AP, Lingeman J, Coe F, et al. Renal histopathology of stone-forming patients with distal renal tubular acidosis. Kidney international. 2007;71:795–801. doi: 10.1038/sj.ki.5002113. [DOI] [PubMed] [Google Scholar]
- 12.Evan AP, Coe FL, Rittling SR, et al. Apatite plaque particles in inner medulla of kidneys of calcium oxalate stone formers: osteopontin localization. Kidney international. 2005;68:145–154. doi: 10.1111/j.1523-1755.2005.00388.x. [DOI] [PubMed] [Google Scholar]
- 13.Evan A, Lingeman J, Coe FL, et al. Randall’s plaque: pathogenesis and role in calcium oxalate nephrolithiasis. Kidney Int. 2006;69:1313–1318. doi: 10.1038/sj.ki.5000238. [DOI] [PubMed] [Google Scholar]
- 14.Low RK, Stoller ML. Endoscopic mapping of renal papillae for Randall’s plaques in patients with urinary stone disease. J Urol. 1997;158:2062–2064. doi: 10.1016/s0022-5347(01)68153-9. [DOI] [PubMed] [Google Scholar]
- 15.Asplin JR, Arsenault D, Parks JH, et al. Contribution of human uropontin to inhibition of calcium oxalate crystallization. Kidney Int. 1998;53:194–199. doi: 10.1046/j.1523-1755.1998.00739.x. [DOI] [PubMed] [Google Scholar]
- 16.Atmani F, Glenton PA, Khan SR. Role of inter-α-inhibitor and its related proteins in experimentally induced calcium oxalate urolithiasis. Localization of proteins and expression of bikunin gene in the rat kidney. Urol Res. 1999;27:63–67. doi: 10.1007/s002400050090. [DOI] [PubMed] [Google Scholar]
- 17.Hess B, Nakagawa Y, Parks JH, et al. Molecular abnormality of Tamm-Horsfall glycoprotein in calcium oxalate nephrolithiasis. Am J Physiol. 1991;260:F569–F578. doi: 10.1152/ajprenal.1991.260.4.F569. [DOI] [PubMed] [Google Scholar]
- 18.Lieske JC, Leonard R, Toback FG. Adhesion of calcium oxalate monohydrate crystals to renal epithelial cells is inhibited by specific anions. Am J Physiol. 1995;268:F604–F612. doi: 10.1152/ajprenal.1995.268.4.F604. [DOI] [PubMed] [Google Scholar]
- 19.Sakhaee K. Recent advances in the pathophysiology of nephrolithiasis. Kidney international. 2009;75:585–595. doi: 10.1038/ki.2008.626. [DOI] [PMC free article] [PubMed] [Google Scholar]
- 20.Evan AP, Lingeman JE, Coe FL, et al. Intra-tubular deposits, urine and stone composition are divergent in patients with ileostomy. Kidney international. 2009;76:1081–1088. doi: 10.1038/ki.2009.321. [DOI] [PMC free article] [PubMed] [Google Scholar]
- 21.Resnick MI. Evaluation and management of infection stones. The Urologic clinics of North America. 1981;8:265–276. [PubMed] [Google Scholar]
- 22.Williams JC, Jr, McAteer JA, Evan AP, et al. Micro-computed tomography for analysis of urinary calculi. Urological research. 2010;38:477–484. doi: 10.1007/s00240-010-0326-x. [DOI] [PubMed] [Google Scholar]
- 23.Kuo RL, Lingeman JE, Evan AP, et al. Endoscopic renal papillary biopsies: a tissue retrieval technique for histological studies in patients with nephrolithiasis. J Urol. 2003;170:2186–2189. doi: 10.1097/01.ju.0000096065.61481.35. [DOI] [PubMed] [Google Scholar]
- 24.Yasue T. Histochemical identificaiton of calcium oxalate. Acta histochemica et cytochemica. 1969;2:83–95. [Google Scholar]
- 25.Werness PG, Brown CM, Smith LH, et al. EQUIL2: a BASIC computer program for the calculation of urinary saturation. J Urol. 1985;134:1242–1244. doi: 10.1016/s0022-5347(17)47703-2. [DOI] [PubMed] [Google Scholar]
- 26.Nakagawa Y, Abram V, Parks JH, et al. Urine glycoprotein crystal growth inhibitors. Evidence for a molecular abnormality in calcium oxalate nephrolithiasis. J Clin Invest. 1985;76:1455–1462. doi: 10.1172/JCI112124. [DOI] [PMC free article] [PubMed] [Google Scholar]