Abstract
Purpose
Contrast agents for Chemical Exchange Saturation Transfer (CEST) MRI often require an accurate measurement of the chemical exchange rate. Many analysis methods have been reported that measure chemical exchange rates. Additional analysis methods were derived as part of this study. This report investigated the accuracy and precision of each analysis method.
Methods
CEST spectra were simulated using the Bloch-McConnell equations modified for chemical exchange. CEST spectra of iopromide were obtained with a range of saturation times, saturation powers, and concentrations. These simulated and experimental results were used to estimate the chemical exchange rate using the QUESP, QUEST, Omega Plot (LB-QUESP), EH-QUESP, HW-QUESP, LB-Conc, EH-Conc, and HW-Conc methods.
Results
Bloch fitting produced the most precise estimates of chemical exchange rates, although substantial expertise and computation time were required to achieve these results. Of the more simplistic analysis methods, the HW-QUESP method produced the most accurate and precise estimates of fast exchange rates. The QUEST and LB-QUESP methods produced the most accurate estimates of slow exchange rates, especially with samples that have short T1w relaxation times.
Conclusions
HW-QUESP is a simplistic analysis method that should be used when fast chemical exchange rates need to be estimated from CEST MRI results.
Keywords: CEST, MRI, chemical exchange rates, Bloch, QUEST, QUESP, omega plot
Introduction
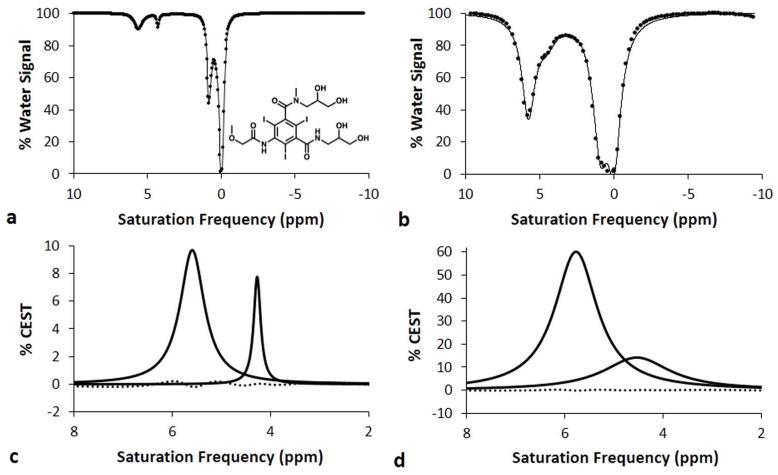
Exogenous Chemical Exchange Saturation Transfer (CEST) MRI contrast agents have been developed that measure or detect a variety of molecular biomarkers (1). A typical CEST MRI study employs selective radio frequency saturation at the chemical shift of a labile proton of the agent (relative to the chemical shift of water that is defined to be 0 ppm), which eliminates the coherent MR signal from the proton. Subsequent chemical exchange of the proton from the agent to a water molecule transfers the saturation to the water resonance and decreases the net water signal. Most studies of CEST agents typically acquire CEST spectra, which records the relative water signal after selective saturation over a range of MR frequencies (Fig. 1) (2).
Figure 1.
Representative Lorentzian line shapes fitted to simulated CEST spectra of iopromide at a) 1 μT saturation power and b) 5 μT saturation power, with a 1 second saturation time, 1000 Hz chemical exchange rate, 200 mM concentration, and 3 second T1w relaxation time. The chemical structure of iopromide is shown in the inset. The CEST effect at 5.6 ppm arises from the amide proton between the ring and carbonyl group, while the CEST effect at 4.2 ppm arises from the amide proton between the diol group and the carbonyl group. The CEST effect at 0.8 ppm arises from the diol groups, and the direct saturation of water is shown as a line shape at 0 ppm. Lorentzian line shape spectra generated from the fitting process show the CEST effects from the amides at c) 1 μT saturation power and d) 5 μT saturation power. The residuals of the fitting processes are shown as a dotted line.
The development and characterization of exogenous CEST agents can require an accurate determination of the chemical exchange rate. For example, accurate measurements of chemical exchange rates can be used to quantify molecular biomarkers such as pH (2,3). Chemical exchange rates can also facilitate the measurement of CEST agent concentration, which can be useful for evaluating other biomarkers (4). Measurements of chemical exchange rates can be used to select the best saturation power and the best CEST MRI acquisition method for detecting the CEST agent (5-7).
To meet this need, many analysis methods have been developed that can determine chemical exchange rates from CEST MRI results. The Bloch-McConnell equations that are modified to include chemical exchange can be fit to a CEST spectrum to determine the exchange rate (a.k.a., the Bloch fitting method) (8). The QUEST and QUESP methods measure the CEST effect as a function of saturation time or saturation power, respectively, which can then be fit by nonlinear functions that determine the exchange rate (9). The Omega Plot method is a linear version of the QUESP method that can determine the exchange rate using a facile linear fitting method (10). CEST is also dependent on concentration, and a nonlinear function and linear variations of these functions can be used to determine exchange rates (11). Most of these methods make assumptions to simplify the analysis. Each method has different dependencies on experimental parameters and different weightings of the experimental results.
As presented in this report, we have developed three new analysis methods for determining chemical exchange rates. We have developed QUESPT that measures the CEST effect as a function of saturation time and saturation power, and analyzes this combination of all CEST measurements to estimate the chemical exchange rate. We have also developed two new linear analysis methods that are similar to the Omega Plot method. As with the other established analysis methods, these new methods make assumptions to simplify the analysis, and have different dependencies on experimental parameters and weightings of experimental results.
The effect of exchange rate on saturation transfer is often underappreciated when using CEST MRI methods (3,9,12,13). Slowly exchanging protons on the CEST agent experience the full effect of the saturation applied at the unique chemical shift of the proton on the agent. However, rapidly exchanging protons spend a fraction of time on the agent compared to slowly exchanging protons, and therefore experience a fraction of the effect of the saturation applied at the chemical shift of the agent. This incomplete saturation can become significant for protons that exchange as slow as 20% of the chemical shift of the agent’s exchangeable proton (9). CEST MRI methods that rely on complete saturation (e.g., QUEST) or an accurate determination of the level of saturation (e.g., QUESP, Omega Plot) may inaccurately measure fast chemical exchange rates. This effect is an important consideration for diamagnetic CEST agents that typically have MR chemical shifts less than 6 ppm (14). Paramagnetic CEST agents can have greater chemical shifts, so that chemical groups with faster exchange rates can generate CEST (15). Yet incomplete saturation may still be an important consideration for paramagnetic CEST agents that have small chemical shifts or very rapid exchange rates.
We sought to evaluate the accuracy and precision of methods that analyze CEST MRI results to measure chemical exchange rates. We simulated CEST spectra using the Bloch-McConnell equations modified for chemical exchange, and then evaluated the accuracy of estimating chemical exchange rates with each analysis method. We then experimentally measured the CEST spectra of iopromide (Ultravist™, Bayer Health Care, Inc.) that has amide protons with slow and fast exchange rates, and estimated the chemical exchange rates of this agent using each analysis method. This report describes our evaluations and provides recommendations for selecting the best analysis methods for analyzing slow and fast chemical exchange rates.
Theory
Assuming that a CEST agent instantaneously reaches steady-state saturation (but does not necessarily reach complete saturation), a previous report has shown that CEST can be described as a function of saturation time (tsat) and saturation power (ω1) (Eq. [1]) (9).
| [1] |
where:
| [2] |
| [3] |
| [4] |
kex: chemical exchange rate
MS, M0: water signal with saturation (S) and without saturation (0)
[CA], [H2O]: concentration of the contrast agent and water
nCA, nH2O: number of magnetically equivalent exchangeable protons on the agent and water
R1A, R2A, R1w, R2w: R1 and R2 relaxation rates of the agent and water
The QUEST method fits the exponential term of Eq. [1] to CEST measurements determined with a range of saturation times, while the ratiometric term of Eq. [1] is a scalar term during the fitting. QUESP fits Eq. [3] to CEST measurements determined with a range of saturation powers, while the exponential term of Eq. [1] is a scalar term during the fitting. Alternatively, QUEPT fits the ratiometric term and the exponential term of Eq. [3] to CEST measurements determined with ranges of saturation times and powers.
If the relaxation rates of the agent are slow (R1A,2A << kex), and saturation has reached steady state (tsat is very long), then Eq. [1] can be reduced to Eq. [5] (note that R1w,2wkex >> 0 so that the second term in Eq. [4] is always much greater than the third term). As previously shown, CEST can be described as a function of relative concentration, R1w, and chemical exchange rate under these same conditions (Eq. [6]) (15). If the concentration of the agent is not low (χ >> R1w/kex), then Eq. [6] may be approximated (Eq. [7]), combined with Eq. [5] (Eq. [8]), and rearranged to create a linear relationship (Eq. [9]) (10). The x-intercept of this equation is equal to −1/kex2, which provides a relatively simplistic method for determining the chemical exchange rate relative to fitting the non-linear Eq. [1] to experimental results.
| [5] |
| [6] |
| [7] |
| [8] |
| [9] |
Eq. [9] is known as the “Omega Plot” method, which is analogous to the linear Lineweaver-Burk plot that is used to assess Michaelis-Menten chemical kinetics (16). We refer to the Omega Plot method as the “LB-QUESP” method. Michaelis-Menten kinetics can also be analyzed using a linear Eadie-Hoffsee plot or a linear Hanes-Woolf plot that are rearrangements of the Lineweaver-Burk plot (17,18). Similarly, the LB-QUESP method can be rearranged to form the “EH-QUESP” and “HW-QUESP” plotting methods (Eqs. [10] and [11]). The chemical exchange rate can be determined from the slope of the EH-QUESP equation, and from the ratio of the y-intercept and slope of the HW-QUESP equation. This derivation shows that these linear variations of QUESP are only valid with intermediate concentrations of the CEST agent (R1w/kex << χ << 1).
| [10] |
| [11] |
The derivations of concentration-dependent analysis methods that estimate chemical exchange rates have been previously reported (Eqs. [12]-[14]) (11). We refer to these methods as LB-Conc, EH-Conc, and HW-Conc, because they are analogous to Lineweaver-Burk, Eadie-Hoffstee, and Hanes-Woolf plots. The chemical exchange rate can be determined from the ratio of the slope and intercept of the LB-Conc equation or the HW-Conc equation, or from the slope of the EH-Conc equation, if the r1 relaxivity of the agent is known.
| [12] |
| [13] |
| [14] |
Methods
Simulations
The Bloch equations were used to generate CEST spectra of iopromide. All simulations used chemical shifts of 5.6 ppm and 4.2 ppm for each amide resonance, 0.0 ppm for the water resonance, and 0.87 ppm for the hydroxyl group resonance that was set to an exchange rate of 400 Hz. Each simulation tested exchange rates from 0 to 1200 Hz and T1 relaxation times from 0.1 to 10 seconds. One set of simulations tested saturation times of 0.25 to 10 seconds with a saturation power of 4 μT and a concentration of 200 mM. Another set of simulations tested saturation powers of 0.5 to 10 μT with a saturation time of 6 seconds and a concentration of 200 mM. Yet another set of simulations were tested with concentrations of 10 to 2,500 mM, a saturation time of 6 seconds and a saturation power of 5 μT. A finite continuous-wave saturation pulse and an infinite series of pulses that represent steady-state conditions were each used for the simulations. The simulated results were identical for both types of saturation pulse periods, which agreed with results from previous reports (19,20). Therefore, the results from the finite saturation pulse were used for subsequent analyses, because the experimental study used this type of saturation pulse. Lorentzian line shape fitting was used to measure the CEST effect (MS) for each amide from each simulated spectrum as previously described, using spectra normalized from 0% to 100% water signal (which set M0 equal to 100%) (21). The fittings were performed with Matlab v2011a (Mathworks, Inc. Natick MA) using the trust-region-reflective algorithm to reach a convergence criterion of 10−16.
The QUEST, QUESP, and QUESPT methods were fit to simulated results to estimate the chemical exchange rate of the amide at 5.6 ppm. Fittings were either performed by setting R1w to the inverse of the T1w value used to simulate the spectrum, or were performed by allowing R1w to be a fitted parameter. R2w was set to R1w for all of these fittings. The LB-QUESP, EH-QUESP, HW-QUESP, LB-Conc, EH-Conc, and HW-Conc methods were also used to estimate chemical exchange rates from the simulated CEST results. LB-QUESP was fit to results simulated with saturation times less than or equal to 7 μT, and the other methods were fit to results simulated with all saturation times. All non-linear fittings were performed with Matlab v2011a using the trust-region-reflective algorithm to reach a convergence criterion of 10−16. All linear fittings were performed with Matlab v2011a using an ordinary least squares algorithm.
Experimental Studies
Iopromide was diluted with PBS to concentrations of 270, 178, 135, 90, 45, and 22.5 mM, and were adjusted to 6.47 pH units with concentrated sodium hydroxide. All CEST experiments were performed using a 600 MHz Varian Inova NMR spectrometer with an inverse cryoprobe. Samples were analyzed at 37.3°C. The temperature was calibrated by measuring the separation of resonances of neat methanol and ethylene glycol samples between 25°C and 40°C (22). The probe was manually tuned to each sample, and the 90° pulse time was measured to initially estimate the saturation power. The exact saturation power was obtained from the Bloch fitting. CEST spectra were acquired with a continuous-wave saturation pulse and saturation frequencies set at 10 to −10 ppm in 0.2 ppm increments, and each scan was averaged four times. For the first set of studies, saturation times ranging between 0.5 and 6 sec were tested with a relaxation delay from 5.5 to 0 seconds to maintain a total time of 6 seconds for the pre-acquisition period. These studies were conducted with a saturation power of 5.2 and 13.14 μT and a sample with a concentration of 178 mM. For the second set of studies, saturation powers ranging between 0.325 and 7.618 μT were tested with a saturation time of 6 sec and with no additional relaxation delay, using a sample with a concentration of 178 mM. For the third set of studies, samples with a series of concentrations were tested with saturation time of 6 seconds and saturation power of approximately 3.2 μT.
The Bloch-McConnell equations modified for chemical exchange were fit to experimental CEST spectrum (Eq. [12]) (8,23). The integrating factor method was used to solve the Bloch equations. The lsqcurvefit routine with the trust-region-reflective algorithm was used to initially fit the CEST spectra, which resulted in rough parameter estimates. The nlinfit routine with the Levenburg-Marquardt algorithm was then used to fit the CEST spectra to obtain the final parameter estimates. The Jacobian from the nlinfit routine was used to determine confidence intervals for fitted parameters.
Other CEST studies with MRI scanners have accounted for B0 and B1 inhomogeneities (23,24). To account for B0 and B1 inhomogeneities in our studies, each point of an experimental CEST spectrum was assumed to represent a Gaussian-shaped point spread function, which was modeled during the fitting process. However, the fitting results with and without the point spread function were identical, indicating that accounting for B0 and B1 inhomogeneities was unnecessary with data generated from our NMR spectrometer. Subsequent analyses were conducted without incorporating the point spread function. The fitting process estimated values for the T1w, T2w, T1A, and T2A relaxation times of the amide protons of the agent. As previously reported, these fitted estimates of the CEST agent’s relaxation times are inconsequential to the fitting process (8). Furthermore, to validate the fitting method, fitted parameters were estimated using all but one experimental CEST spectrum, then the remaining experimental spectrum was compared to a simulated spectrum using the fitted parameters. In all cases, the remaining experimental spectrum and simulated spectrum showed an outstanding match.
Lorentzian line shape fitting was used to measure the CEST effect (MS) for each amide from each experimental spectrum as previously described, using spectra normalized from 0% to 100% water signal (which set M0 equal to 100%) (19). The fittings were performed with Matlab v2011a using the trust-region-reflective algorithm to reach a convergence criterion of 10−16. The QUEST, QUESP, QUESPT, LB-QUESP, EH-QUESP, HW-QUESP, LB-Conc, EH-Conc, and HW-Conc methods were used to estimate kex rates from these CEST measurements determined from the Lorentzian line shape fittings.
Results
Simulations
The Bloch equations were used to generate CEST spectra of iopromide using a range of chemical exchange rates, saturation times, saturation powers, and concentrations (Fig. 1A, 1B). Each CEST spectrum was fit with a function of four Lorentzian line shapes to measure the CEST effects of both amide protons (Fig. 1C, 1D). The Lorentzian line shapes did not exactly match the CEST spectra as shown by non-zero fitting residuals. However, the residuals at the maximum CEST effect simulated with low and high saturation powers were 2.0% and 0.33% of the CEST measurement, respectively, which demonstrated that the Lorentzian line fitting could measure CEST with high accuracy. Additional fitting iterations to meet tighter convergence criteria did not improve the accuracy of this result, which demonstrated that this small inaccuracy is an inherent difference between Lorentzian line shapes and CEST spectra. The CEST effect at 4.2 ppm was more difficult to fit with a Lorentzian line shape than the CEST effect at 5.6 ppm, presumably because peak at 4.2 ppm was a “shoulder peak” on the larger peak at 5.6 ppm.
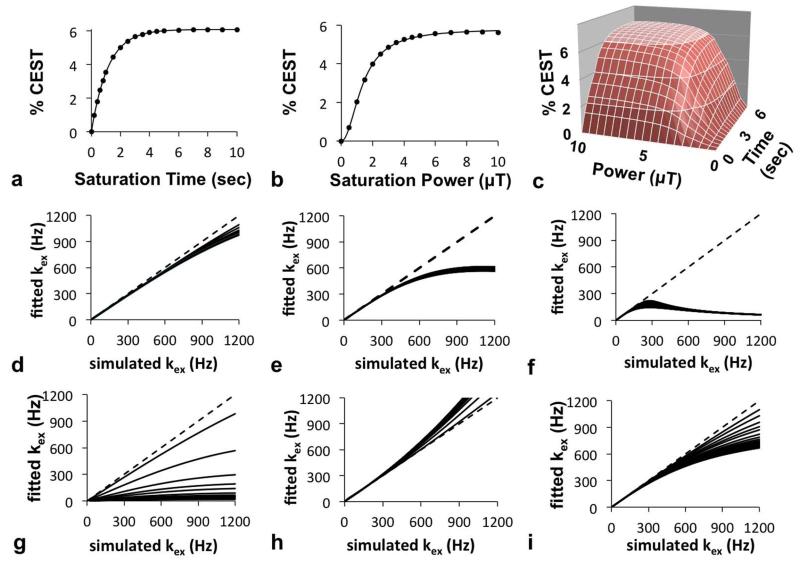
The CEST measurements were used to estimate exchange rates using QUEST, QUESP and QUESPT (Fig. 2A-C). The QUEST method fit the simulated results throughout the entire range of saturation times. The QUESP method showed an excellent fitting to the simulated results obtained with low and moderate saturation powers, but showed a small deviation when fitting to simulated results obtained with high saturation power. The QUESPT method showed similar results, with exact fitting to simulated results along the entire time dimension, and a small deviation when fitting to simulated results with high saturation power. This result demonstrated that QUESPT is a mixture of QUEST and QUESP, and does not necessarily improve analytical accuracy relative to QUEST.
Figure 2.
QUEST, QUESP, and QUESPT analyses of simulated CEST MRI results. a) A representative QUEST fitting of simulated results generated with 10 μT saturation power, 25 Hz chemical exchange rate, and 1.5 second T1w relaxation time; b) A representative QUESP fitting with simulated results generated with 10 second saturation time, 350 Hz chemical exchange rate, and 0.1 second T1w relaxation time; c) A representative QUESPT fitting with simulated results generated with a 25 Hz chemical exchange rate and 1.5 second T1w relaxation time. The exchange rates estimated with QUEST at d) 10 μT, e) 4 μT, and f) 1 μT saturation power at short (*) and long (●) T1w relaxation times showed that QUEST accurately estimated slow kex rates, but required high saturation power to accurately estimate fast kex, with a minor dependence on T1w relaxation times. The exchange rates estimated with QUESP g) with fixed T1w and T2w relaxation times ranging from short (*) to long (●) estimated fast kex with poor accuracy, h) while allowing T1w and T2w to be fitted improved the accuracy of estimating fast kex. i) The estimations of exchange rates with QUESPT showed a result that was intermediate between the results from QUEST and QUESP methods. For graphs d-i, a dashed line with slope=1 is shown to aid visualization of the results.
The QUEST method estimated kex with excellent accuracy, although the accuracy decreased at faster kex rates (Fig. 2D), which agreed with a previous report (9). This decreased accuracy at faster kex was amplified as the saturation power was decreased (Fig. 2D-F). The accuracy of estimating kex with QUEST increased with shorter simulated T1w relaxation times, although this dependence was minor throughout the range of exchange rates that were tested. Therefore, these results demonstrated that QUEST can measure slow exchange rates with excellent accuracy as long as the saturation power is high.
The QUESP method also estimated kex with decreasing accuracy at faster kex rates, which also agreed with a previous report (Fig. 2G) (9). QUESP was more severely dependent on this effect of T1w time, showing extreme inaccuracies when T1w times were greater than 0.1 sec. To investigate this dependence on T1w time, the QUESP method was modified to fit the T1w time in addition to fitting kex (Fig. 2H). The T2w time was set to the variable T1w time during this fitting process. These results showed that this approach overestimated kex, yet produced a more accurate estimate than when T1w and T2w were fixed. The estimated T1w and T2w times were fit to values that were 1/3 to 1/2 of the values used to create the simulated CEST spectra. This result demonstrated that fitting QUESP to CEST results is more sensitive to the value of kex than values of T1w and T2w times. For comparison, the QUEST method was modified in the same way to fit T1w and T2w times in addition to fitting kex. The results were the same as fittings with fixed T1w and T2w times (data not shown), and the estimated T1w and T2w times were not significantly different from the values used to create the simulated CEST spectra.
The QUESPT method estimated kex with decreasing accuracy at faster kex (Fig. 2I). The dependence on T1w and T2w times was intermediate between the dependencies shown with QUEST and QUESP. This result confirmed that QUESPT is a mixture of QUEST and QUESP that does not improve the accuracy of estimating exchange rates relative to QUEST.
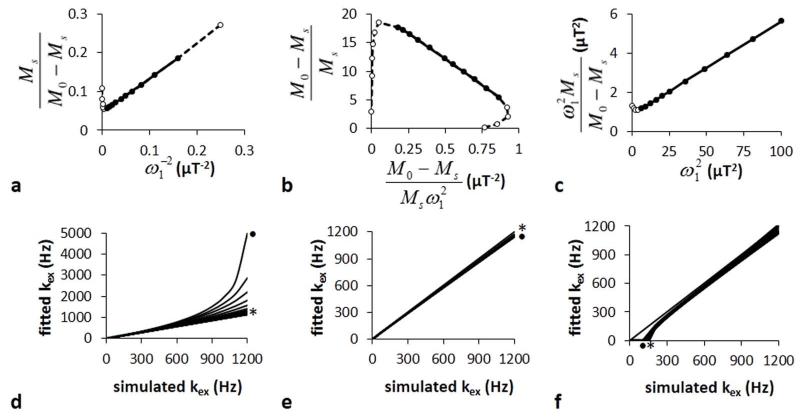
The CEST measurements were also used to estimate kex using the LB-QUESP, EH-QUESP, and HW-QUESP methods (Fig. 3A-C). LB-QUESP and EH-QUESP showed a deviation from linearity at high saturation powers, because the derivation of these equations assumes that the chemical shift difference between the agent and water is much larger than the saturation power (10). HW-QUESP did not suffer from non-linearity at high saturation powers. Each method showed a deviation from linearity at low saturation powers, presumably because very low powers cannot generate instantaneous saturation as assumed in the derivation of the equations. These deviations at high and low saturation powers were more pronounced for simulations performed with long T1W times (data not shown). Yet each method had a range of saturation powers that produced a linear relationship which can be used to estimate kex with high accuracy.
Figure 3.
LB-QUESP, EH-QUESP and HW-QUESP analyses of simulated CEST MRI results generated with a 10 second saturation time, 1200 Hz chemical exchange rate, and 10 second T1w relaxation time. A representative a) LB-QUESP, b) EH-QUESP, and c) HW-QUESP fitting of simulated CEST results were used to estimate kex. d) The kex estimated with LB-QUESP at short (*) and long (●) T1w relaxation times accurately estimated slow exchange rates, but failed to accurately estimate fast exchange rates. e) EH-QUESP accurately estimated slow and fast exchange rates, and f) HW-QUESP accurately estimated fast exchange rates, with little dependence on T1w relaxation times.
The LB-QUESP method estimated kex with excellent accuracy, although the accuracy decreased at faster kex rates (Fig. 3D). As with QUESP, longer T1w times decreased the accuracy of estimating kex with this method. For comparison, EH-QUESP estimated kex with excellent accuracy and with little dependence on T1w times (Fig. 3E). HW-QUESP also estimated kex with excellent accuracy with negligible dependence on T1w times, although the accuracy decreased for slower kex (Fig. 3F). Therefore, these results indicated that EH-QUESP and HW-QUESP are the most accurate methods for estimating fast exchange rates.
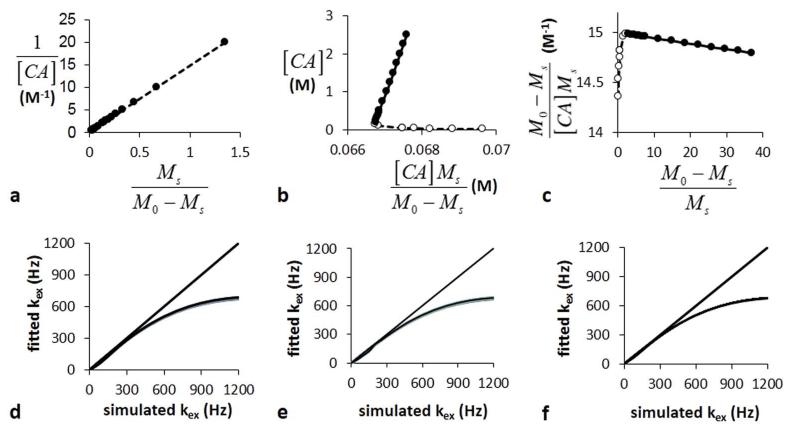
The CEST measurements were also used to estimate kex using the LB-Conc, EH-Conc, and HW-Conc methods (Fig. 4A-C). EH-Conc showed deviation from linearity at low concentrations, while HW-Conc showed deviation from linearity at high concentrations. LW-Conc showed linearity throughout the concentration range tested during this study. The linear range of each method was used to estimate kex (Fig. 4D-F). Each of these methods estimated kex with excellent accuracy for slow kex rates, and with decreasing accuracies for faster kex rates. These accuracies were independent of T1w times (Fig. 4D-F) and saturation powers (data not shown). These results showed that concentration-based analysis methods fail to accurately measure fast exchange rates.
Figure 4.
LB-Conc, EH-Conc, and HW-Conc analyses of simulated CEST MRI results generated with a 3.5 μT saturation power, 10 second saturation time, 1200 Hz chemical exchange rate, and 10 second T1w relaxation time. A representative a) LB-Conc, b) EH-Conc, and c) HW-Conc fitting of simulated CEST results were used to estimate kex. d) LB-Conc, e) EH-Conc, and f) HW-Conc accurately estimated slow kex, but failed to accurately estimate fast kex. The T1w relaxation time did not affect the accuracies of these estimates.
Experimental Results
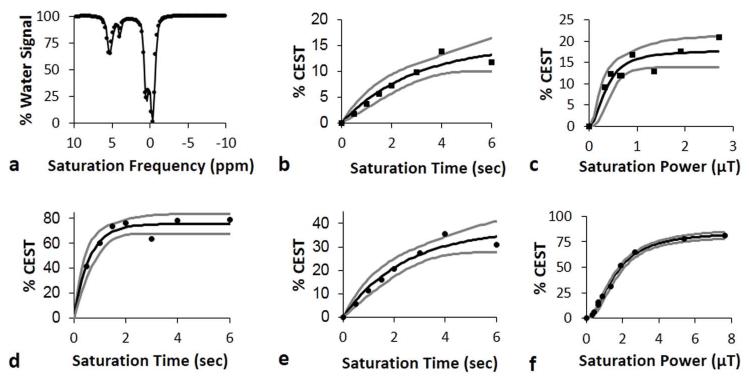
Experimental CEST spectra of iopromide were obtained using a range of saturation times, saturation powers, and concentrations (Fig. 5A). The Bloch equations were simultaneously fit to twelve CEST spectra with different saturation times and powers to estimate the chemical exchange rates for both amide protons of iopromide (Table 1). The confidence intervals of fitting the twelve CEST spectra were 1.7%, while fitting to a CEST spectrum with 6 seconds of 1 μT saturation generated confidence intervals of 3.1%, which demonstrated that simultaneously fitting multiple CEST spectra generated greater accuracy. The T1w and T2w times and the saturation powers were also fitted with this method, rather than fixing these parameters during the fitting. The estimated T1w and T2w times from the fitting were 3.64 sec and 1.54 sec, respectively. The saturation powers were determined to be 34.5% greater than the experimental values estimated from the 90° pulse time. This result indicated that radiation damping or amplifier non-linearity affected the estimation of saturation powers from the measured 90° pulse time. The saturation powers that were accurately estimated from Bloch fittings were used for the subsequent analyses. Overall, these results showed that the saturation power and T1w and T2w relaxation times do not have to be experimentally determined to estimate chemical exchange rates with the Bloch fitting method.
Figure 5.
Bloch fitting, QUEST, and QUESP analyses of 178 mM of iopromide. a) Bloch fitting of a representative CEST spectrum of iopromide acquired with 1.26 μT saturation power was used to estimate kex. b) QUEST with saturation power of 5.2 μT and c) QUESP with saturation time of 6 seconds were used to analyze CEST at 4.2 ppm to estimate the exchange rate for the slowly exchanging amide proton. d) QUEST with saturation power of 13.14 μT, e) QUEST with saturation power of 5.2 μT, and f) QUESP with saturation time of 6 seconds were used to analyze CEST at 5.6 ppm to estimate the exchange rate for the rapidly exchanging amide proton. The boundary estimates are shown as gray lines.
Table 1.
The Estimated Chemical Exchange Rates of lopromide (Hz).The 95% confidence intervals are shown in parentheses.
| Method | 4.2 ppm | 5.6 ppm |
|---|---|---|
| Bloch Fitting | 55.9 (53.7 - 58.3) | 1117.1 (1100.5 - 1134.0) |
| QUEST (4 μT) | 28.9 (17.5 -47.8) | 87.8 (57.6 - 133.9) |
| QUEST (10 μT) | --- | 694.7 (453.8 - 1063.7) |
| QUESP | 118.0 (65.2 -213.6) | 2826.3 (2059.7 -3878.2) |
| LB-QUESP | 101.2 (80.2 -111.3) | 922.3 (648.8 - ∞) |
| EH-QUESP | −118.3 (−41.7 to −162.0) | 1160.5 (1040.3-1269.3) |
| HW-QUESP | 300.0 (0 -416.1) | 1225.2 (1224.6 - 1226.0) |
| LB-Conc | 595.4 (537.2 - 653.5) | 308.3 (210.1 –406.4) |
| EH-Conc | 655.6 (516.3 - 794.8) | 198.5 (0-841.6) |
| HW-Conc | 607.3 (494.4 - 720.2) | 327.1 (162.2 -492.0) |
Each CEST spectrum was also fit with a function of four Lorentzian line shapes to measure the CEST effects of both amide protons. The maximum residuals for the CEST effects at 5.6 and 4.2 ppm were 0.07% CEST and 0.15% CEST respectively when a 4 μT saturation power was used, which demonstrated that the Lorentzian line fitting can measure CEST with high accuracy. A Lorentzian line shape could not be reliably fit to the amide resonance at 4.2 ppm when 10 μT saturation power was used due to peak broadening throughout the CEST spectrum.
The QUEST and QUESP methods were used to estimate kex of the slowly exchanging amide proton at 4.2 ppm (Fig. 6, Table 1). Although both methods estimated kex rates that were close to the rates estimated from Bloch fitting, QUEST underestimated this rate and QUESP overestimated this rate, which was consistent with the results from simulations. The estimate of kex with QUEST had confidence intervals (CIs) that were narrower than the CIs for QUESP, which indicated that QUEST can more precisely estimate kex.
Figure 6.
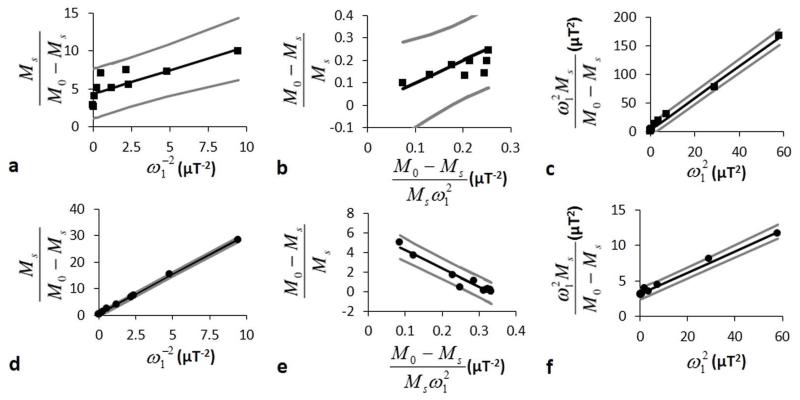
LB-QUESP, EH-QUESP, and HW-QUESP analyses of 178 mM iopromide with a saturation time of 6 seconds. a) LB-QUESP, b) EH-QUESP, and c) HW-QUESP analyses of CEST at 4.2 ppm estimated the kex for the slowly exchanging amide proton. d) LB-QUESP, e) EH-QUESP, and f) HW-QUESP analyses of CEST at 5.6 ppm estimated kex for the rapidly exchanging amide proton. The boundary estimates are shown as gray lines.
The kex of the rapidly exchanging amide proton estimated with QUEST and QUESP showed substantial differences from the rate determined with Bloch fitting, which was consistent with the results of simulations (Table 1). QUESP overestimated this rate and QUEST underestimated this rate, and lower saturation powers caused a greater underestimation by QUEST, which was also consistent with simulations. Both methods produced wide CIs, which further emphasized the difficulty in estimating rapid exchange rates with these methods.
The LB-QUESP method estimated kex for the slowly exchanging amide proton at 4.2 ppm to be similar to the rate determined from Bloch fitting, and this estimate had narrow CIs (Fig. 7A). The HW-QUESP method estimated kex with less accuracy and with wide CIs that indicated less precision relative to LB-QUESP, which was consistent with the simulations for slow kex rates. The EH-QUESP method showed an incorrect slope with this experimental data (Fig. 4C vs. 7C). This method had a very small dynamic range relative to experimental noise over the experimental conditions used in this study, which presumably led to this incorrect slope. These results demonstrated that LB-QUESP produced the most accurate and most precise estimates of kex for slow exchange rates, relative to HW-QUESP and EH-QUESP.
Figure 7.
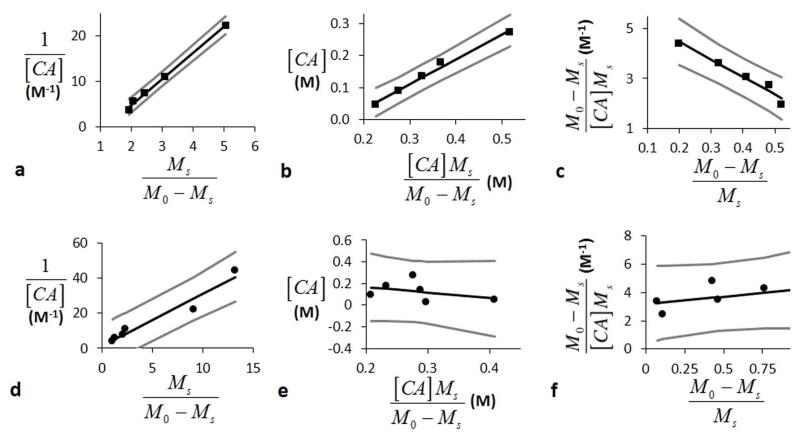
LB-Conc, EH-Conc, and HW-Conc analyses of iopromide with 3.2 μT saturation power and 6 second saturation time. a) LB-Conc, b) EH-Conc, and c) HW-Conc analyses of CEST at 4.2 ppm estimated kex for the slowly exchanging amide proton. d) LB-Conc, e) EH-Conc, and f) HW-Conc analyses of CEST at 5.6 ppm estimated kex for the rapidly exchanging amide proton. The boundary estimates are shown as gray lines.
Conversely, HW-QUESP produced an accurate estimate for kex for the rapidly exchanging proton that resonated at 5.6 ppm, and this estimate had narrow CIs that demonstrated outstanding precision. The EH-QUESP method also estimated kex with excellent accuracy and precision. LB-QUESP produced an inaccurate estimate with CIs that had no upper bound, which demonstrated poor precision for this method. These results demonstrated that HW-QUESP and EH-QUESP produced accurate and precise estimates of fast exchange rates relative to LB-QUESP.
The LB-Conc, EH-Conc, and HW-Conc methods each underestimated kex for the rapidly exchanging proton at 5.6 ppm, which was consistent with the results from the simulations. Each concentration-based analysis method estimated kex with wide CIs for the slowly exchanging proton at 4.2 ppm, which indicated that the precisions of these analysis methods are very sensitive to experimental noise. Based on these results, the concentration-based analysis methods produce inaccurate or imprecise estimates of exchange rates relative to the other methods.
Discussion
The Bloch fitting method produced the most precise results, especially when fitting was simultaneously applied to multiple CEST spectra. However, Bloch fitting requires substantial computation time, and some expertise is required to ensure that the fitting achieves the best result. Therefore, Bloch fitting should be used only when the highest accuracy and precision are required, and when expertise and time are available.
The simulations and experimental results both demonstrated that QUEST and QUESP could produce accurate estimates of slow exchange rates. Increasing the saturation power can increase the accuracy of exchange rate estimates made with QUEST. QUESPT produced results with accuracies that were intermediate between QUEST and QUESP, so that QUEST is also preferable to QUESPT for this study. Yet QUESPT fits more data than QUEST and QUESP, which has potential to mitigate random noise, and therefore QUESPT may have advantages when fitting noisy CEST results. Most importantly, QUEST, QUESP, and QUESPT fail to produce accurate estimates of fast exchange rates.
HW-QUESP and EH-QUESP can produce accurate estimates of fast exchange rates. Fast exchanging protons experience less saturation than expected, which leads to a systematic overestimation of the saturation power experienced by these protons. HW-QUESP includes the saturation power in the x- and y-values of the plot (Eq. [11]), so that a systematic error in the saturation power is cancelled. Similarly, fast exchanging protons generate less CEST than expected for the saturation power that is applied. EH-QUESP includes the CEST measurement in the x- and y-values of the plot (Eq. [10]), so that a systematic error in generating a CEST measurement is cancelled. Conversely, LB-QUESP has separate x- and y-values and therefore cannot cancel this systematic error. HW-QUESP plots have a greater range of saturation powers that produce a linear plot, relative to EH-QUESP (Figure 3C vs. 3B). Therefore, HW-QUESP is the best overall method for estimating fast exchange rates.
The QUEST, QUESP, QUESPT, and LB-QUESP methods produced more accurate estimates of fast exchange rates with shorter T1w relaxation times. When saturation is initially applied, the saturation pulse equally affects protons undergoing slow and fast exchange. As the saturation period continues over time, the fast exchanging protons leave the agent more quickly and experience less saturation than expected. Fast T1w relaxation truncates the saturation process, which reduces this effect of less-than-expected saturation of fast exchanging protons.
The concentration plot methods failed to produce accurate estimates. Furthermore, this method requires multiple samples that must have identical conditions such as T1w and T2w times, pH, and temperature. Therefore, this method has technical limitations in addition to systematic analytical errors, and is not recommended for estimating kex rates. For comparison, another method has been reported that estimates kex rates relative to changes in T1w time of a series of samples with the same concentration (25). Linear “T1w plot” methods can be derived that are similar to the linear concentration plot methods shown in this report. This previous report of the T1w method also demonstrated inaccuracies in determining kex rates, primarily due to the limited dynamic range of T1w times that can be tested relative to experimental noise. This method also requires multiple samples that must have identical conditions other than T1w, which is technically challenging. For these reasons, the T1w plot methods are considered to be inferior to the methods tested in this report, so that we did not include the T1w plot methods in our studies.
Other methods that estimate chemical exchange rates from CEST results have been developed that directly account for incomplete saturation and direct saturation of water (3,4). These methods are especially designed for diamagnetic CEST agents that have slow chemical exchange rates, and have not been used to estimate fast exchange rates. As with Bloch fitting, these methods are based on impressive attention to analytical details that avoid assumptions made with more simplistic linear analysis methods, and therefore can be used for a robust range of CEST experiments. Yet these detailed algorithms require expertise to develop the computer algorithms, and can require substantial computation time. The HW-QUESP method provides a more simplistic alternative for estimating chemical exchange rates, especially fast exchange rates, provided that the conditions of the CEST experiments meet the assumptions of this method.
Conclusions
These simulations and experimental results demonstrate that the HW-QUESP method produces the best estimates of fast chemical exchange rates from CEST MRI results. QUEST and LB-QUESP produce the best estimates of slow exchange rates especially for samples with short T1w relaxation times. Bloch fitting produces the most precise methods especially when simultaneously fit to a series of CEST spectra, although expertise and computation time are required to achieve precise results with Bloch fitting relative to the relatively simplistic linear analysis methods.
Acknowledgements
The authors thank Dr. Julio Cárdenas-Rodríguez for helpful discussions, and thank Drs. Dean Sherry and Todd Soesbe at the University of Texas Southwestern for access to Matlab code for simulating CEST spectra. This work was supported by NIH grants R01 CA169774-01 and P50 CA95060, the Phoenix Friends of the Arizona Cancer Center, and the Community Foundation of Southern Arizona.
References
- 1.Yoo B, Pagel MD. An overview of responsive MRI contrast agents for molecular imaging. Front Biosci. 2007;13:1733–1752. doi: 10.2741/2796. [DOI] [PubMed] [Google Scholar]
- 2.Liu G, Li Y, Sheth VR, Pagel MD. Imaging in vivo extracellular pH with a single PARACEST MRI contrast agent. Molec Imaging. 2012;11:47–57. [PMC free article] [PubMed] [Google Scholar]
- 3.Sun PZ, Sorensen AG. Imaging pH using the chemical exchange saturation transfer (CEST) MRI: Correction of concomitant RF irradiation effects to quantify CST MRI for chemical exchange rate and pH. Magn Reson Med. 2008;60:390–397. doi: 10.1002/mrm.21653. [DOI] [PubMed] [Google Scholar]
- 4.Sun PZ. Simultaneous determination of labile proton concentration and exchange rate utilizing optimal RF power: Radio frequency power (RFP) dependence of chemical exchange saturation transfer (CEST) MRI. J Magn Reson. 2010;202:155–161. doi: 10.1016/j.jmr.2009.10.012. [DOI] [PMC free article] [PubMed] [Google Scholar]
- 5.Sun PZ, van Zijl PCM, Zhou J. Optimization of the irradiation power in chemical exchange dependent saturation transfer experiments. J Magn Reson. 2005;175:193–200. doi: 10.1016/j.jmr.2005.04.005. [DOI] [PubMed] [Google Scholar]
- 6.Liu G, Ali M, Yoo B, Griswold MA, Tkach JA, Pagel MD. PARACEST MRI With Improved Temporal Resolution. Magn Reson Med. 2009;61:399–408. doi: 10.1002/mrm.21863. [DOI] [PMC free article] [PubMed] [Google Scholar]
- 7.Soesbe TC, Togao O, Takahashi M, Sherry AD. SWIFT-CEST: A New MRI Method to Overcome T2 Shortening Caused by PARACEST Contrast Agents. Magn Reson Med. 2012;68:816–821. doi: 10.1002/mrm.23302. [DOI] [PMC free article] [PubMed] [Google Scholar]
- 8.Woessner DE, Zhang S, Merritt ME, Sherry AD. Numerical solution of the Bloch equations provides insights into the optimum design of PARACEST agents for MRI. Magn Reson Med. 2005;53:790–799. doi: 10.1002/mrm.20408. [DOI] [PubMed] [Google Scholar]
- 9.McMahon MT, Gilad AA, Zhou J, Sun PZ, Bulte JW, van Zijl PC. Quantifying exchange rates in chemical exchange saturation transfer agents using the saturation time and saturation power dependencies of the magnetization transfer effect on the magnetic resonance imaging signal (QUEST and QUESP): pH calibration for poly-L-lysine and a starburst dendrimer. Magn Reson Med. 2006;55:836–847. doi: 10.1002/mrm.20818. [DOI] [PMC free article] [PubMed] [Google Scholar]
- 10.Dixon WT, Ren J, Lubag AJM, Ratnakar J, Vinogradov E, Hancu I, Lenkinski RE, Sherry AD. A Concentration-Independent Method to Measure Exchange Rates in PARACEST Agents. Magn Reson Med. 2010;63:625–632. doi: 10.1002/mrm.22242. [DOI] [PMC free article] [PubMed] [Google Scholar]
- 11.Ali MM, Liu G, Shah T, Flask CA, Pagel MD. Using Two Chemical Exchange Saturation Transfer Magnetic Resonance Imaging Contrast Agents for Molecular Imaging Studies. Acc Chem Res. 2009;42:915–924. doi: 10.1021/ar8002738. [DOI] [PMC free article] [PubMed] [Google Scholar]
- 12.Sun PZ, Wang E, Cheung JS, Zhang X, Benner T, Sorensen AG. Simulation and optimization of pulsed radio frequency irradiation scheme for chemical exchange saturation transfer (CEST) MRI---Demonstration of pH-weighted pulsed-amide proton CEST MRI in an animal model of acute cerebral ischemia. Magn Reson Med. 2011;66:1042–1048. doi: 10.1002/mrm.22894. [DOI] [PMC free article] [PubMed] [Google Scholar]
- 13.Sun PZ. Simplified quantification of labile proton concentration-weighted chemical exchange rate (kws) with RF saturation time dependent ratiometric analysis (QUESTRA): Normalization of relaxation and RF irradiation spillover effects for improved quantitative chemical exchange saturation transfer (CEST) MRI. Magn Reson Med. 2012;67:936–942. doi: 10.1002/mrm.23068. [DOI] [PMC free article] [PubMed] [Google Scholar]
- 14.Ward KM, Aletras AH, Balaban RS. A new class of contrast agents for MRI based on proton chemical exchange dependent saturation transfer (CEST) J Magn Reson. 2000;143:79–87. doi: 10.1006/jmre.1999.1956. [DOI] [PubMed] [Google Scholar]
- 15.Zhang S, Merritt M, Woessner DE, Lenkinski RE, Sherry AD. PARACEST agents: modulating MRI contrast via water proton exchange. Acc Chem Res. 2003;36:783–790. doi: 10.1021/ar020228m. [DOI] [PubMed] [Google Scholar]
- 16.Lineweaver H, Burk D. Determination of enzyme dissociation constants. J Am Chem Soc. 1934;56:658–666. [Google Scholar]
- 17.Hofstee BH. On the evaluation of the constants Vm and KM in enzyme reactions. Science. 1952;116(3013):329–331. doi: 10.1126/science.116.3013.329. [DOI] [PubMed] [Google Scholar]
- 18.Hanes CS. Studies on plant amylases: The effect of starch concentration upon the velocity of hydrolysis by the amylase of germinated barley. Biochem J. 1932;26(5):1406–1421. doi: 10.1042/bj0261406. [DOI] [PMC free article] [PubMed] [Google Scholar]
- 19.Sheth VR, Liu G, Li Y, Pagel MD. Improved pH measurements with a single PARACEST MRI contrast agent. Contrast Media Molec Imaging. 2012;7:26–34. doi: 10.1002/cmmi.460. [DOI] [PMC free article] [PubMed] [Google Scholar]
- 20.Van Geet AL. Calibration of the methanol and glycol nuclear magnetic resonance thermometers with a static thermistor probe. Anal Chem. 1968;40:2227–2229. [Google Scholar]
- 21.Murase K, Tanki M. Numerical solutions to the time-dependent Bloch equations revisited. Magn Reson Imaging. 2011;29:126–131. doi: 10.1016/j.mri.2010.07.003. [DOI] [PubMed] [Google Scholar]
- 22.Tee YK, Khrapitchev AA, Sibson NR, Payne SJ, Chappell MA. Evaluating the use of a continuous approximation for model-based quantification of pulsed chemical exchange saturation transfer (CEST) J Magn Reson. 2012;222:88–95. doi: 10.1016/j.jmr.2012.07.003. [DOI] [PMC free article] [PubMed] [Google Scholar]
- 23.Desmond KL, Stanisz GJ. Understanding quantitative pulsed CEST in the presence of MT. Magn Reson Med. 2012;67:979–990. doi: 10.1002/mrm.23074. [DOI] [PubMed] [Google Scholar]
- 24.Sun PZ, Farrar CT, Sorensen AG. Correction for artifacts induced by B0 and B1 field inhomogeneities in pH-sensitive chemical exchange saturation transfer (CEST) imaging. Magn Reson Med. 2007;58:1207–1215. doi: 10.1002/mrm.21398. [DOI] [PubMed] [Google Scholar]
- 25.Li Y, Sheth VR, Liu G, Pagel MD. A self-calibrating PARACEST MRI contrast agent that detects esterase enzyme activity. Contras Media Molec Imaging. 2011;6:219–228. doi: 10.1002/cmmi.421. [DOI] [PMC free article] [PubMed] [Google Scholar]


