

Abstract
Second harmonic generation (SHG) is a well-established optical modality widely used in biomedical optics to image collagen based tissues. The coherent signal of the forward direction SHG produces a high resolution image that can resolve individual fibers (groups of fibrils). In highly ordered collagen lamellae, such as in the corneal stroma, it is important to determine the orientation of the fibers as they contribute significantly to the biomechanics of the tissue. However, due to the crimped structure of the fibers, it is challenging to robustly determine their orientation using an independent computational method, compared to the straight fibers problem. Previous work in the field used the polarization of the fundamental or other techniques involving a more manual selection of the orientation, in order to differentiate between various directions in corneal structures. Yet those lack accuracy and independency. We present a robust independent technique to determine the orientation of the fibers in the corneal structure. The experimental results presented here, taken from different lamellae, demonstrate strongly the correct orientation.
Several techniques have been investigated for second harmonic generation (SHG) images in an attempt to quantify the orientation of the fibers in a lamella of a cornea. Normally, well established image processing tools, such as the Radon or the Hough transforms, would be a suitable solution for the problem [1,2]. However, since SHG images of collagenous tissue often comprise many lamellae criss-crossing with crimps at different shapes and amplitudes, it will be a challenging task to use the traditional techniques effectively and efficiently (The term “crimp” or “wave” in the corneal tissues lamellae refers to collagen fibrils in each layer). Both Radon and Hough transform are more suitable for finding straight lines in an image. One way to address the problem of determining the orientation of the lamellae is to utilize the fact that the forward direction SHG photons are emitted when the orientation of the lamellae is along the same direction as the polarization vector of the fundamental [3,4]. The use of this method is rather qualitative since the angular resolution is fairly limited. Other techniques employ manual methods combined with a supporting analytical method, such as the Fourier transform, to validate the result obtained during the process [5–7]. However the manual methods lack consistency and are likely to give different results if performed by different users. Also, as we will discuss later, manual analysis of SHG images often biases the results. Furthermore, when dealing with a large dataset, such as is often collected from a z-stack or an orientation mapping across large area, manual selection of the orientation can be both tedious and very time consuming. Another method used to extract orientation information is x ray scattering [8–10]; however its results lack the relatively direct imaging aspect. Also, using x ray scattering, the information represents an integration of the entire z-stack at a given measurement point and therefore lacks the depth resolution that can be achieved with multiphoton methods. In addition, results from an x ray based technique will also be affected by the crimps of the fibers, as photons will be scattered differently from a crimpy structure.
We present here a technique to consistently and robustly quantify the different orientations of the collagenous lamellae in the cornea. Although this technique might be used for other collagen based lamellar tissues, our results are focused on SHG imaging of the corneal stroma. This method is found to be particularly useful for SHG images where the fibers have a highly crimped architecture. The method was first tested on some synthetically generated images, where the angle, amplitude, thickness, and noise of fibers in the image are input parameters. The results showed excellent matching to the orientation of the crimpy lines. Determining the direction of the fibers in a crimpy lamella, especially a case when the crimped fibers have high amplitude excursions, can be quite challenging, since in this case the direction of the crimps will be measured as a distinguished direction. The direction of the crimps, however, is of no real value, and we are interested, rather, in the overall orientation of the fibers.
The second harmonic images were taken from a bovine cornea obtained from a local abattoir. The sample was placed on a No. 1 microscope cover slip and imaged using an 800 nm excitation wavelength. The processing steps were done using MATLAB 2011(a), but can be implemented in any other image processing software package. Figure 1 shows the steps of the method used to achieve the angular information about the lamellar orientation. Figure 1(a) shows the original SHG image that was taken using our microscope. The image shows obvious wavy fibers that are all oriented at an angle close, yet smaller than 90 degrees (vertical lines in the image). The crimps are small, changing their angle by only a few degrees. Figure 1(b) shows the processed FFT image. Energy in a wide distribution of spatial frequencies in the direction orthogonal to the lamellae is readily apparent. Although the FFT contains all of the orientation information, the noise in the FFT is an obstacle when formulating a conclusion regarding the orientation of the lamellae. The crimps in the image result in another peak on the FFT. To overcome this challenge, we apply a band pass filter (BPF), 0.035–0.573[um−1], to the image. The use of the BPF serves a dual purpose: It removes the DC background noise and the high frequency fibrous information from the lamellae. Next, we filter the remaining FFT image by adjusting the contrast. This is done by adjusting the histogram such that the bottom level will be about twice the minimum value of the histogram while keeping the original maximum. This latter step might change from one optical system to another, depending on the background level and the SNR of the image. The adjustment of the histogram helps to eliminate the low value integrals in the Fourier transform that do not contain real spatial information of the sample, yet produce a non-zero value result due to the noise of the image. We proceed by applying a median filter with a size of 4 × 4 pixels to remove “salt and pepper” noise from the remaining FFT image. The image is then rotated by 90 degrees to correct for the π/2 angular shift between information in the real and the Fourier domain. Figure 1(c) shows the Radon transform (RT) of the FFT image. The dominant direction in the FFT shows a clear peak in the RT image. We should now point out that the RT transform would not be useful without the previous step of the BPF. In the FT image, since the DC component is the average brightness of the image, it is usually of a very high magnitude. The DC component strongly affects the result of the RT. Since the DC level can be several orders of magnitude higher than some of the higher frequencies, integrals passing through the center, i.e., x′ = 0, would have had a much higher result. It is therefore better to avoid that by applying a BPF. In the RT image, a peak corresponds to a distinguishable line in the FFT image. And since a line passing through the center of the FFT image only contains information from an orthogonal line in the real domain, regardless of the frequencies residing along that line, a peak in RT will indicate a dominant direction in the real image. In theory we could apply the RT to Fig. 1(a) or a filtered version of it, such as the FFT of Fig. 1(b). However, in that case, the peaks of the RT image will be more scattered along the x′ axis. When using an FFT image, all lines oriented at a certain direction in the real image, even if they do not pass through the center of image, in the Fourier domain, will reside along a line that does pass through the center. Then, by taking the RT, we ensure that all peaks are close to the center of the x′ axis. We take advantage of this latter fact and choose the x′ = 0 line to represent the angular information of the fibers as shown in Fig. 1(d). The width of the peak represents the variation in angular information present within a lamella at a single orientation. The variation is caused by natural deviation of the fibers as often happens with biological samples and is not affected by the orientation of the crimped fibers. The shape of the peak in Fig. 1(d), its width, and the total angular distribution of Fig. 1(b) are in agreement with some previously reported angular information [8].
Fig. 1.
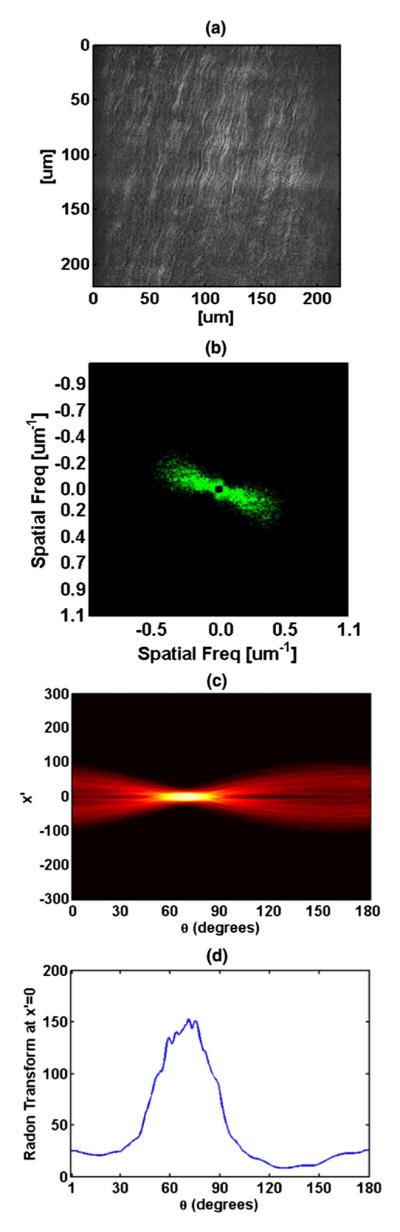
(Color online) Steps of the process performed in order to retrieve the orientation of fibers in cornea lamella. (a) Original second harmonic generation (SHG) image; (b) Filtered FFT image using a band pass filter (BPF) and processed using histogram adjustment and median filter; (c) Radon transform of the FFT transform showing peak at dominant orientation; (d) Plot of x′= 0 of the Radon transform.
Figure 2(a) shows a somewhat more complicated case where there are several orientations observed in the image. The added arrows highlight the high value directional integrals taken from our analysis shown in Fig. 2(b). In this case, where multiple directions are present, it is a more difficult task to perform manual measurement of the directionality of the lamella. One very noticeable point is that observers are likely to disregard the intensity information and focus more on structural information, treating bright and dark areas nearly the same. However, this isn’t necessarily an accurate measurement since a brighter SHG signal does imply higher concentration of fibers present in the focal plane, where other structural information might be slightly out-of-focus. Another important point is that a human observes the problem with prior information. When measuring the angular information manually, the observer is expecting a pattern of crossing lines. Therefore, when looking at an image containing crimpy lamellae or having noncontinuous fibers, the observer will fill in the missing information. These types of processing, namely pixel interpolation or path finding algorithms, will therefore result in biasing the total result. As can be observed, Fig. 2(b) shows several peaks matching directions of fibers that are present in the image. The peaks in Fig. 2(b) take in to account the intensity information. The maximum peak appears at ~70° and corresponds to the area in the image that resides underneath the yellow arrow. It is noticeable that this area in the image has a high intensity and as a result, the values of RT integrals from that area, are higher. In addition, as demonstrated qualitatively in Fig. 1(a) and 1(d), what may appear as a single direction, in practicality contains a span of angles. In Fig. 2(a) there are several directions that are close to 90° (blue, yellow, and orange arrows). Each direction has a certain band of angles present in the sheet of fibers and those bands of angles overlap with nearby information and creating the broad center peak. There is also a clear distinct orientation at around 45° (marked using green arrows) that has a corresponding wide peak in Fig. 2(b). It can be seen that there is a high level of crimps present along that direction, mainly in the upper part of the image. Those crimps, using normal computational methods, would have miscounted as corresponding to a 0° and 60°, but here are instead counted as a part of the 45° sheet. A smaller peak of ~160° is present (red arrow). This region has a lower value due to the fact that it is darker than other sheets of fibers in the image.
Fig. 2.

(Color online) Lamella containing several different orientations of fibers [(a)] and the corresponding angular result obtained using our technique [(b)].
The method described here demonstrates a reliable method that overcomes some of the challenges in quantifying the directions of fibers in collagen lamellae. The method is robust, independent of the observer, and in agreement with methods previously used in the field.
Footnotes
OCIS codes: 110.1758, 170.3880.
References
- 1.Ballard DH. Pattern Recognition. 1981;13:111. [Google Scholar]
- 2.Illingworth J, Kittler J. Comput Vis Graph Image Process. 1988;44:87. [Google Scholar]
- 3.Psilodimitrakopoulos S, Petegnief V, Soria G, Amat-Roldan I, Artigas D, Planas AM, Loza-Alvarez P. Opt Express. 2009;17:14418. doi: 10.1364/oe.17.014418. [DOI] [PubMed] [Google Scholar]
- 4.Williams RM, Zipfel WR, Webb WW. Biophys J. 2005;88:1377. doi: 10.1529/biophysj.104.047308. [DOI] [PMC free article] [PubMed] [Google Scholar]
- 5.Rao RA, Mehta MR, Toussaint KC. Opt Express. 2009;17:14534. doi: 10.1364/oe.17.014534. [DOI] [PubMed] [Google Scholar]
- 6.Rao RAR, Mehta MR, Leithem S, Toussaint JKC. Opt Lett. 2009;34:3779. doi: 10.1364/OL.34.003779. [DOI] [PubMed] [Google Scholar]
- 7.Sivaguru M, Durgam S, Ambekar R, Luedtke D, Fried G, Stewart A, Toussaint KC. Opt Express. 2010;18:24983. doi: 10.1364/OE.18.024983. [DOI] [PubMed] [Google Scholar]
- 8.Hayes S, Boote C, Lewis J, Sheppard J, Abahussin M, Quantock AJ, Purslow C, Votruba M, Meek KM. Anatom Rec. 2007;290:1542. doi: 10.1002/ar.20613. [DOI] [PubMed] [Google Scholar]
- 9.Meek KM, Boote C. Prog Retinal Eye Res. 2009;28:369. doi: 10.1016/j.preteyeres.2009.06.005. [DOI] [PubMed] [Google Scholar]
- 10.Meek KM, Boote C. Exp Eye Res. 2004;78:503. doi: 10.1016/j.exer.2003.07.003. [DOI] [PubMed] [Google Scholar]