

Abstract
The Polycomb group protein Bmi1 is a transcriptional silencer of the Ink4a-Arf locus, which encodes the cell cycle regulator p16Ink4a and the tumor suppressor p19Arf. Bmi1 plays a key role in oncogenesis and stem cell self-renewal. We report that phosphorylation of human Bmi1 at Ser316 by Akt impaired its function by triggering its dissociation from the Ink4a-Arf locus, which resulted in decreased ubiquitylation of histone H2A and the inability of Bmi1 to promote cellular proliferation and tumor growth. Moreover, Akt-mediated phosphorylation of Bmi1 also inhibited its ability to promote self-renewal of hematopoietic stem and progenitor cells. Our study provides a mechanism for the increased abundance of p16Ink4a and p19Arf seen in cancer cells with an activated phosphoinositide 3-kinase to Akt signaling pathway and identifies crosstalk between phosphorylation events and chromatin structure.
Introduction
Polycomb group (PcG) proteins are epigenetic gene silencers that have been implicated in cancer development and stem cell maintenance (1–3). Biological and genetic studies indicate that PcG proteins exist in at least two separate protein complexes, Polycomb repressive complex 2 (PRC2) and Polycomb repressive complex 1 (PRC1), that act in concert to promote and maintain gene repression (2). EZH2, the catalytically active component of PRC2, di- and trimethylates Lys27 of histone H3, a histone mark recognized by the PRC1 complex through the chromodomain of Polycomb (4) that triggers ubiquitination of histone H2A at Lys119 by the E3 ubiquitin ligase Ring1B in PRC1 (5–7). Ubiquitinated H2A has been linked to gene silencing and tumor development (8).
The PcG protein Bmi1 was first identified as a proto-oncogene that cooperates with the transcription factor Myc to promote the generation of B and T cell lymphomas (9, 10). It has subsequently been implicated in oncogenesis because it shows increased abundance in numerous human cancers, including mantle cell lymphoma, leukemia, medullablastoma, colorectal carcinoma, liver carcinomas, and non–small cell lung cancer (11–16). Bmi1 is a potent inhibitor of the Ink4a-Arf locus, which encodes the cell cycle regulator p16Ink4a and tumor suppressor p19Arf proteins (17). Both p16Ink4a and p19Arf expression is induced by oncogenic signals; these proteins function as a potent fail-safe mechanism to prevent cells from proliferating uncontrollably (2, 18).
Targeted disruption of the PRC2 members Ezh2, Eed, or Suz12 or the PRC1 member Rnf2 results in early embryonic lethality, suggesting that PcG proteins play important roles in embryogenesis and embryonic stem (ES) cell maintenance (19–22). PcG proteins directly repress several developmental regulatory genes that would otherwise promote ES cell differentiation (23, 24). Many of these genes have a bivalent chromatin structure, carrying both repressive and activating histone marks (25). Similarly, Ring1B maintains the undifferentiated state of mouse ES cells by repressing important differentiation-promoting genes (26). Ring1B-mediated ubiquitination of histone H2A has been linked to Polycomb-mediated gene silencing (5), and recent data implicate ubiquitination of H2A in restraining RNA polymerase II that is poised at “bivalent” genes in mouse ES cells, allowing the ES cells to self-renew and still retain the ability to generate multiple lineages (27). Therefore, PcG proteins may promote ES cell maintenance by blocking (or postponing) cell fate decisions (3).
In addition to ES cell maintenance, PcG proteins have been implicated in regulating adult stem cell self-renewal (28–31). Bmi1-deficient mice exhibit both neurological disorders and impaired hematopoiesis, demonstrating the essential role of Bmi1 in regulating the self-renewal of both neural and hematopoietic stem cells (28, 29). Bmi1 is also required for the self-renewal capacity of leukemic stem cells (30), suggesting that PcG proteins may contribute to oncogenic transformation by regulating stem cell maintenance (2).
The regulation of PcG gene expression has been linked to key developmental signal transduction pathways (15, 32, 33). Sonic hedgehog signaling increases Bmi1 expression during cerebellar development (15) and in mammary stem cells (34). c-Jun N-terminal kinase signaling increases PcG expression in Drosophila, highlighting the role that external signals can play in regulating PcG expression (35).
The chromatin association of Bmi1 is controlled in a cell cycle– and phosphorylation-dependent manner: During the G1-S phase of the cell cycle, hypophosphorylated Bmi1 is specifically retained in the chromatin-associated nuclear protein fraction, whereas during G2-M, phosphorylated Bmi1 is not chromatin-bound (36). In mammals, members of the PRC1 complex not only localize to euchromatic regions but also accumulate at pericentric heterochromatin as discrete nuclear foci called Polycomb bodies (37). The association of Bmi1 within “Polycomb bodies” is also dynamic, requiring both the EZH2-containing PRC2 complex and the DNA methyltransferase DNMT1 (37). Bmi1 is targeted by mitogen-activated protein kinase (MAPK) signaling (38); however, whether other signaling pathways also inhibits its activity is not clear.
The phosphoinositide 3-kinase (PI3K)– Akt signaling pathway is involved in various cellular processes, affecting cell survival, growth, metabolism, migration, and angiogenesis (39–41). In response to Akt activation (for example, due to acute Pten loss), mouse embryonic fibroblasts (MEFs) accumulate p16 and p19 and undergo senescence (42, 43). Bmi1−/− MEFs similarly undergo premature senescence and accumulate p16 and p19 (17). Pten deletion initially leads to a transient expansion of hematopoietic stem cells; however, the hematopoietic stem cell pool becomes depleted more rapidly than normal over time (44–46). Similarly, loss of Bmi1 leads to decreased hematopoietic stem cell self-renewal capability and bone marrow failure (28, 30). The similarities between the phenotypes of Bmi1−/− cells and Pten−/− cells led us to hypothesize that the PI3K-Akt pathway functions upstream of Bmi1 and inhibits its function. Here, we show that Akt phosphorylates Bmi1 at Ser316, which impairs its function, alters its chromatin association, and inhibits its growth-promoting properties.
Results
Akt phosphorylates Bmi1 at Ser316
First, we found that the endogenous Bmi1 and Akt proteins interact in cells, using coimmunoprecipitation studies (Fig. 1A) and a specific anti-Bmi1 antibody (fig. S1, A and B). Ser316 is a putative Akt phosphorylation site in Bmi1 that is highly conserved across species (Fig. 1B). Active recombinant Akt readily phosphorylated Bmi1, but not a Bmi1-S316A mutant protein (Fig. 1C), and expression of a constitutively active form of Akt (myristoylated Akt) in human embryonic kidney (HEK) 293T cells resulted in phosphorylation of Bmi1 (fig. S1C) (44). To show that Akt phosphorylates Bmi1 at Ser316 in cells, we generated an antibody specific for the phosphorylated form of Bmi1 (fig. S1, D and E) that revealed phosphorylation of wild-type Bmi1, but not the Bmi1-S316A mutant, by myristoylated Akt (Fig. 1D). We then used this antibody to show significant phosphorylation at Ser316 in endogenous Bmi1 by Akt in multiple cell lines with constitutively activated PI3K-Akt signaling (fig. S1F), which was inhibited by the PI3K inhibitor LY294002 (fig. S1G). Furthermore, phosphorylation of Bmi1 was inhibited by an Akt1-Akt2 dual inhibitor (Akti-1/2) (45), which blocks Akt phosphorylation and activation (Fig. 1E). Similarly, knockdown of Akt1 and Akt2 with small interfering RNAs (siRNAs) decreased phosphorylation of Bmi1 at Ser316 without affecting the overall abundance of Bmi1 (Fig. 1F). Because Akt2 depletion almost completely abrogated phosphorylation of Bmi1 (Fig. 1F), it appears that Akt2 is the major kinase that phosphorylates Bmi1 at Ser316 in these cells. Together, these results indicate that Akt1 and Akt2 phosphorylate Bmi1 at Ser316 both in vitro and in cells.
Fig. 1.
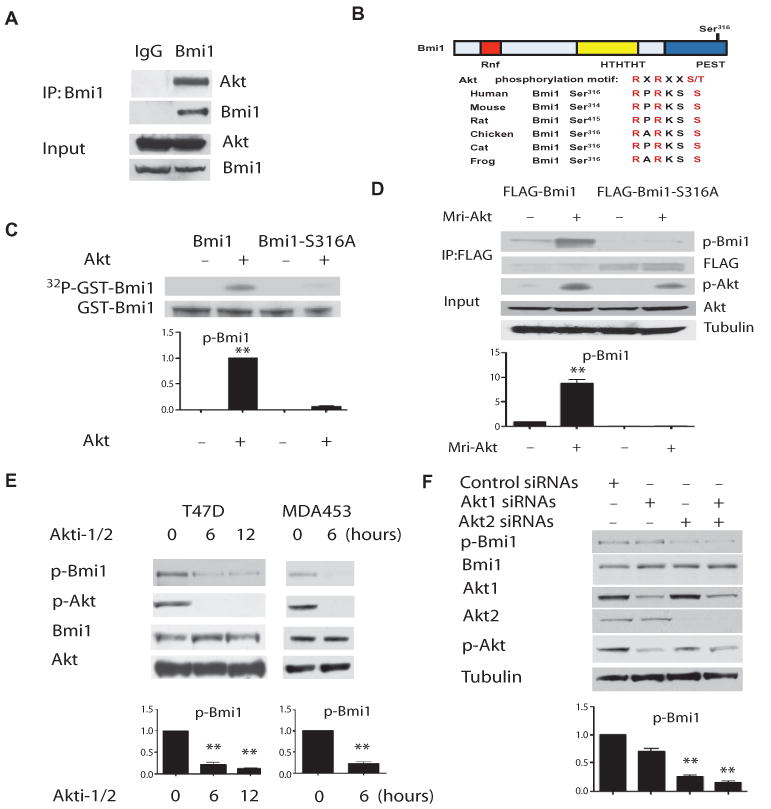
Akt phosphorylates Bmi1 at Ser316. (A) Bmi1 associates with endogenous Akt in HeLa cells, as detected by immunoprecipitation and Western blotting (n = 3 sets of cells). (B) A consensus Akt phosphorylation site in Bmi1 (Ser316, indicated in red) is conserved across species. (C) Wild-type (WT) Bmi1, but not Bmi1-S316A, is phosphorylated by recombinant active Akt in vitro. The graph shows the amount of phosphorylated Bmi1 normalized to total Bmi1 and relative to control (no Akt). **P < 0.001 compared with control (no Akt) by one-way analysis of variance (ANOVA) and Bonferroni post hoc test. (D) Bmi1, but not Bmi1-S316A, is phosphorylated by Akt (Mri-Akt) in cells. The graph shows the amount of phosphorylated Bmi1 normalized to total Bmi1 and relative to control (no Mri-Akt). **P < 0.001 compared with control (no Mri-Akt) by one-way ANOVA and Bonferroni post hoc test. (E) Endogenous Bmi1 is phosphorylated by Akt at Ser316 in cells. The graph shows the amount of phosphorylated Bmi1 (normalized to total Bmi1) relative to time 0. **P < 0.001 compared with time 0 by one-way ANOVA and Dunnett's post hoc test. (F) Knockdown of Akt1 and Akt2 decreases the phosphorylation of Bmi1 on Ser316. The graph shows the amount of phosphorylated Bmi1 normalized to total Bmi1 and relative to control siRNA sample. **P < 0.001 compared with control siRNA sample by one-way ANOVA and Bonferroni post hoc test. Data represent at least three independent experiments.
Phosphorylation of Bmi1 by Akt suppresses its effects on cell proliferation and senescence
To define the biological effects of Akt-mediated phosphorylation of Bmi1 at Ser316, we first examined cell senescence and proliferation. A biochemical marker of senescence is the appearance of an acidic, senescence-associated β-galactosidase (SA–β-Gal) activity (46). We used a β-Gal assay to access the senescence of MEFs and 5-bromo-2′-deoxyuridine (BrdU) incorporation to assess proliferation. Reexpression of wild-type Bmi1 (or the Bmi1-S316A phosphorylation–defective mutant) in Bmi1−/− cells prevented their premature senescence and restored their proliferative capacity (Fig. 2, A to C). In contrast, reexpression of the Bmi1-S316D phosphorylation mimetic mutant only modestly reduced senescence, with no effect on cell cycle or cell proliferation, demonstrating that phosphorylation at this residue impaired the function of Bmi1.
Fig. 2.
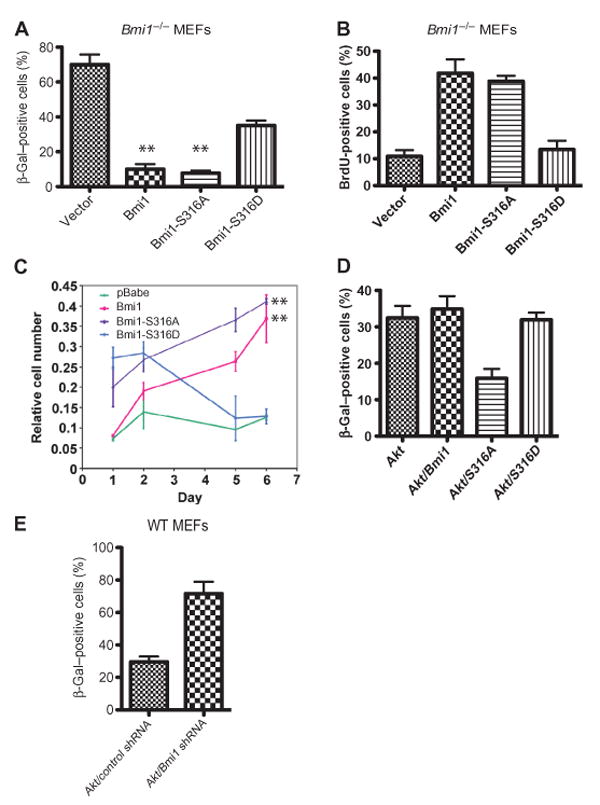
Phosphorylation of Bmi1 by Akt suppresses its effects on cell proliferation and senescence. (A) Premature senescence of Bmi1−/− MEFs is rescued by the WT Bmi1 and the Bmi1-S316A mutant but not by the Bmi1-S316D mutant. **P < 0.001 compared with pBabe-transduced MEFs by one-way ANOVA and Bonferroni post hoc test. (B) BrdU incorporation into passage 3 Bmi1−/− MEFs, infected at passage 1 with the indicated retroviruses. **P < 0.001compared with pBabe-transduced MEFs by one-way ANOVA and Bonferroni post hoc test. (C) The impaired proliferation of Bmi1−/− MEFs is rescued by WT Bmi1 and Bmi1-S316A but not byBmi1-S316D. **P < 0.001 compared with pBabe-transduced MEFs by two-way ANOVA. (D) Premature senescence of WT MEFs expressing activated Akt is rescued by the Bmi1-S316A mutant but not by the WT Bmi1 or the Bmi1-S316D mutant. **P < 0.001 compared to all other samples by one-way ANOVA and Bonferroni post hoc test. (E) Premature senescence of WT MEFs expressing activated Akt is enhanced by silencing Bmi1. P < 0.01 compared with control short hairpin RNA (shRNA) sample by t test. Data represent at least three independent experiments.
Similar to acute Pten loss, expression of an activated form of Akt (myristoylated Akt) in MEFs triggers growth arrest and cellular senescence (42). We reasoned that expressing the Bmi1-S316A mutant, but not the wild-type Bmi1 or the Bmi1-S316D mutant, in MEFs would antagonize this effect. Indeed, only the Bmi1-S316A mutant rescued the senescent phenotype (Fig. 2D); furthermore, senescence in cells expressing myristoylated Akt was enhanced by the knockdown of Bmi1 (Fig. 2E and fig. S2). Thus, our data suggest that Bmi1 is a critical downstream target of activated Akt in MEFs.
Phosphorylation of Bmi1 by Akt suppresses its ability to transform adherent cells
Bmi1 overexpression promotes fibroblast immortalization and, in combination with Myc, leads to neoplastic transformation (17, 47). To test the effect of phosphorylation of Bmi1 at Ser316 on tumor growth, we generated p53−/− MEFs that stably expressed the wild-type Bmi1 or the phosphorylation mimetic Bmi1-S316D protein together with Myc. Unexpectedly, colony formation in soft agar was similar for the p53−/− MEFs expressing Myc alone or Myc with wild-type Bmi1 or Bmi1-S316D; however, cells expressing Myc and Bmi1-S316A formed significantly higher numbers of colonies (Fig. 3A). In a nude mouse xenograft model to examine tumor growth in vivo, we did not observe tumor formation in mice injected with p53−/− MEFs expressing Myc alone or Myc with Bmi1-S316D. However, both wild-type Bmi1 and Bmi1-S316A cooperated with Myc to promote tumor growth (Fig. 3B). Bmi1 also cooperates with oncogenic Ras to transform wild-type MEFs (17), and we found that colony formation was increased for wild-type MEFs expressing oncogenic Ras (H-RasG12D) with Bmi1 or Bmi1-S316A, but not Bmi1-S316D (Fig. 3C).
Fig. 3.
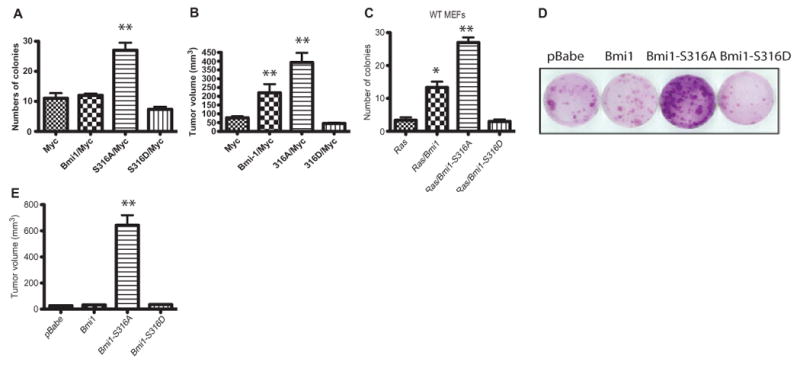
Phosphorylation of Bmi1 by Akt suppresses its effects on cellular transformation. (A) Soft agar transformation assay of p53−/− MEFs infected with WT Bmi1 or Bmi1 mutants in combination with Myc. A representative experiment performed as biological triplicates is shown along with SDs. **P < 0.001 compared to all other samples by one-way ANOVA and Bonferroni post hoc test. (B) WT Bmi1 and Bmi1-S316A mutant, but not Bmi1-S316D mutant, cooperate with Myc in the neoplastic transformation of p53−/− MEFs. **P < 0.001 compared to all other samples by one-way ANOVA and Bonferroni post hoc test. (C) Soft agar transformation assay of WT MEFs infected with the WT Bmi1 or the Bmi1-S316A mutant in combination with activated Ras (H-RasG12D). A representative experiment, performed as biological triplicates, is shown along with SDs. **P < 0.001 compared to all other samples by one-way ANOVA and Bonferroni post hoc test. (D) Bmi1-S316A mutant enhances focus formation by p53−/− MEFs. (E) Bmi1-S316A mutant promotes the growth of tumors formed from p53−/− MEFs in nude mice. **P < 0.001 compared to all other samples by one-way ANOVA and Bonferroni post hoc test. Data represent at least three independent experiments.
We also examined whether expression of the Bmi1-S316A mutant alone could promote tumor growth in vitro and in vivo. Overexpression of Bmi1-S316A, but not wild-type Bmi1 or Bmi1-S316D, enhanced the focus formation of p53−/− MEFs (Fig. 3D). In athymic nude mice subcutaneously injected with p53−/− MEFs that expressed wild-type or mutant Bmi1, tumor growth was potently increased by the Bmi1-S316A mutant but not by the wild-type Bmi1 or Bmi1-S316D (Fig. 3E and fig. S3, A and B). Thus, phosphorylation of Ser316 significantly impaired the ability of Bmi1 to promote tumor formation and growth; the Bmi1-S316A mutant not only was unaffected by Akt signaling but also acquired tumor-promoting properties.
Having established the role of Akt-mediated Bmi1 phosphorylation in regulating cell proliferation and tumor development in these model systems, we examined whether we could detect phosphorylation of Ser316 in Bmi1 in vivo. Because Bmi1 cooperates with Myc to promote B and T cell lymphomagenesis (9, 10, 47), we examined the phosphorylation of Bmi1 in a series of human diffuse large B cell lymphoma tissues by immunostaining. We detected phosphorylated Bmi1 in normal lymph node tissue and in many of the human lymphoma samples analyzed (fig. S4A). In this small data set, lower amounts of phosphorylation of Bmi1 correlated with worse survival (fig. S4B), which suggests that staining for phosphorylated Bmi1 should be further examined in larger cohorts as a potential clinical prognostic marker for patients with diffuse large B cell lymphoma. To demonstrate that the phosphorylation-specific Bmi1 antibody recognizes phosphorylated Bmi1 in cells, we treated T47D cells with the Akt inhibitor Akti-1/2 and found decreased phosphorylation of Bmi1 (fig. S4C).
Akt-mediated phosphorylation of Bmi1 inhibits self-renewal of hematopoietic progenitor cells
The PI3K-PTEN-Akt signaling pathway has been implicated in regulating self-renewal of hematopoietic stem cells (48–50). Pten-deficient hematopoietic stem cells engraft normally in recipient mice but are unable to sustain long-term multilineage hematopoietic reconstitution (48, 49). To define how Akt-mediated phosphorylation of Bmi1 affects hematopoietic stem and progenitor cell function, we reintroduced both wild-type and phosphorylation-deficient mutant forms of Bmi1 (Bmi1-S316A) into wild-type and Bmi1−/− fetal liver cells using retroviruses and plated green fluorescent protein (GFP)–positive cells weekly in methylcellulose-based colony-forming unit (CFU) assays. The serial replating assay assesses the preservation of “stemness” in the stem and progenitor cell compartment and correlates with in vivo self-renewal capability (51). Overexpressing either the wild-type Bmi1 or the S316A mutant enhanced the serial replating potential of wild-type and Bmi1−/minus; fetal liver cells (Fig. 4, A and B). At week 3, hematopoietic cells expressing the Bmi1-S316A mutant formed more colonies than cells expressing wild-type Bmi1, indicating that S316A mutation conferred gain of function in Bmi1 and that Akt-mediated phosphorylation of Bmi1 inhibits the self-renewal potential of hematopoietic progenitor cells (Fig. 4, A and B).
Fig. 4.
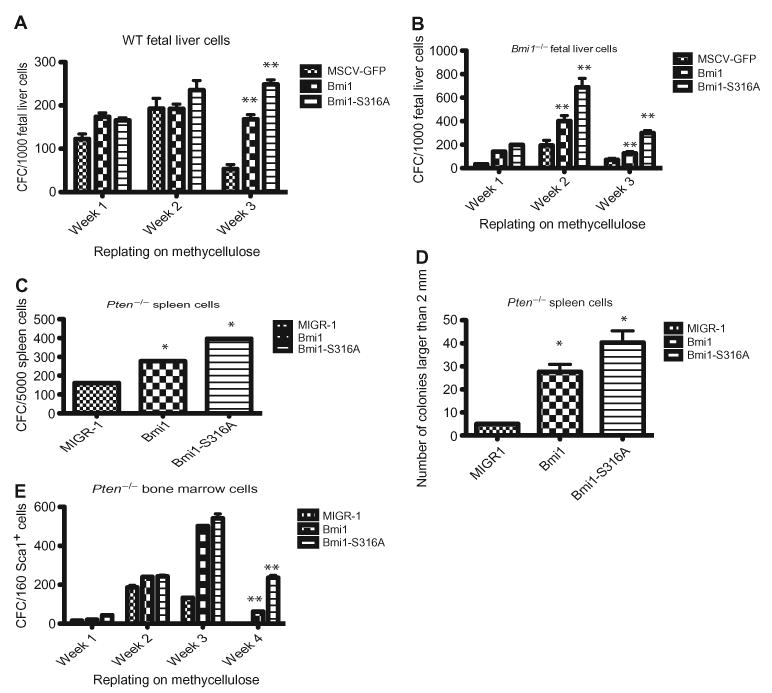
Akt-mediated phosphorylation of Bmi1 inhibits hematopoietic progenitor cell self-renewal. (A) Myeloid progenitors were quantified by methycellulose culture using WT fetal liver cells transduced with retroviruses expressing the WT or the Bmi1-S316A mutant. **P < 0.001 compared with murine stem cell virus (MSCV)–GFP–transduced fetal liver cells by two-way ANOVA. (B) Myeloid progenitors were quantified by methycellulose culture using Bmi1−/− fetal liver cells transduced with retroviruses expressing the WT or the Bmi1-S316A mutant.Mean values (±SD) are shown (n = 3 independent experiments). **P < 0.001 compared with MSCVGFP– transduced fetal liver cells by two-way ANOVA. (C)Pten−/− spleen cells were transduced with retroviruses expressing the WT or the S316A mutant form of Bmi1. Data are means ± SD (n = 3 independent experiments). *P < 0.01 compared with MIGR1- transduced spleen cells by one-way ANOVA and Bonferroni post hoc test. (D) The size of themyeloid colonies formed in (C) was measured. Data are means ± SD (n = 3 independent experiments). *P < 0.01 compared with MIGR1-transduced spleen cells by one-way ANOVA and Bonferroni post hoc test. (E) Myeloid progenitors were quantified by methycellulose culture using Pten−/− fetal liver cells transduced with retroviruses expressing the WT or the S316A mutant form of Bmi1.Mean values (±SD) are shown (n=3 independent experiments). **P < 0.001 compared with MIGR1-transduced bone marrow cells by two-way ANOVA. Data represent at least three independent experiments.
To examine whether Bmi1 is critical to the ability of Akt to limit hematopoietic cell self-renewal, we reintroduced both the wild-type and the S316A mutant forms of Bmi1 into Pten−/− spleen cells using retroviruses and plated GFP-positive cells in CFU assays. Expression of Bmi1-S316A rescued the growth arrest defect of Pten−/− hematopoietic cells, leading to increased colony formation compared to expression of wild-type Bmi1 (Fig. 4C). In addition, overexpressing either the wild-type or the S316A mutant form of Bmi1 in Pten−/− spleen cells significantly increased the size of the colonies generated (Fig. 4D). Transduction of primitive (for example, Lin−Sca1+) Pten−/− bone marrow cells with retroviruses expressing the S316A mutant rescued the growth arrest defect of Pten−/− hematopoietic cells more efficiently than that of wild-type Bmi1 in serial replating assays (Fig. 4E). Thus, Bmi1 is a critical downstream target of Akt phosphorylation in hematopoietic stem cells.
The PI3K-Akt signaling pathway inhibits ubiquitination of H2A
The covalent modification of histones plays a key role in regulating chromatin dynamics (52, 53). Ubiquitination occurs mainly on histones H2A and H2B (5, 6, 54), and Bmi1 promotes ubiquitination of H2A (6, 7). First, we confirmed that Bmi1−/− MEFs showed reduced ubiquination of H2A (Fig. 5A). We next examined whether PI3K-Akt signaling inhibits ubiquitination of H2A. Expression of the wild-type Bmi1 and the Bmi1-S316A mutant, but not the Bmi1-S316D mutant, enhanced the ubiquitination of histone H2A in U2OS cells (Fig. 5B). Consistent with this result, global histone H2A ubiquitination was significantly increased by treatment of U2OS cells with Akti-1/2 to inhibit Akt1 and Akt2 (Fig. 5C) or by knockdown of Akt1 and Akt2 with siRNAs (Fig. 5D). We also observed increased H3K27 trimethylation (H3K27me3) (Fig. 5, C and D), consistent with the ability of Akt signaling to inhibit H3K27 trimethylation (55).
Fig. 5.
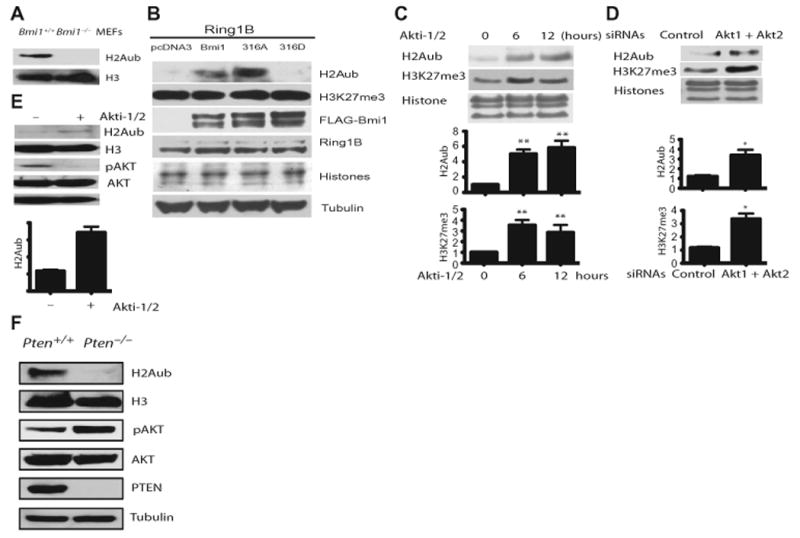
PI3K-Akt signaling pathway inhibits H2A ubiquitination. (A) Western blot analysis of H2A ubiquitination in WT and Bmi1−/−MEFs. (B) Western blot analysis of the ubiquitination of histone H2A in U2OS cells transfected with Ring1B and either an empty vector or a vector expressing the WT Bmi1 or the Bmi1 mutant proteins (n = 3 independent experiments). (C) Akt inhibits H2A ubiquitination. The top graph shows the amount of ubiquitinated H2A normalized to total H2A and relative to time 0. The bottom graph shows the amount of H3K27me3 normalized to total H3K27 and relative to time 0. **P < 0.001 compared with time 0 by one-way ANOVA and Dunnett's post hoc test. (D)Western blot analysis of histone H2A ubiquitination and H3K27me3 amounts in T47D cells transfected with control siRNA or Akt1 and Akt2 siRNAs shows increased H2A ubiquitination. The top graph shows the amount of ubiquitinated H2A normalized to total H2A and relative to control siRNA sample. The bottom graph shows the amount of H3K27me3 normalized to total H3K27 and relative to control siRNA sample. Unpaired t test, *P < 0.01. n = 3 independent experiments. (E) Western blot analysis of ubiquitination of histone H2A in WT MEF cells treated with Akti-1/2 shows increased H2A ubiquitination at 12 hours. The graph shows the amount of ubiquitinated H2A normalized to total H2A and relative to control sample (no Akti-1/2). Unpaired t test, **P < 0.001. n = 3 independent experiments. (F) Western blot analysis of H2A ubiquitination in WT and Pten−/− MEFs. Data represent at least three independent experiments.
To substantiate the above observations in primary cells (wild-type MEFs), we inhibited the enzymatic activities of Akt1 and Akt2 with Akti-1/2, which significantly increased global histone H2A ubiquitination (Fig. 5E). MEFs lacking PTEN showed decreased ubiquitination of H2A (Fig. 5F). Thus, Akt-mediated phosphorylation of Bmi1 inhibits H2A ubiquitination in cells.
PI3K/Akt signaling inhibits the association of Bmi1 with the Ink4a-Arf locus
To investigate how Akt-mediated phosphorylation of Bmi1 affects its biological functions, we examined whether PI3K-Akt signaling affects the formation of the PRC1 complex. We found that Ring1B, Ring1A, and M33 associated normally with the wild-type and mutant forms of Bmi1 in coimmunoprecipitation assays (fig. S5). Moreover, PI3K-Akt signaling does not appear to disrupt the PRC1 complex itself or the nuclear localization of Bmi1 (fig. S6A).
Bmi1 is a potent inhibitor of the Ink4a-Arf locus (17), so we tested the ability of the wild-type and the mutant Bmi1 proteins to repress this locus and affect the abundance of p16 and p19. Expression of either wild-type Bmi1 or Bmi1-S316A mutant, but not the Bmi1-S316D mutant, markedly reduced p16Ink4a and p19Arf protein abundance in p53−/− MEFs (Fig. 6A). Similarly, reexpression of wild-type Bmi1 or Bmi1-S316A phosphorylation–defective mutant, but not the Bmi1-S316D phosphorylation mimetic mutant, returned the abundance of p16Ink4a and p19Arf to normal in Bmi1−/− cells (Fig. 6B). In wild-type MEFs, insulin-like growth factor (IGF) impaired the ability of wild-type Bmi1, but not Bmi1-S316A, to decrease the abundance of p16 and p19 (fig. S6B), and overexpression of constitutively active Akt increased the abundance of Ink4a and Arf (Fig. 6C). In Bmi1−/− MEFs, reexpression of the wild-type Bmi1 or the Bmi1-S316A mutant, but not the Bmi1-S316D mutant, markedly reduced the abundance of Ink4a and Arf (Fig. 6D).
Fig. 6.
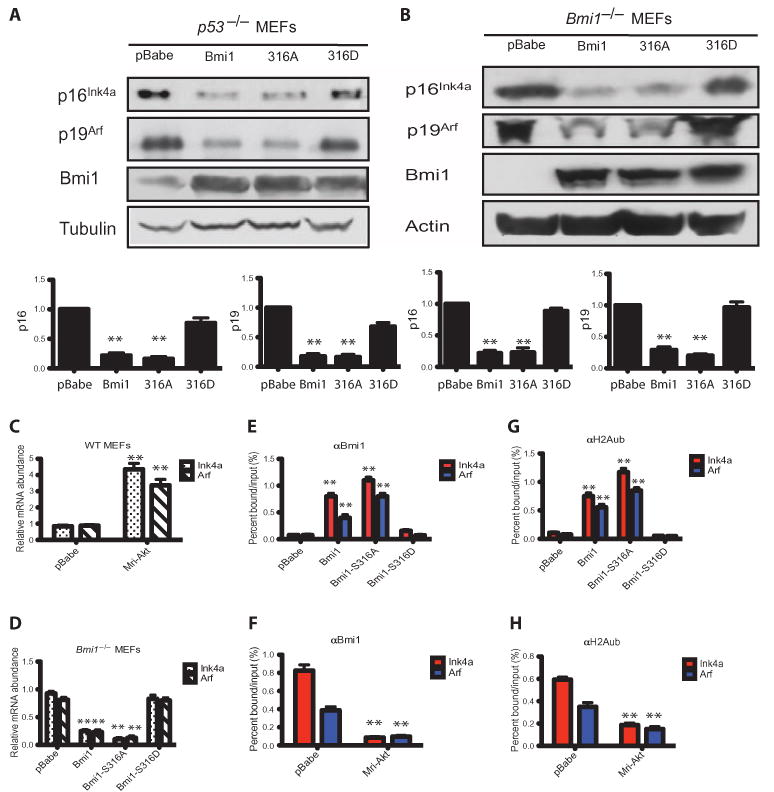
PI3K-Akt signaling inhibits the association of Bmi1 with the Ink4a-Arf locus. (A) WT Bmi1 and Bmi1-S316A mutant, but not Bmi1-S316D mutant, decrease the abundance of p16Ink4a and p19Arf in p53−/− MEFs. The graph shows the amount of p16 or p19 normalized to tubulin and relative to pBabe-transduced MEFs. **P < 0.001 compared with pBabe-transduced MEFs by one-way ANOVA and Bonferroni post hoc test. n = 3 independent experiments. (B) The increased abundance of p16Ink4a and p19Arf proteins in Bmi1−/− MEFs is rescued by expression of the WT Bmi1 and the Bmi1-S316A mutant but not by the Bmi1-S316D mutant. The graph shows the amount of p16 or p19 normalized to tubulin and relative to pBabe-transduced MEFs. **P < 0.001 compared with pBabe-transduced MEFs by one-way ANOVA and Bonferroni post hoc test. n = 3 independent experiments. (C) Quantitative reverse transcription polymerase chain reaction (qRT-PCR) analysis of Ink4a and Arf mRNA abundance in WT MEFs expressing constitutively active Akt. **P < 0.001 compared with pBabe-transduced MEFs by one-way ANOVA and Bonferroni post hoc test. n = 3 independent experiments. (D) qRT-PCR analysis of Ink4a and Arf mRNA abundance in cells from (B). **P < 0.001 compared with pBabe-transduced MEFs by one-way ANOVA and Bonferroni post hoc test. n = 3 independent experiments. (E) ChIP analysis of the Ink4a-Arf locus using an anti-Bmi1 antibody and cells from (B). **P < 0.001 compared with pBabe-transduced MEFs by one-way ANOVA and Bonferroni post hoc test. n = 3 independent experiments. (F) ChIP analysis of the Ink4a-Arf locus using an anti-Bmi1 antibody and cells from (C). **P < 0.001 compared with pBabe-transduced MEFs by two-way ANOVA. n = 3 independent experiments. (G) ChIP analysis of the Ink4a-Arf locus using an anti-H2Aub antibody and cells from (B). **P < 0.001 compared with pBabe-transduced MEFs by two-way ANOVA. n = 3 independent experiments. (H) ChIP analysis of the Ink4a-Arf locus using an anti-H2Aub antibody and cells from (C). **P < 0.001 compared with pBabe-transduced MEFs by two-way ANOVA. n = 3 independent experiments.
We investigated whether Akt-mediated phosphorylation affects the ability of Bmi1 to bind chromatin across the Ink4a-Arf locus in MEFs (56). Using chromatin immunoprecipitation (ChIP) assays and reconstituted Bmi1−/− MEFs, we found that the wild-type Bmi1 and the Bmi1-S316A mutant, but not the Bmi1-S316D mutant, bound to the Ink4a-Arf locus (Fig. 6E). Furthermore, overexpressing constitutively active Akt decreased the association of Bmi1 with the Ink4a-Arf locus in wild-type MEFs (Fig. 6F). We also found increased binding of Ring1B to the Ink4a-Arf locus in p53−/− MEFs expressing wild-type Bmi1 or the Bmi1-S316A mutant (fig. S7A), as well as increased ubiquitination of H2A on the Ink4a and Arf promoters, an effect not seen with the Bmi1-S316D mutant (Fig. 6G). Overexpressing constitutively active Akt also decreased the ubiquitination of H2A on the Ink4a and Arf promoters (Fig. 6H). In contrast, overexpressing constitutively active Akt in wild-type MEFs, but not wild-type or mutant forms of Bmi1 in Bmi1−/− MEFs, affected the amount of H3K27me3 (fig. S7, B and C). Thus, Akt-mediated phosphorylation of Bmi1 on Ser316 leads to its dissociation from chromatin and to derepression of the Ink4a-Arf locus.
Discussion
The PI3K-Akt signaling pathway regulates cell survival, growth, metabolism, and migration (39–41). Although the PI3K-Akt pathway is vital to the growth and survival of cancer cells, acute activation of this pathway in normal stem cells can lead to senescence or depletion of the stem cell pool, suggesting that this pathway is tightly regulated during the life of the cell (42, 48–50). Here, we show that the PI3K-Akt signaling pathway can fine-tune cell growth by inhibiting the biological functions of the PcG protein Bmi1 through phosphorylation of Ser316.
Oncogene-induced senescence is an important barrier to tumorigenesis (57, 58), and Bmi suppresses the expression of Ink4a-Arf locus, which encodes two tumor suppressors that are key regulators of senescence (p16Ink4a and p19Arf) (17). Oncogenic tyrosine kinases and acute Pten loss trigger premature senescence and the accumulation of p16Ink4a and p19Arf in MEFs (42, 43). This could involve the phosphorylation of Bmi1 by Akt because Bmi1 dissociates from the Ink4a-Arf locus in senescent cells (56) and in cells where it is phosphorylated by Akt at Ser316 (Fig. 6). Our study provides a mechanism for this finding and for the increased abundance of p16Ink4a and p19Arf in cancer cells that have activated PI3K-Akt signaling (Fig. 7).
Fig. 7.
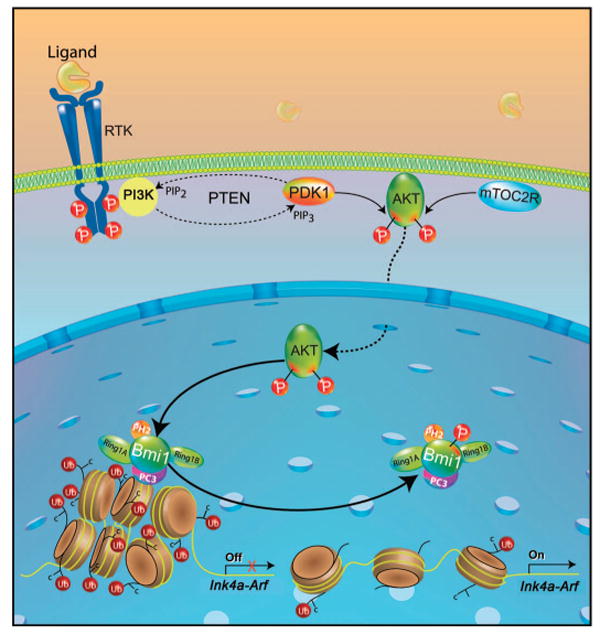
Bmi1 basally associates with chromatin and maintains the Ink4a-Arf locus in a silenced state. In response to PI3K-Akt signaling, Akt phosphorylates Bmi1 on Ser316, leading to its dissociation from chromatin and to derepression of the Ink4a-Arf locus. RTK, receptor tyrosine kinase.
Phosphorylation of Bmi1 by Akt suppresses its ability to cooperate with Myc in cellular transformation (Fig. 3, A and B). Neither the wild-type Bmi1 nor the Bmi1-S316D mutant can transform p53−/− MEFs by themselves, so the ability of the Bmi1-S316A mutant to transform these cells indicates a gain of function and suggests that certain types of Bmi1 mutations (or splice variant forms that eliminate the phosphorylation site) could facilitate the transformation of human cells.
The Bmi1-containing PRC1 complex recognizes the histone H3K27 trimethyl mark through the chromodomain of the Polycomb protein, and this interaction helps guide PRC1 to its appropriate genomic locations (5, 59). The PI3K-Akt signaling pathway inhibits the association of Bmi1 with the Ink4a-Arf locus (Fig. 6) and trimethylation of H3K27 (55) (Fig. 5D); thus, it is possible that the dissociation of phosphorylated Bmi1 from chromatin may also relate to decreased trimethylation of H3K27. However, recent studies challenge the hierarchical recruitment model (in which PRC2 modifies the chromatin and PRC1 later binds to the histone mark laid down by PRC2), and PRC1 can bind nucleosome arrays even if the N-terminal histone tails are removed by tryptic digestion (60). Although Bmi1 colocalizes with methylated H3K27 in early S phase, the transient activity of the PRC2 complex during early S phase cannot explain the stable association of Bmi1 with chromatin throughout the cell cycle. This suggests that other mechanisms are involved in maintaining the PRC1 complex on heterochromatin during the various phases of the cell cycle (37). Although Akt signaling affects the localization of the PRC1 complex, we did not find disruption of the PRC1 complex after phosphorylation of Bmi1. Thus, Akt can inhibit the activities of the PRC2 and PRC1 complexes in the cell.
There is extensive communication between histone modifications and histone binding proteins. H2A ubiquitination is important for PRC1-mediated gene repression (5) because it limits full access of the basic transcriptional machinery or chromatin remodeling factors to the chromatin (27, 61, 62). Akt-mediated phosphorylation of Bmi1 inhibits ubiquitination of H2A, whereas phosphorylation of the Bmi1 homolog Mel18 by an unknown serine-threonine–directed kinase at a non-Akt consensus site actually targets it to chromatin and enhances ubiquitination of H2A (63). Kinases other than Akt, such as MAPKs, can also inhibit the association of Bmi1 with chromatin, presumably in response to extracellular cues (38). Furthermore, Bmi1 is also phosphorylated in a cell cycle–dependent manner: It is hypophosphorylated and chromatin-bound during G1-S and hyperphosphorylated and dissociated from chromatin during G2-M (36). The Bmi1 C terminus, which contains a proline, glutamate, serine, and threonine (PEST) domain (serine-proline–rich), may be subjected to multiple post-translational modifications (9, 10).
The PI3K-PTEN-Akt pathway and Bmi1 have been implicated in the self-renewal of hematopoietic stem cells (48–50); however, the downstream targets of this pathway and the upstream signaling pathway that regulates Bmi1 function in hematopoietic stem cells have not been identified. We demonstrated that Bmi1 is a critical downstream target of PI3K-Akt signaling in hematopoietic stem cells and that Akt-mediated phosphorylation of Bmi1 inhibits its ability to promote the self-renewal of hematopoietic stem and progenitor cells (Fig. 4). Our discoveries are consistent with a report from the Morrison lab that showed increased abundance of both Ink4a and Arf after the deletion of PTEN in hematopoietic stem cells (64). This could explain the limited self-renewal of the multipotent progenitor cell compartment, where Akt is active, compared to the stem cell compartment, where it is not.
The van Lohuizen group has reported that Akt-mediated phosphorylation of Bmi1 enhances its oncogenic potential in an Ink4a- and Arf-independent mouse model of human prostate cancer (65). They identified three sites of serine phosphorylation [Ser251, Ser253, and Ser255 (SDSGS)], which are not consensus Akt phosphorylation site (RXRXXS or T) (40, 41), but did not use a phosphorylation-specific antibody to demonstrate that Akt phosphorylates these residues in cells (65). Nonetheless, their data do suggest that the inhibition of cell proliferation and oncogenesis by Akt-mediated phosphorylation of Bmi1 occurs in a context-dependent manner.
Akt is activated by oncogenic tyrosine kinases and by loss of the PTEN phosphatase. The PTEN tumor suppressor gene is commonly mutated or deleted in human malignancies, including acute leukemia and prostate cancer (66, 67), whereas PI3K-Akt signaling is not active in hematopoietic stem cells (48–50, 68). This suggests that the inhibitory effects of Akt on Bmi1 function could have therapeutic implications. Phosphorylation (and inactivation) of Bmi1 by Akt could limit hematopoietic stem cell self-renewal, and superactivation of Akt signaling could potentially extinguish the cancer stem cell pool.
Materials and Methods
Plasmids, antibodies, and chemicals
Mutant constructs of Bmi1 were generated with a QuikChange site-directed mutagenesis kit (Stratagene). Wild-type or mutant forms of the Bmi1 complementary DNA (cDNA) were subcloned into the pBabe puromycin retroviral vector, whereas the Myc cDNA was subcloned into the pBabe hygromycin vector. The antibodies used in this study were anti-FLAG (Sigma); anti-hemagglutinin (Covance); anti-Bmi1 (Millipore); and anti– phospho-Akt, anti-Akt, and anti-H2Aub (Cell Signaling Technology). The Ring1B monoclonal antibody was provided by H. Koseki. LY294002 was from Calbiochem. IGF, Polybrene, and puromycin were purchased from Sigma. The Akti-1/2 inhibitor (45) was obtained from Merck.
Mice, cell culture, and transfections
Bmi1-deficient mice were provided by M. van Lohuizen (The Netherlands Cancer Institute, the Netherlands). MEF cells from wild-type and Bmi1−/− mice were prepared as described (42). HEK293T and HeLa cell lines were from the American Type Culture Collection. All other cells were maintained in Dulbecco's modified Eagle's medium (DMEM). Transfections were performed with the Lipofectamine 2000 Reagent (Invitrogen) according to the manufacturer's instructions. Cells were incubated with IGF (20 ng/ml) before treatment with LY294002 (20 μM).
Infection of MEFs by retroviruses
The Phoenix E packaging cells were transfected with the empty pBabe vector or the same vector containing the Bmi1 or the Myc cDNA with Lipofectamine 2000. Seventy-two hours after transfection, the retroviral supernatants were collected and filtered through a 0.45-μm filter and used for infections: 3 ml of freshly made retroviral supernatants containing Polybrene (4 μg/ml) was added to exponentially growing cells for each 10-cm-diameter plate culture. After 3 hours, 7 ml of fresh medium was added. Normally, three rounds of infections were performed at 6-hour intervals. Cells were selected with the appropriate antibiotics 72 hours after infection.
Senescence analysis
To determine senescence, we plated MEFs at 104 cells per well of a six-well plate in triplicate, and after 4 days, we quantified SA–β-Gal activity (more than 200 cells per sample) using the senescence detection kit (Cell Signaling Technology).
RNA interference
SMARTpool Akt1 and Akt2 (Dharmacon) represent pooled SMART-selected siRNA duplexes that target Akt1 and Akt2, respectively. T47D cells were transfected with SMARTpool Akt1 alone, Akt2 alone, both Akt1 and Akt2, or nonspecific control pool with the Oligofectamine reagent (Invitrogen) according to the manufacturer's instructions. In brief, siRNA (at a final concentration of 200 nM) was used to transfect cells at 40 to 50% confluency. Cells were harvested 48 hours after siRNA transfection.
Generation of a phospho(Ser316)-specific anti-Bmi1 antibody
A Bmi1 phospho(Ser316) peptide (SFANRPRKSSPVNGS) was synthesized and injected into rabbits. Antiserum was obtained and affinity-purified according to the manufacturer's procedures (Genemed Synthesis Inc.). For Western blot analysis, the Bmi1 phospho(Ser316) antibody was preincubated with the Bmi1 nonphosphorylated peptide (SFANRPRKSSVNGS) [5:1 (peptide/antibody), w/w] overnight at 4°C before it was added to the polyvinylidene difluoride membrane.
Immunoblotting and immunoprecipitation
Cells were harvested in radioimmunoprecipitation assay (RIPA) lysis buffer [150 mM NaCl, 10 mM tris (pH 7.5), 1% NP-40, 1% deoxycholate, 0.1% SDS, protease inhibitor cocktail (Roche), and phosphatase inhibitor cocktail (Sigma)] or, in case of coimmunoprecipitation, in E1A lysis buffer [250 mM NaCl, 50 mM Hepes (pH 7.5), 0.1% NP-40, 5 mM EDTA, protease inhibitor cocktail (Roche), and phosphatase inhibitor cocktail (Sigma)]. For immunoprecipitations, lysates were precleared with immunoglobulin G (IgG) and then incubated with the precipitating antibody overnight, followed by 1 hour of incubation with protein A/G beads (Santa Cruz). Immune complexes were then washed three times in lysis buffer and boiled in gel loading buffer. Proteins from total cell lysates or immunoprecipitates were resolved by SDS–polyacrylamide gel electrophoresis (SDS-PAGE), transferred to nitrocellulose membrane, blocked in 5% non-fat milk or bovine serum albumin, and blotted with the appropriate antibody.
In vitro and cellular phosphorylation assays
In vitro phosphorylation assays were performed as described previously (69). In brief, purified glutathione S-transferase (GST)–Bmi1 or GST–Bmi1-S316A protein was incubated with 1 μl of purified active Akt1 kinase (Cell Signaling Technology) and 2 μCi of [γ-32P]ATP (adenosine 5′-triphosphate) in 50 μl of kinase buffer [25 mM Hepes, 10 mM magnesium acetate, and 50 μM ATP (pH 7.5)] for 30 min at 30°C. Reactions were stopped by boiling in gel loading buffer. Proteins were resolved by 10% SDS-PAGE and transferred to nitrocellulose membranes; 32P incorporation was detected by autoradiography. For the cellular labeling experiments, 293T cells cultured in DMEM containing 10% fetal bovine serum (FBS) were transfected with the indicated plasmids for 24 hours, and the medium was changed to phospho-free DMEM with 0.25% dialyzed FBS containing ortho-32P (200 μCi/ml) for 4 hours. Cells were lysed by RIPA buffer for immunoprecipitation, and the Bmi1 immunocomplex was subjected to 10% SDS-PAGE, followed by autoradiography.
Proliferation and soft agar assays
Retrovirally infected cells were selected in puromycin [2 μg/ml; plus hygromycin (75 μg/ml) in the case of double infection] for 3 days. Cell growth rates were determined, as previously published (42). For the soft agar transformation assay, 5 × 10⁴ cells were placed in 1.5 ml of DMEM with 10% FBS and 0.3% agarose and overlaid onto 3 ml of DMEM with 10% FBS and 0.6% agarose in each well of a six-well plate. After 2 to 3 weeks, colonies larger than 3 mm in diameter were counted.
In vivo tumorigenesis
Retrovirally infected p53−/− MEFs were selected in puromycin (2 μg/ml) for 3 days. Cells (1 × 10⁶) were resuspended in DMEM and injected subcutaneously into the right flank of 6-week-old athymic nude mice (NCRNU-M, Taconic Farms Inc.). Tumor size was measured weekly with a caliper, and tumor volume was determined with the following standard formula: L × W2 × 0.52, where L is the longest diameter and W is the shortest diameter.
Immunohistochemical staining
For immunohistochemistry, each tumor sample was stained with specific antibodies as indicated and scored by an H-score method that combines the values of immunoreaction intensity and the percentage of tumor cell staining. Briefly, tissue sections were incubated with anti–Akt-phospho(Ser473), anti–phospho-Bmi1, and anti-Ki67 antibodies. Sections were treated with biotin-conjugated secondary antibody followed by avidin-biotin-peroxidase complex and aminoethyl carbazole chromogen. Two-sided log-rank analysis was used to assess statistical significance. Standard avidin-biotin-peroxidase complex techniques were used for immunohistochemistry performed on 5-μm paraffin sections of formalin-fixed, paraffin-embedded tissue. Antigen retrieval and staining were performed with the Ventana Discovery XT automated immunostainer (Ventana Medical Systems) according to the manufacturer's protocol. Sections were stained with a 1:1000 dilution of the phospho-BMI1 antibody and visualized with the diaminobenzidine chromogen. The resulting slides were scanned with the ScanScope CS (Aperio) with brightfield imaging at ×200 magnification. Slide images were analyzed with the positive pixel algorithm (Aperio). Briefly, brown (3,3-diaminiobenzidine) and blue (hematoxylin) colors were separated spectrally. The intensity of the brown staining is then quantified. The median intensity value was determined for all cases. “Low” intensity is defined as less than median, with “high” being greater than the median intensity value. The association between discrete variables was tested with the χ2 test.
Hematopoietic stem and progenitor cell assays
To perform serial replating assays, myeloid progenitors were quantified with methycellulose-based cultures (MethoCult GF M3434, StemCell Technologies) and spleen cells, bone marrow cells, or fetal liver cells were transduced with retroviruses expressing either the wild-type or the S316 A mutant form of Bmi1 (51). Clonogenic progenitors were enumerated after 7 days. The methycellulose cultures were also serially replated, weekly, for 3 to 4 weeks.
Statistical analysis
All data shown from representative experiments were repeated at least three times. The precise statistical test used is specified in the relevant figure legends.
Supplementary Material
Acknowledgments
We thank the staff of the Molecular Cytology, Genetically Engineered Mouse Phenotyping, Antitumor Assessment, and Mouse Genotyping Core Facilities in Memorial Sloan-Kettering Cancer Center. We are grateful to M. van Lohuizen and H. Koseki for providing the Bmi1-deficient mice and the anti-Ring1B monoclonal antibody, respectively.
Funding: This work was funded by NIH RO1 grant (DK52208 to S.D.N.), Leukemia & Lymphoma Society Marshall A. Lichtman Specialized Center of Research grant (P.P.P. and S.D.N.), and Indiana University School of Medicine Biomedical Research Grant (Y.L.).
Footnotes
Author contributions: Y.L., N.R., P.P.P., and S.D.N. designed the research; Y.L., F.L., H.Y., X.Z., G.S., A.D., M.H., Q.-B.S., Z.C., H.-K.L., S.D.G., S.E.E., Y.Y., Y.M., G.H., S.M., I.K.M., and C.V.H. performed the research; Y.L., F.L., H.Y., X.Z., G.S., A.D., M.H., Q.-B.S., Z.C., H.-K.L., S.D.G., S.E.E., Y.Y., Y.M., G.H., S.M., I.K.M., and C.V.H. analyzed the data and performed the biostatistical analysis; and Y.L. and S.D.N. wrote the manuscript.
Competing interests: The authors declare that they have no competing interests.
www.sciencesignaling.org/cgi/content/full/5/247/ra77/DC1
Fig. S1. Akt phosphorylates Bmi1 in cells.
Fig. S2. Knockdown of Bmi1 in wild-type MEFs with RNA interference.
Fig. S3. The Bmi1-S316A mutant enhances tumor formation in nude mice.
Fig. S4. Phosphorylated Bmi1 is detectable in human diffuse large B cell lymphoma samples.
Fig. S5. The PI3K-Akt signaling pathway does not affect PRC1 complex formation.
Fig. S6. Subcellular localization of Bmi1 in U2OS cells after serum or IGF exposure.
Fig. S7. ChIP assays of the Ink4a-Arf locus in MEFs.
Contributor Information
Yan Liu, Email: liu219@iupui.edu.
Stephen D. Nimer, Email: snimer@med.miami.edu.
References and notes
- 1.Valk-Lingbeek ME, Bruggeman SW, van Lohuizen M. Stem cells and cancer: The Polycomb connection. Cell. 2004;118:409–418. doi: 10.1016/j.cell.2004.08.005. [DOI] [PubMed] [Google Scholar]
- 2.Sparmann A, van Lohuizen M. Polycomb silencers control cell fate, development and cancer. Nat Rev Cancer. 2006;6:846–856. doi: 10.1038/nrc1991. [DOI] [PubMed] [Google Scholar]
- 3.Pietersen AM, van Lohuizen M. Stem cell regulation by polycomb repressors: Postponing commitment. Curr Opin Cell Biol. 2008;20:201–207. doi: 10.1016/j.ceb.2008.01.004. [DOI] [PubMed] [Google Scholar]
- 4.Cao R, Wang L, Wang H, Xia L, Erdjument-Bromage H, Tempst P, Jones RS, Zhang Y. Role of histone H3 lysine 27 methylation in Polycomb-group silencing. Science. 2002;298:1039–1043. doi: 10.1126/science.1076997. [DOI] [PubMed] [Google Scholar]
- 5.Wang H, Wang L, Erdjument-Bromage H, Vidal M, Tempst P, Jones RS, Zhang Y. Role of histone H2A ubiquitination in Polycomb silencing. Nature. 2004;431:873–878. doi: 10.1038/nature02985. [DOI] [PubMed] [Google Scholar]
- 6.Cao R, Tsukada Y, Zhang Y. Role of Bmi-1 and Ring1A in H2A ubiquitylation and Hox gene silencing. Mol Cell. 2005;20:845–854. doi: 10.1016/j.molcel.2005.12.002. [DOI] [PubMed] [Google Scholar]
- 7.Buchwald G, van der Stoop P, Weichenrieder O, Perrakis A, van Lohuizen M, Sixma TK. Structure and E3-ligase activity of the Ring–Ring complex of Polycomb proteins Bmi1 and Ring1b. EMBO J. 2006;25:2465–2474. doi: 10.1038/sj.emboj.7601144. [DOI] [PMC free article] [PubMed] [Google Scholar]
- 8.Vissers JH, Nicassio F, van Lohuizen M, Di Fiore PP, Citterio E. The many faces of ubiquitinated histone H2A: Insights from the DUBs. Cell Div. 2008;3:8. doi: 10.1186/1747-1028-3-8. [DOI] [PMC free article] [PubMed] [Google Scholar]
- 9.van Lohuizen M, Verbeek S, Scheijen B, Wientjens E, van der Gulden H, Berns A. Identification of cooperating oncogenes in Eμ-myc transgenic mice by provirus tagging. Cell. 1991;65:737–752. doi: 10.1016/0092-8674(91)90382-9. [DOI] [PubMed] [Google Scholar]
- 10.Haupt Y, Alexander WS, Barri G, Klinken SP, Adams JM. Novel zinc finger gene implicated as myc collaborator by retrovirally accelerated lymphomagenesis in Eμ-myc transgenic mice. Cell. 1991;65:753–763. doi: 10.1016/0092-8674(91)90383-a. [DOI] [PubMed] [Google Scholar]
- 11.Beà S, Tort F, Pinyol M, Puig X, Hernández L, Hernández S, Fernandez PL, van Lohuizen M, Colomer D, Campo E. BMI-1 gene amplification and overexpression in hematological malignancies occur mainly in mantle cell lymphomas. Cancer Res. 2001;61:2409–2412. [PubMed] [Google Scholar]
- 12.Vonlanthen S, Heighway J, Altermatt HJ, Gugger M, Kappeler A, Borner MM, van Lohuizen M, Betticher DC. The bmi-1 oncoprotein is differentially expressed in non-small cell lung cancer and correlates with INK4A-ARF locus expression. Br J Cancer. 2001;84:1372–1376. doi: 10.1054/bjoc.2001.1791. [DOI] [PMC free article] [PubMed] [Google Scholar]
- 13.Kim JH, Yoon SY, Kim CN, Joo JH, Moon SK, Choe IS, Choe YK, Kim JW. The Bmi-1 oncoprotein is overexpressed in human colorectal cancer and correlates with the reduced p16INK4a/p14ARF proteins. Cancer Lett. 2004;203:217–224. doi: 10.1016/j.canlet.2003.07.009. [DOI] [PubMed] [Google Scholar]
- 14.Neo SY, Leow CK, Vega VB, Long PM, Islam AF, Lai PB, Liu ET, Ren EC. Identification of discriminators of hepatoma by gene expression profiling using a minimal dataset approach. Hepatology. 2004;39:944–953. doi: 10.1002/hep.20105. [DOI] [PubMed] [Google Scholar]
- 15.Leung C, Lingbeek M, Shakhova O, Liu J, Tanger E, Saremaslani P, van Lohuizen M, Marino S. Bmi1 is essential for cerebellar development and is overexpressed in human medulloblastomas. Nature. 2004;428:337–341. doi: 10.1038/nature02385. [DOI] [PubMed] [Google Scholar]
- 16.Sawa M, Yamamoto K, Yokozawa T, Kiyoi H, Hishida A, Kajiguchi T, Seto M, Kohno A, Kitamura K, Itoh Y, Asou N, Hamajima N, Emi N, Naoe T. BMI-1 is highly expressed in M0-subtype acute myeloid leukemia. Int J Hematol. 2005;82:42–47. doi: 10.1532/IJH97.05013. [DOI] [PubMed] [Google Scholar]
- 17.Jacobs JJ, Kieboom K, Marino S, DePinho RA, van Lohuizen M. The oncogene and Polycomb-group gene bmi-1 regulates cell proliferation and senescence through the ink4a locus. Nature. 1999;397:164–168. doi: 10.1038/16476. [DOI] [PubMed] [Google Scholar]
- 18.Sherr CJ. Principles of tumor suppression. Cell. 2004;116:235–246. doi: 10.1016/s0092-8674(03)01075-4. [DOI] [PubMed] [Google Scholar]
- 19.Shumacher A, Faust C, Magnuson T. Positional cloning of a global regulator of anterior–posterior patterning in mice. Nature. 1996;383:250–253. doi: 10.1038/383250a0. [DOI] [PubMed] [Google Scholar]
- 20.O'Carroll D, Erhardt S, Pagani M, Barton SC, Surani MA, Jenuwein T. The Polycomb-group gene Ezh2 is required for early mouse development. Mol Cell Biol. 2001;21:4330–4336. doi: 10.1128/MCB.21.13.4330-4336.2001. [DOI] [PMC free article] [PubMed] [Google Scholar]
- 21.Voncken JW, Roelen BA, Roefs M, de Vries S, Verhoeven E, Marino S, Deschamps J, van Lohuizen M. Rnf2 (Ring1b) deficiency causes gastrulation arrest and cell cycle inhibition. Proc Natl Acad Sci U S A. 2003;100:2468–2473. doi: 10.1073/pnas.0434312100. [DOI] [PMC free article] [PubMed] [Google Scholar]
- 22.Pasini D, Bracken AP, Hansen JB, Capillo M, Helin K. The Polycomb group protein Suz12 is required for embryonic stem cell differentiation. Mol Cell Biol. 2007;27:3769–3779. doi: 10.1128/MCB.01432-06. [DOI] [PMC free article] [PubMed] [Google Scholar]
- 23.Boyer LA, Plath K, Zeitlinger J, Brambrink T, Medeiros LA, Lee TI, Levine SS, Wernig M, Tajonar A, Ray MK, Bell GW, Otte AP, Vidal M, Gifford DK, Young RA, Jaenisch R. Polycomb complexes repress developmental regulators in murine embryonic stem cells. Nature. 2006;441:349–353. doi: 10.1038/nature04733. [DOI] [PubMed] [Google Scholar]
- 24.Lee TI, Jenner RG, Boyer LA, Guenther MG, Levine SS, Kumar RM, Chevalier B, Johnstone SE, Cole MF, Isono K, Koseki H, Fuchikami T, Abe K, Murray HL, Zucker JP, Yuan B, Bell GW, Herbolsheimer E, Hannett NM, Sun K, Odom DT, Otte AP, Volkert TL, Bartel DP, Melton DA, Gifford DK, Jaenisch R, Young RA. Control of developmental regulators by Polycomb in human embryonic stem cells. Cell. 2006;125:301–313. doi: 10.1016/j.cell.2006.02.043. [DOI] [PMC free article] [PubMed] [Google Scholar]
- 25.Bernstein BE, Mikkelsen TS, Xie X, Kamal M, Huebert DJ, Cuff J, Fry B, Meissner A, Wernig M, Plath K, Jaenisch R, Wagschal A, Feil R, Schreiber SL, Lander ES. A bivalent chromatin structure marks key developmental genes in embryonic stem cells. Cell. 2006;125:315–326. doi: 10.1016/j.cell.2006.02.041. [DOI] [PubMed] [Google Scholar]
- 26.van der Stoop P, Boutsma EA, Hulsman D, Noback S, Heimerikx M, Kerkhoven RM, Voncken JW, Wessels LF, van Lohuizen M. Ubiquitin E3 ligase Ring1b/Rnf2 of polycomb repressive complex 1 contributes to stable maintenance of mouse embryonic stem cells. PLoS One. 2008;3:e2235. doi: 10.1371/journal.pone.0002235. [DOI] [PMC free article] [PubMed] [Google Scholar]
- 27.Stock JK, Giadrossi S, Casanova M, Brookes E, Vidal M, Koseki H, Brockdorff N, Fisher AG, Pombo A. Ring1-mediated ubiquitination of H2A restrains poised RNA polymerase II at bivalent genes in mouse ES cells. Nat Cell Biol. 2007;9:1428–1435. doi: 10.1038/ncb1663. [DOI] [PubMed] [Google Scholar]
- 28.Park IK, Qian D, Kiel M, Becker MW, Pihalja M, Weissman IL, Morrison SJ, Clarke MF. Bmi-1 is required for maintenance of adult self-renewing haematopoietic stem cells. Nature. 2003;423:302–305. doi: 10.1038/nature01587. [DOI] [PubMed] [Google Scholar]
- 29.Molofsky AV, Pardal R, Iwashita T, Park IK, Clarke MF, Morrison SJ. Bmi-1 dependence distinguishes neural stem cell self-renewal from progenitor proliferation. Nature. 2003;425:962–967. doi: 10.1038/nature02060. [DOI] [PMC free article] [PubMed] [Google Scholar]
- 30.Lessard J, Sauvageau G. Bmi-1 determines the proliferative capacity of normal and leukaemic stem cells. Nature. 2003;423:255–260. doi: 10.1038/nature01572. [DOI] [PubMed] [Google Scholar]
- 31.Iwama A, Oguro H, Negishi M, Kato Y, Morita Y, Tsukui H, Ema H, Kamijo T, Katoh-Fukui Y, Koseki H, van Lohuizen M, Nakauchi H. Enhanced self-renewal of hematopoietic stem cells mediated by the Polycomb gene product Bmi-1. Immunity. 2004;21:843–851. doi: 10.1016/j.immuni.2004.11.004. [DOI] [PubMed] [Google Scholar]
- 32.Kirmizis A, Bartley SM, Farnham PJ. Identification of the Polycomb group protein SU(Z)12 as a potential molecular target for human cancer therapy. Mol Cancer Ther. 2003;2:113–121. [PubMed] [Google Scholar]
- 33.Ferres-Marco D, Gutierrez-Garcia I, Vallejo DM, Bolivar J, Gutierrez-Aviño FJ, Dominguez M. Epigenetic silencers and Notch collaborate to promote malignant tumours by Rb silencing. Nature. 2006;439:430–436. doi: 10.1038/nature04376. [DOI] [PubMed] [Google Scholar]
- 34.Liu S, Dontu G, Mantle ID, Patel S, Ahn NS, Jackson KW, Suri P, Wicha MS. Hedgehog signaling and Bmi-1 regulate self-renewal of normal and malignant human mammary stem cells. Cancer Res. 2006;66:6063–6071. doi: 10.1158/0008-5472.CAN-06-0054. [DOI] [PMC free article] [PubMed] [Google Scholar]
- 35.Lee N, Maurange C, Ringrose L, Paro R. Suppression of Polycomb group proteins by JNK signalling induces transdetermination in Drosophila imaginal discs. Nature. 2005;438:234–237. doi: 10.1038/nature04120. [DOI] [PubMed] [Google Scholar]
- 36.Voncken JW, Schweizer D, Aagaard L, Sattler L, Jantsch MF, van Lohuizen M. Chromatin-association of the Polycomb group protein BMI1 is cell cycle-regulated and correlates with its phosphorylation status. J Cell Sci. 1999;112:4627–4639. doi: 10.1242/jcs.112.24.4627. [DOI] [PubMed] [Google Scholar]
- 37.Hernández-Muñoz I, Taghavi P, Kuijl C, Neefjes J, van Lohuizen M. Association of BMI1 with Polycomb bodies is dynamic and requires PRC2/EZH2 and the maintenance DNA methyltransferase DNMT1. Mol Cell Biol. 2005;25:11047–11058. doi: 10.1128/MCB.25.24.11047-11058.2005. [DOI] [PMC free article] [PubMed] [Google Scholar]
- 38.Voncken JW, Niessen H, Neufeld B, Rennefahrt U, Dahlmans V, Kubben N, Holzer B, Ludwig S, Rapp UR. MAPKAP kinase 3pK phosphorylates and regulates chromatin association of the Polycomb group protein Bmi1. J Biol Chem. 2005;280:5178–5187. doi: 10.1074/jbc.M407155200. [DOI] [PubMed] [Google Scholar]
- 39.Vivanco I, Sawyers CL. The phosphatidylinositol 3-kinase–AKT pathway in human cancer. Nat Rev Cancer. 2002;2:489–501. doi: 10.1038/nrc839. [DOI] [PubMed] [Google Scholar]
- 40.Luo J, Manning BD, Cantley LC. Targeting the PI3K-Akt pathway in human cancer: Rationale and promise. Cancer Cell. 2003;4:257–262. doi: 10.1016/s1535-6108(03)00248-4. [DOI] [PubMed] [Google Scholar]
- 41.Manning BD, Cantley LC. AKT/PKB signaling: Navigating downstream. Cell. 2007;129:1261–1274. doi: 10.1016/j.cell.2007.06.009. [DOI] [PMC free article] [PubMed] [Google Scholar]
- 42.Chen Z, Trotman LC, Shaffer D, Lin HK, Dotan ZA, Niki M, Koutcher JA, Scher HI, Ludwig T, Gerald W, Cordon-Cardo C, Pandolfi PP. Crucial role of p53-dependent cellular senescence in suppression of Pten-deficient tumorigenesis. Nature. 2005;436:725–730. doi: 10.1038/nature03918. [DOI] [PMC free article] [PubMed] [Google Scholar]
- 43.Miyauchi H, Minamino T, Tateno K, Kunieda T, Toko H, Komuro I. Akt negatively regulates the in vitro lifespan of human endothelial cells via a p53/p21-dependent pathway. EMBO J. 2004;23:212–220. doi: 10.1038/sj.emboj.7600045. [DOI] [PMC free article] [PubMed] [Google Scholar]
- 44.Shin I, Yakes FM, Rojo F, Shin NY, Bakin AV, Baselga J, Arteaga CL. PKB/Akt mediates cell-cycle progression by phosphorylation of p27Kip1 at threonine 157 and modulation of its cellular localization. Nat Med. 2002;8:1145–1152. doi: 10.1038/nm759. [DOI] [PubMed] [Google Scholar]
- 45.She QB, Chandarlapaty S, Ye Q, Lobo J, Haskell KM, Leander KR, DeFeo-Jones D, Huber HE, Rosen N. Breast tumor cells with PI3K mutation or HER2 amplification are selectively addicted to Akt signaling. PLoS One. 2008;3:e3065. doi: 10.1371/journal.pone.0003065. [DOI] [PMC free article] [PubMed] [Google Scholar]
- 46.Gimri GP, Lee X, Basile G, Acosta M, Scott G, Roskelley C, Medrano EE, Linskens M, Rubelj I, Pereira-Smith O, Peacocke M, Campisi J. A biomarker that identifies senescent human cells in culture and in aging skin in vivo. Proc Natl Acad Sci U S A. 1995;92:9363–9367. doi: 10.1073/pnas.92.20.9363. [DOI] [PMC free article] [PubMed] [Google Scholar]
- 47.Jacobs JJ, Scheijen B, Voncken JW, Kieboom K, Berns A, van Lohuizen M. Bmi-1 collaborates with c-Myc in tumorigenesis by inhibiting c-Myc-induced apoptosis via INK4a/ARF. Genes Dev. 1999;13:2678–2690. doi: 10.1101/gad.13.20.2678. [DOI] [PMC free article] [PubMed] [Google Scholar]
- 48.Yilmaz OH, Valdez R, Theisen BK, Guo W, Ferguson DO, Wu H, Morrison SJ. Pten dependence distinguishes haematopoietic stem cells from leukaemia-initiating cells. Nature. 2006;441:475–482. doi: 10.1038/nature04703. [DOI] [PubMed] [Google Scholar]
- 49.Zhang J, Grindley JC, Yin T, Jayasinghe S, He XC, Ross JT, Haug JS, Rupp D, Porter-Westpfahl KS, Wiedemann LM, Wu H, Li L. PTEN maintains haematopoietic stem cells and acts in lineage choice and leukaemia prevention. Nature. 2006;441:518–522. doi: 10.1038/nature04747. [DOI] [PubMed] [Google Scholar]
- 50.Guo W, Lasky JL, Chang CJ, Mosessian S, Lewis X, Xiao Y, Yeh JE, Chen JY, Iruela-Arispe ML, Varella-Garcia M, Wu H. Multi-genetic events collaboratively contribute to Pten-null leukaemia stem-cell formation. Nature. 2008;453:529–533. doi: 10.1038/nature06933. [DOI] [PMC free article] [PubMed] [Google Scholar]
- 51.Liu Y, Elf SE, Miyata Y, Sashida G, Liu Y, Huang G, Di Giandomenico S, Lee JM, Deblasio A, Menendez S, Antipin J, Reva B, Koff A, Nimer SD. p53 regulates hematopoietic stem cell quiescence. Cell Stem Cell. 2009;4:37–48. doi: 10.1016/j.stem.2008.11.006. [DOI] [PMC free article] [PubMed] [Google Scholar]
- 52.Strahl BD, Allis CD. The language of covalent histone modifications. Nature. 2000;403:41–45. doi: 10.1038/47412. [DOI] [PubMed] [Google Scholar]
- 53.Jenuwein T, Allis CD. Translating the histone code. Science. 2001;293:1074–1080. doi: 10.1126/science.1063127. [DOI] [PubMed] [Google Scholar]
- 54.Fleming AB, Kao CF, Hillyer C, Pikaart M, Osley MA. H2B ubiquitylation plays a role in nucleosome dynamics during transcription elongation. Mol Cell. 2008;31:57–66. doi: 10.1016/j.molcel.2008.04.025. [DOI] [PubMed] [Google Scholar]
- 55.Cha TL, Zhou BP, Xia W, Wu Y, Yang CC, Chen CT, Ping B, Otte AP, Hung MC. Akt-mediated phosphorylation of EZH2 suppresses methylation of lysine 27 in histone H3. Science. 2005;310:306–310. doi: 10.1126/science.1118947. [DOI] [PubMed] [Google Scholar]
- 56.Bracken AP, Kleine-Kohlbrecher D, Dietrich N, Pasini D, Gargiulo G, Beckman C, Theilgaard-Mönch K, Minucci S, Porse BT, Marine JC, Hansen KH, Helin K. The Polycomb group proteins bind throughout the INK4A-ARF locus and are disassociated in senescent cells. Genes Dev. 2007;21:525–530. doi: 10.1101/gad.415507. [DOI] [PMC free article] [PubMed] [Google Scholar]
- 57.Serrano M, Blasco MA. Cancer and ageing: Convergent and divergent mechanisms. Nat Rev Mol Cell Biol. 2007;8:715–722. doi: 10.1038/nrm2242. [DOI] [PubMed] [Google Scholar]
- 58.Prieur A, Peeper DS. Cellular senescence in vivo: A barrier to tumorigenesis. Curr Opin Cell Biol. 2008;20:150–155. doi: 10.1016/j.ceb.2008.01.007. [DOI] [PubMed] [Google Scholar]
- 59.Min J, Zhang Y, Xu RM. Structural basis for specific binding of Polycomb chromodomain to histone H3 methylated at Lys 27. Genes Dev. 2003;17:1823–1828. doi: 10.1101/gad.269603. [DOI] [PMC free article] [PubMed] [Google Scholar]
- 60.Francis NJ, Kingston RE, Woodcock CL. Chromatin compaction by a Polycomb group protein complex. Science. 2004;306:1574–1577. doi: 10.1126/science.1100576. [DOI] [PubMed] [Google Scholar]
- 61.Zhu P, Zhou W, Wang J, Puc J, Ohgi KA, Erdjument-Bromage H, Tempst P, Glass CK, Rosenfeld MG. A histone H2A deubiquitinase complex coordinating histone acetylation and H1 dissociation in transcriptional regulation. Mol Cell. 2007;27:609–621. doi: 10.1016/j.molcel.2007.07.024. [DOI] [PMC free article] [PubMed] [Google Scholar]
- 62.Zhou W, Zhu P, Wang J, Pascual G, Ohgi KA, Lozach J, Glass CK, Rosenfeld MG. Histone H2A monoubiquitination represses transcription by inhibiting RNA polymerase II transcriptional elongation. Mol Cell. 2008;29:69–80. doi: 10.1016/j.molcel.2007.11.002. [DOI] [PMC free article] [PubMed] [Google Scholar]
- 63.Elderkin S, Maertens GN, Endoh M, Mallery DL, Morrice N, Koseki H, Peters G, Brockdorff N, Hiom K. A phosphorylated form of Mel-18 targets the Ring1B histone H2A ubiquitin ligase to chromatin. Mol Cell. 2007;28:107–120. doi: 10.1016/j.molcel.2007.08.009. [DOI] [PubMed] [Google Scholar]
- 64.Lee JY, Nakada D, Yilmaz OH, Tothova Z, Joseph NM, Lim MS, Gilliland DG, Morrison SJ. mTOR activation induces tumor suppressors that inhibit leukemogenesis and deplete hematopoietic stem cells after Pten deletion. Cell Stem Cell. 2010;7:593–605. doi: 10.1016/j.stem.2010.09.015. [DOI] [PMC free article] [PubMed] [Google Scholar]
- 65.Nacerddine K, Beaudry JB, Ginjala V, Westerman B, Mattiroli F, Song JY, van der Poel H, Ponz OB, Pritchard C, Cornelissen-Steijger P, Zevenhoven J, Tanger E, Sixma TK, Ganesan S, van Lohuizen M. Akt-mediated phosphorylation of Bmi1 modulates its oncogenic potential, E3 ligase activity, and DNA damage repair activity in mouse prostate cancer. J Clin Invest. 2012;122:1920–1932. doi: 10.1172/JCI57477. [DOI] [PMC free article] [PubMed] [Google Scholar]
- 66.Stiles B, Groszer M, Wang S, Jiao J, Wu H. PTENless means more. Dev Biol. 2004;273:175–184. doi: 10.1016/j.ydbio.2004.06.008. [DOI] [PubMed] [Google Scholar]
- 67.Cully M, You H, Levine AJ, Mak TW. Beyond PTEN mutations: The PI3K pathway as an integrator of multiple inputs during tumorigenesis. Nat Rev Cancer. 2006;6:184–192. doi: 10.1038/nrc1819. [DOI] [PubMed] [Google Scholar]
- 68.Yamazaki S, Iwama A, Takayanagi S, Morita Y, Eto K, Ema H, Nakauchi H. Cytokine signals modulated via lipid rafts mimic niche signals and induce hibernation in hematopoietic stem cells. EMBO J. 2006;25:3515–3523. doi: 10.1038/sj.emboj.7601236. [DOI] [PMC free article] [PubMed] [Google Scholar]
- 69.Ma L, Chen Z, Erdjument-Bromage H, Tempst P, Pandolfi PP. Phosphorylation and functional inactivation of TSC2 by Erk: Implications for tuberous sclerosis and cancer pathogenesis. Cell. 2005;121:179–193. doi: 10.1016/j.cell.2005.02.031. [DOI] [PubMed] [Google Scholar]
Associated Data
This section collects any data citations, data availability statements, or supplementary materials included in this article.