

Background: p21 is a cell cycle regulator with no known role in metabolic regulation.
Results: Fasting induces a potent p53-independent increase in p21 expression in metabolic tissues and Forkhead Box O1 (FOXO1) contributes to this response in liver.
Conclusion: This study advances the role of p21 in metabolic stress response.
Significance: Metabolic stress induces a cell cycle regulator even in non-dividing cells.
Keywords: Bioluminescence, Diet, Foxo, Hypothalamus, Liver, Metabolism, Mouse
Abstract
Reporter mice that enable the activity of the endogenous p21 promoter to be dynamically monitored in real time in vivo and under a variety of experimental conditions revealed ubiquitous p21 expression in mouse organs including the brain. Low light bioluminescence microscopy was employed to localize p21 expression to specific regions of the brain. Interestingly, p21 expression was observed in the paraventricular, arcuate, and dorsomedial nuclei of the hypothalamus, regions that detect nutrient levels in the blood stream and signal metabolic actions throughout the body. These results suggested a link between p21 expression and metabolic regulation. We found that short-term food deprivation (fasting) potently induced p21 expression in tissues involved in metabolic regulation including liver, pancreas and hypothalamic nuclei. Conditional reporter mice were generated that enabled hepatocyte-specific expression of p21 to be monitored in vivo. Bioluminescence imaging demonstrated that fasting induced a 7-fold increase in p21 expression in livers of reporter mice and Western blotting demonstrated an increase in protein levels as well. The ability of fasting to induce p21 expression was found to be independent of p53 but dependent on FOXO1. Finally, occupancy of the endogenous p21 promoter by FOXO1 was observed in the livers of fasted but not fed mice. Thus, fasting promotes loading of FOXO1 onto the p21 promoter to induce p21 expression in hepatocytes.
Introduction
The p21Waf1/CIP1 protein (hereafter called p21) is a cyclin-dependent protein kinase (CDK)3 inhibitor that binds to cyclin-CDK complexes, as well as free CDKs, to inhibit cell cycle progression. Inhibition of cell cycle progression by p21 occurs during cell differentiation and in response to DNA damage and oxidative stress (2). Paradoxically, low levels of p21 positively regulate cell cycle progression by aiding in the assembly of stable CDK4-Cyclin D complexes. p21 also binds to and inhibits pro-apoptotic factors and binds to PCNA to regulate DNA replication and repair. Several signaling pathways impact the regulation of p21 at the level of transcriptional activation, mRNA elongation, and protein stability.
Transcriptional regulation of the gene encoding p21, Cdkn1a (hereafter called p21), is controlled through many signaling pathways. The tumor suppressor protein p53 was one of the first transcription factors found to activate p21 transcription, particularly when cells are exposed to various forms of stress. While many upstream signals activate p21 through p53, there are a growing number of p53-independent mediators of p21 transcription. A subset of these p53-independent mechanisms includes Ras signaling through E2F1, nuclear receptors such as progesterone acting through their cognate response elements, and TGFβ through a complex containing SMAD3/4 and FOXO (3).
To monitor upstream signaling pathways that specifically regulate p21 promoter activity, we previously generated and characterized reporter mice that enable noninvasive and repetitive imaging of p21 promoter activity in vivo using molecular imaging strategies (1). p21 was ubiquitously expressed in reporter mice including in cells and organs that are relatively quiescent with respect to proliferation, such as hepatocytes and brain.
In this study, low light bioluminescent imaging was employed to localize p21 expression to specific regions of the brain. Interestingly, bioluminescence was detected in the hypothalamus and in particular hypothalamic nuclei involved in metabolic regulation. This prompted us to examine p21 expression under conditions of short-term starvation (fasting). We report that p21 expression is robustly activated in several tissues in response to the metabolic stress induced by fasting, including metabolic organs. Furthermore, we demonstrate that this stress response is independent of p53. Instead, FOXO1 was demonstrated to bind to the p21 promoter in the fasted, but not fed state, and to be necessary for activation of p21 expression during fasting.
EXPERIMENTAL PROCEDURES
This study was carried out in strict accordance with the recommendations in the Guide for the Care and Use of Laboratory Animals of the National Institutes of Health. The Committee on the Ethics of Animal Experiments at Washington University approved all animal protocols used in this study.
Construction of Conditional p21CBRLuc Targeting Vector
DNA sequences of the mouse p21 chromosome locus and its transcript were obtained from Ensembl Mouse Genome Database. PCR was utilized to amplify DNA encoding p21 from mouse 129/SvJ genomic DNA (Invitrogen). The 5′ arm was generated using primers 5′-GAT CCC CGG TCC TTG TGA A-3′ and 5′-CCA TGG TGC CTG TGG CTG AAA C-3′ to amplify 4.0 kb of p21 genomic DNA beginning within intron 1 and extending to immediately after the start codon in exon 2. The primer design inserted an NcoI site after the ATG start codon in exon 2. The second PCR reaction generated the 3′ arm using primers 5′-TGT CCG ACC TGT TCC GCA CAG-3′ and 5′-GGT AAG ACC AGG GAA TCC CAC-3′ to amplify 1.8 kb extending from inside exon 2 to the noncoding sequences downstream of exon 3. A modified version of pBigT was used as the backbone for inserting the 5′ and 3′ homologous arms and the Luciferase gene. pBigT contains a lox-P flanked PGK-NEO cassette (phosphoglycerate kinase promoter driving expression of neomycin phosphotransferase) and was modified with the sequence TAG TAA TGA C TAG TAA TGA C TAG TAA TGA between neomycin and the first poly(A) to provide three additional stop codons in each reading frame (pMBigT). The 4.0 kb BamHI/NcoI 5′ arm blunt fragment was cloned into SnaBI digested pMBigT. The 1.8 kb EcoRI/EcoRI 3′ arm blunt fragment was cloned into Asc I-digested pMBigT. A 1.6 kb NcoI/XbaI blunt fragment from pCBR (Promega) encoding Click Beetle Red Luciferase was cloned into NheI/SacI-digested pMBigT. Constructs were initially sequenced to confirm no point mutations and junctions were sequenced with each round of cloning.
Generation of Mice Harboring the Conditional p21CBRLuc Allele
SSC10 ES cells (Siteman Cancer Center at Washington University) were electroporated with 13.4 kb Pac1 linearized targeting vector and selected with Geneticin (G418; Invitrogen) using established protocols (Siteman Cancer Murine Embryonic Stem Cell Core). A total of 144 G418-resistant ES colonies were analyzed for homologous recombination. Genomic DNA was digested with NdeI followed by Southern blotting with the 5′ probe (primers: Forward 5′-GCG ATA TCC AGA CAT TCA GAG-3′, Reverse 5′-GGA ATC CCT AGA AAC ATT GGC-3′) and with BglII/SphI followed by Southern blotting with the 3′ probe (primers: Forward 5′-CCA GTT GGG GTT CTC AGT GAC-3′, Reverse 5′-TCT CGT GAG ACG CTT ACA ATC-3′). The sizes of the WT and recombinant alleles probed with the 5′ probe were 10.5 kb and 15.0 kb, respectively, and with the 3′ probe were 8.5 kb and 5.9 kb, respectively. Four were positive for homologous recombination. ES cell clones #2, 4, 12, and 48 were karyotyped and clones #2 and 4 were microinjected into C57BL/6 blastocysts and subsequently implanted into the uteri of pseudopregnant C57BL/6 x C3H foster mothers. Male chimeras were selected by percentage of agouti color and were mated to C57BL/6 females. Germ line transmission was determined by agouti coat color. Progeny from ES clone #2 were selected for further propagation. F1 animals were tested for the targeted p21 allele by PCR analysis of tail DNA. PCR analysis was performed with three primers (A: 5′-TCT TGT GTT TCA GCC ACA GGC-3′, B: 5′-CTG TCA GGC TGG TCT GCC TCC-3′, C: 5′-TGC TAA AGC GCA TGC TCC AGA C-3′). The sizes of the WT and recombinant alleles were 453 and 160, respectively, when probed with primers A, B, and C. In the recombinant locus, we knocked-in the CBRLuciferase gene into the endogenous p21 locus; however, CBRLuciferase was not expressed, as it is downstream of 3 stop codons in each reading frame. The mice were crossed with transgenic mice expressing Cre under control of the Albumin promoter (4). To confirm Cre-mediated excision of the stop codon, DNA was isolated from livers and PCR analysis was performed with four primers (A-C above and D: 5′-CTA ACG ACG TCG TTC ATC TTG T-3′). The sizes of the WT, recombinant pre-Cre-mediated excision and recombinant post-Cre-mediated excision were 453, 160 and 350, respectively, when probed with primers A, B, C, and D.
Mouse Husbandry
Unless otherwise stated, equivalent numbers of male and female mice at 4–6 weeks of age were used. p21+/FLucmice were previously published (1) and were backcrossed at least 3 times to B6(Cg)-Tyrc-2J/J (B6-albino, Jackson Laboratory), as were all mice used for bioluminescence imaging (BLI). Albumin-Cre mice were provided by Dr. Shin Imai and FOXO1 floxed mice were provided by Dr. Ronald DePinho. Wild type mice used in the studies were littermates of p21+/FLuc mice on the B6-albino background. All experimental mice were housed singly on aspen bedding.
Bioluminescence Imaging
BLI was performed as previously published for studies carried out in vivo and ex vivo (1) except that a wire rack was placed in each cage to prevent mice from eating bedding during the fasting period and a 14-day osmotic pump (Durect) was used in experiments involving adenoviral infections.
Western Blotting
Livers isolated from p21+/Fluc and p21FLuc/FLuc mice were flash frozen. Livers were thawed followed by homogenization in mammalian cell lysis buffer (MCLB (50 mm Tris-HCl, pH 8.0, 2 mm DTT, 5 mm EDTA, 0.5% Nonidet P-40, 100 mm NaCl, 1 mm microcystin (Sigma), 1 mm sodium orthovanadate, 2 mm PMSF)) supplemented with 1 mm sodium fluoride, protease inhibitor cocktail (Sigma) and phosphatase inhibitor cocktail (Calbiochem). Clarified lysates were resolved directly by SDS-PAGE (10%/15% layered SDS gel) and transferred to nitrocellulose membranes for Western blotting. Membranes were blocked in TBST (20 mm Tris HCl, pH 7.6, 137 mm NaCl, 0.1% Tween 20) containing 5% nonfat milk and incubated overnight in primary antibody diluted in TBST/1% nonfat milk. Membranes were washed in TBST, incubated with HRP-conjugated secondary antibody for 1 h in TBST/1% nonfat milk, and washed again in TBST. Membranes were incubated with ECL (Pierce) and analyzed using a GelDoc Imaging System (Bio-Rad). Primary antibodies included anti-p21 at 1:1000 (Santa Cruz Biotechnology, F5), and anti-Actin at 1:10,000 (Sigma, A4700). Secondary antibodies were HRP-conjugated, AffiniPure goat anti-mouse (Jackson).
Low Light Microscopy
Male and female p21+/FLuc mice were allowed to feed ad libitum or were fasted for 24 h. Mice were sacrificed and brains were isolated. Isolated brains were placed in ice cold Hanks-buffered Saline Solution (HBSS, pH 7.4) (Sigma) and cut into 200 μm sections on a vibratome (immersed in HBSS maintained at 4 °C). Three brain slices containing the hypothalamus at −0.58 mm, −1.82 mm, and −1.94 mm Bregma were placed on separate organotypic Millicell culture inserts (Millipore) in a 35-mm Petri dish containing HEPES-buffered DMEM supplemented with B27 (Invitrogen), 0.1 μm d-luciferin (BioThema), 100 units/ml penicillin, and 100 units/ml streptomycin (Invitrogen). All images were initiated within 45 min of organ isolation. To allow for imaging multiple tissues from within one mouse, three low light imaging systems were utilized and kept consistent for each region: a Versarray back-thinned illuminated CCD camera (Princeton Instruments), and an iXon DU-897E EM CCD camera (Andor Technology), each coupled to TE-2000 Nikon inverted microscopes were equipped with custom light tight environmental chambers (InVivo Scientific) that prevented light leaks and allowed maintenance of a constant temperature of 37 °C, or in a light tight box with an intensified CCD camera (XR/Mega-10Z; Stanford Photonics Inc.) (5). Image acquisition was controlled with Winview32 and Micro-Manager (www.Micro-Manager.org) software packages. Image processing of target regions identified by comparison to a mouse brain atlas (6) was performed with ImageJ software (7) and included subtraction of a background image, removal of random bright spots (using despeckle filtering algorirthm, ImageJ) and adjusting the brightness and contrast equally across the entire image. Intensity scale ramps were scaled and normalized to the time over which the image was acquired and are represented as RLU/minute. Pseudocolored images were generated using the RainbowRGB look-up table (LUT) on the bioluminescence image. ROIs were analyzed using ImageJ and were normalized as target region to non-target region.
Laser Capture Microdissection
Brains were dissected from p21+/+ or p21FLuc/FLuc mice, sliced coronally into three sections using a coronal brain tissue matrix, immediately frozen in optimal cutting temperature (OCT, TissueTek) compound, and stored at −80 °C. 30 μm sections ranging from Bregma −0.58 to −0.82 mm (paraventricular nucleus) and from Bregma −1.70 mm to −1.94 mm (arcuate nucleus and dorsomedial hypothalamus) were cut coronally on a cryostat and sections were placed on PEN membrane slides (Leica). Unstained slides were stored in a desiccator at −80 °C. Tissue-mounted slides were fixed in 100% ethanol (30 s), rehydrated in ethanol (95, 75, 50%) for 30 s each, stained in 1% Crystal Violet (Sigma Co) in RNase-free water (1 min) and dehydrated in ethanol (50, 75, 95, 100, and 100%) for 30 s each. Slides were rinsed in xylene and dried in a desiccator for at least 5 min immediately prior to laser capture microdissection. Sections were dissected using the Leica LMD7000 laser capture microdissection system.
Real-time PCR
RNA was isolated from laser capture microdissected tissue using the RNeasy Micro Kit (Qiagen). Isolated RNA was treated with DNaseI (Qiagen and Ambion) and quality of RNA was determined by chip electrophoresis (Bio-Rad) and only high quality samples were analyzed. RNA was reverse-transcribed using the High-Capacity cDNA Reverse Transcription Kit (Applied Biosystems). Real-time PCR of laser-captured samples was performed as previously reported (1). Relative expression of p21 to Actin in laser capture microdissection was calculated using the 2−ΔCT method.
Chromatin Immunoprecipitation
Occupancy of the p21 promoter by FOXO1 was determined using published procedures (8, 9) with the following modifications. Livers of p21+/+ mice were perfused with PBS containing 50 ng/ml heparin followed by PBS containing 1% formaldehyde. Livers were incubated in PBS/1% formaldehyde for 5 min, dissected, and incubated at 30 °C for 5 min. Crosslinking was halted by the addition of ice-cold glycine. Hepatocytes were isolated by mincing the liver, manually disrupting the tissue between 2 frosted slides, passing mixture through a 70-μm filter and centrifuging flow through for 5 min at 50 × g. Hepatocytes were resuspended in nuclear lysis buffer (50 mm Tris-HCl, pH 7.5, 10 μm EDTA, 1% SDS in ddH2O with Protease Inhibitor cocktail (Roche)), and sonicated 30 times (30 s on, 60 s off) at 60% amplitude. Cleared lysates were diluted in RIPA buffer (50 mm Tris-HCl, pH 7.4, 150 mm NaCl, 1% Triton X-100, 0.1% sodium dodecylsulfate, and 0.5% sodium deoxycholate), pre-cleared with Dynal beads (Invitrogen), and incubated overnight with FOXO1 antibody (gift from Anne Brunet) or IgG (Invitrogen) coated Dynal beads (5 μg/50 μl beads in 1 ml of PBS supplemented with 5 mg/ml BSA) rocking at 4 °C. Precipitates were washed sequentially with Low Salt Wash Buffer (once), High Salt Wash Buffer (twice), LiCl Buffer (3 times), and TE Buffer (twice) (Upstate), followed by elution in a 1% SDS, 0.1 m NaHCO3 buffer at 65 °C for 2 h. Eluates were incubated at 65 °C overnight followed by phenol-chloroform extraction and PCR cleanup (Qiagen). PCR was performed with 2× Brilliant PCR Mix (Agilent), containing 250 nm of each primer and 1 μl of 1:50 diluted chromatin immunoprecipitation sample in a Applied Biosystem Venti 96-well Thermal-Cycler (95 °C 10 min, then 35 cycles of 95 °C 30 s, 63 °C 1 min, 72 °C 30 s, followed by 72 °C 4 min). PCR products were analyzed on a 2% agarose gel. PCR primers were as follows: FHB forward primer: CCTGGAGGCCAAGGGGATTTGG; FHB reverse primer: CAG GGG CCA GCA CAG GAT GTC A; Distal fwd: TGG GCA GCT TGC CAG AGG TC; Distal rev: AGC CGC CAG GCT CCT TAC CT.
Metabolic Analysis
Plasma was isolated from 5-week-old male p21+/+ and p21FLuc/FLuc littermates that had been allowed to feed ad libitum and from the same mice 1 week later after a 24 h fast. 100 μl of heparinized blood was centrifuged and plasma was isolated. Total triglycerides, cholesterol, glucose, and free fatty acids were quantified using previously published protocols (10). Triglycerides, cholesterol, and glucose were measured using Infinity reagents (Thermo Scientific), and free fatty acids were measured using reagents provided by Wako Chemicals.
4–6-week-old p21+/+ and p21FLuc/FLuc male littermates were allowed to feed ad libitum or were fasted for 24 h. Livers were isolated, weighed, and flash frozen. Glycogen was analyzed according to recommendations of the manufacturer (Abcam).
Generation of Recombinant Adenoviruses
pCMV5 encoding HA-FOXO1 (plasmid 12142) and Flag-pCMV5 encoding the N terminus of FOXO3 (FOXO3NT, plasmid 14938) were purchased from Addgene. PCR reactions were carried out to add 5′ Xho1 and 3′ HindIII restriction sites to each cDNA using the following 5′-CCATGGACTACAAGGACGAC and 5′-ACTGGGGAGGGGTCACAG. Reaction products were sequenced and cDNAs were cloned into XhoI/HindIII digested pAdTrack. Recombinant adenoviruses were generated using the pAdEasy protocol (11).
Adenoviral Infections
p21Liv-Luc/+ mice were implanted with a 14-day, 0.5 μl/hr flow rate microosmotic pump (Durect), loaded with d-luciferin as described previously (12). Photon flux was measured at baseline, and recombinant adenovirus encoding FOXO3NT or FOXO1WT was delivered by tail vein injection of 5 × 10¹⁰ viral particles per 4–6-week-old mouse. BLI was measured 3, 6, and 9 days postinjection and mice were fasted for 24 h at 9 days postinjection. Livers were isolated after 24 h of fasting, fixed, frozen in OCT, and 5 μm sections were analyzed to determine efficiency of viral infection by quantification of the percent of GFP-positive cells within 5 fields of view.
RESULTS
p21 Promoter Is Active in a Subset of Hypothalamic Nuclei
We previously reported the generation and characterization of knock-in reporter mice that enable endogenous Cdkn1a (hereafter, p21) promoter activity to be monitored dynamically using bioluminescence imaging (BLI) (1). p21+/FLuc reporter mice express firefly luciferase (FLuc) cDNA under control of the endogenous p21 promoter. We detected p21 promoter activity in most organs of the mouse, including the brain. To localize p21 promoter activity within specific regions of the brain, live brain slices were imaged ex vivo using low light microscopy (5). Brains were isolated from p21+/FLuc mice, placed in buffers to maintain viability, immediately sectioned, then bathed in media containing d-luciferin. p21 promoter activity was localized to several hypothalamic nuclei, including the paraventricular, arcuate, periventricular, and dorsomedial nuclei (Fig. 1). These regions of the hypothalamus are involved in modulating stress, hunger, and whole body metabolic homeostasis.
FIGURE 1.

p21 expression detected in metabolic organizing center of brain. Coronal brain sections from male and female p21+/FLuc mice containing (A) paraventricular nucleus, (B) arcuate nucleus, and (C) both dorsomedial hypothalamus and periventricular nucleus were incubated with d-luciferin-containing media to maintain viability, followed by BLI. The left column is a representation of each brain region, modeled from the Paxions and Franklin mouse brain atlas, with the bioluminescence signal-containing region shaded in red. The middle column contains a pseudocolored heatmap of the bioluminescence (relative to each region), and the right column shows the heatmap overlaid on the bright field image. Scale bars are 0.5 mm. Images from representative mice are shown. Regions of the hypothalamus were abbreviated as follows: 3V is third ventricle, PaV is paraventricular; Arc is arcuate, Peri is periventricular, and DM is dorsomedial.
Fasting Activates p21 Promoter in Mice
Given that p21 was specifically expressed in regions of the hypothalamus involved in metabolic regulation, we asked if fasting modulated p21 expression. p21+/FLuc littermates were allowed to feed ad libitum or were fasted for 48 h. Mice were subjected to whole-body BLI at baseline and after 24 and 48 h of fasting. As seen in Fig. 2 (panels A and B), p21 promoter activity in mice fasted for 24 h was 8-fold higher than that in fed littermates and rose to 13-fold higher in mice fasted for 48 h. As seen in Fig. 2 (panels C and D), fasting induced p21 expression in several mouse organs and differences between fed and fasted states reached statistical significance in liver, pancreas, brain, lung, salivary gland, heart, kidney, and bladder. To determine if increased p21 promoter activity led to a corresponding increase in endogenous p21 protein, lysates were prepared from livers of fed and fasted p21+/FLuc mice, and p21 was analyzed by Western blotting. As seen in Fig. 2E, endogenous p21 protein was higher in livers of fasted mice compared with livers of fed littermates. Thus, fasting induced p21 expression and led to an increase in p21 protein in liver.
FIGURE 2.
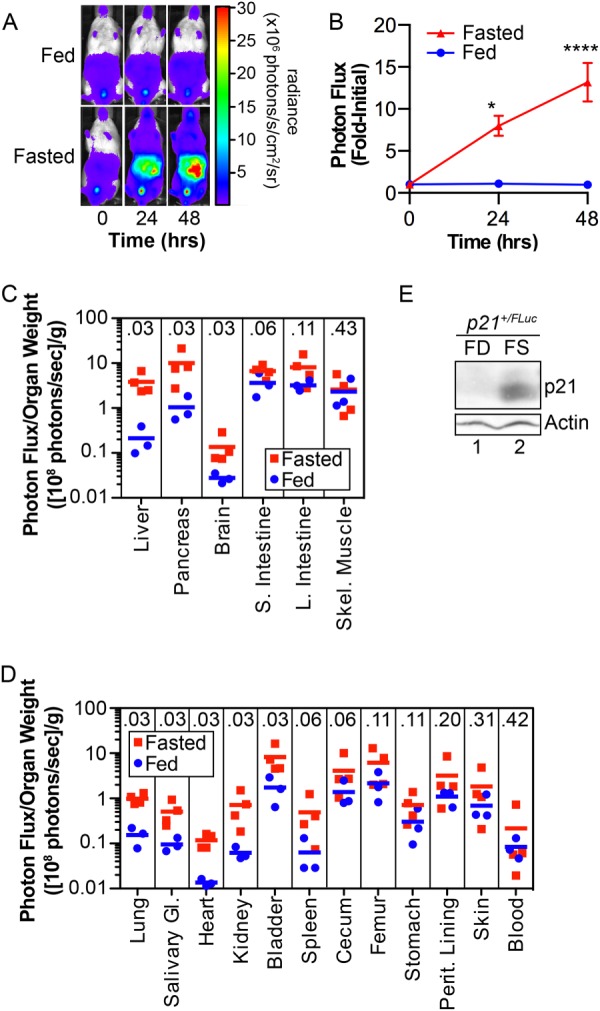
Fasting induces p21 promoter activity and p21 protein expression. p21+/FLuc male and female mice, 5–12 weeks of age, were implanted with d-Luciferin microosmotic pumps, subjected to BLI (time 0) and then were allowed to feed ad libitum or were fasted for 48 h. Whole-body BLI was performed at the indicated times. A, representative images of mice (n = 4 fed, n = 12 fasted) and B, bioluminescence quantified from a region of interest drawn from below the forpaws to the above the genitals for each mouse at time 0 and applied identically to subsequent time points. Bioluminescence relative to the value at time 0 is displayed graphically. *, p < 0.05 and ****, p < 0.0001 by Bonferroni multiple comparisons post-test of a two-way ANOVA. C and D, p21+/FLuc mice were fed or fasted (48 h), and the indicated organs were harvested, weighed, and imaged immediately. The normalized photon flux of each organ is represented as the photon flux/sample weight (photons/s/g). Individual mice (squares and circles) and group averages (bar) are shown (n = 3 fed, n = 4 fasted). The Mann-Whitney U Test p value is displayed at the top of each column. E, p21+/Fluc and p21FLuc/FLuc mice were fed (FD) or fasted (FS) for 48 h. Western blotting was performed on lysates prepared from isolated livers for the indicated proteins.
To obtain a more uniform genetic background for metabolic studies, p21+/FLuc reporter mice (of the mixed background 129/SvJ and C57BL/6J) were backcrossed to Albino-B6 (B6(Cg)-Tyrc-2J/J) mice for at least 3 generations. Albino-B6 mice are derivatives of C57BL/6J mice that carry a mutant Tyrosinase gene resulting in a white coat color, enabling enhanced sensitivity for detecting bioluminescence in vivo. Inbred progeny obtained after 3 rounds of backcrossing died if they were fasted for 48 h, so all subsequent fasting experiments performed in this study were performed for 24 h.
Fasting Activates the p21 Promoter in Specific Hypothalamic Nuclei
We next asked if fasting increased p21 expression in the paraventricular, arcuate, periventricular, and dorsomedial nuclei of the hypothalamus. Brains were isolated from mice that had been allowed to feed ad libitum or that had been fasted for 24 h. Brains were subjected to coronal sectioning in buffers that maintained tissue viability. Brain sections through the hypothalamus at Bregma −0.58, −1.82, and −1.94 were bathed in media containing d-luciferin and bioluminescence was detected using low-light imaging (LLI) microscopy. Within each section, photon output was quantified from the known location of the target region and normalized to a non-target region to control for background (Figs. 3, A and B). Fasting resulted in a trend toward increased bioluminescence within each nucleus, although differences between fed and fasted states did not reach significance. To test the p21 response in an independent assay, we performed laser-capture microdissection followed by real-time, quantitative PCR (Fig. 3C). Results confirmed that endogenous p21 mRNA increased in the paraventricular nucleus, arcuate nucleus, and dorsomedial hypothalamus in fasted mice compared with fed littermates. Because of technical limitations, we were unable to measure p21 mRNA levels in periventricular nuclei. Together, these data demonstrate that fasting increases p21 expression in the metabolic regulatory regions of the hypothalamus.
FIGURE 3.
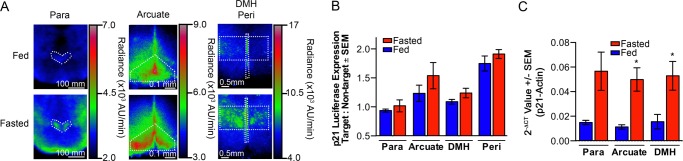
Fasting increased p21 expression in metabolic regulatory regions of the brain. Brain sections containing the paraventricular nucleus (Para), arcuate nucleus (Arcuate), dorsomedial hypothalamus (DMH), and periventricular nucleus (Peri) isolated from fed or fasted (24 h) p21+/Fluc mice, male and female, were incubated with d-luciferin-containing media and BLI was performed. A, representative images with pseudocolor heatmap of bioluminescence are shown for each region. B, bioluminescence in the regions of interest (target), shown by dotted lines, was quantified as the ratio of target to non-target regions to normalize for inherent variation in thickness (Para: n = 5 fed, n = 5 fasted; Arcuate: n = 5 fed, n = 5 fasted; DMH/Peri: n = 4 fed, n = 3 fasted; unpaired, two-tailed t test; Para p = 0.48, Arcuate p = 0.29, DMH p = 0.20, and Peri p = 0.52). C, p21+/+ mice were fed or fasted (24 h), brains were isolated, and laser-capture microdissection of hypothalamic nuclei was performed. cDNA was prepared from RNA isolated from each region. Levels of p21 and actin expression were determined by real-time qRT-PCR and the 2−ΔCT values are represented graphically (n = 3 fed, n = 4 fasted; unpaired, two-tailed t test; Para p = 0.07, Arcuate p = 0.02, and DMH p = 0.05).
Generation of Conditional Mice That Report Liver-specific p21 Expression
To monitor tissue-specific and temporal regulation of p21 expression in individual mouse tissues, knock-in mice that conditionally express click beetle (Pyrophorus plagiophthalamus) red luciferase (CBRLuc) under the control of the endogenous p21 promoter were generated (Fig. 4A). Successful homologous recombination of the conditional p21-CBRLuc targeting vector in ES cell clones was confirmed by Southern blotting (Fig. 4, B and C). PCR analysis of tail DNA confirmed the expected recombination within the p21 locus (Fig. 4D). To examine p21 promoter activity specifically within hepatocytes, conditional floxed stop p21-CBRLuc (p21f/+) reporter mice were crossed with transgenic mice expressing Cre under the control of the albumin promoter (hereafter, Alb-Cre+) (4) to generate Alb-Cre+; p21f/+ mice (hereafter p21Liv-Luc/+). Liver-specific expression was chosen because of the primary role that the liver plays in regulating systemic metabolism. PCR analysis of liver DNA demonstrated Cre-mediated recombination of the p21 allele (Fig. 4E). Importantly, bioluminescence was detected in the abdominal region of p21Liv-Luc/+ mice but not in littermates lacking the Albumin-Cre allele (hereafter, p21f/+) (Fig. 4F) and ex vivo BLI confirmed that bioluminescence was restricted to the liver (Fig. 4F). p21Liv-Luc/+ mice were backcrossed for 3 generations to Albino-B6 mice to generate mice with light coat color. p21Liv-Luc/+ mice were fasted to monitor liver-specific dynamics of p21 promoter activity in real-time. Baseline images of p21Liv-Luc/+ mice were obtained, and then mice were randomly assigned to fed or fasted groups. As seen in Fig. 5, a 7-fold increase in p21 expression was observed in the livers of mice that had been fasted for 24 h.
FIGURE 4.
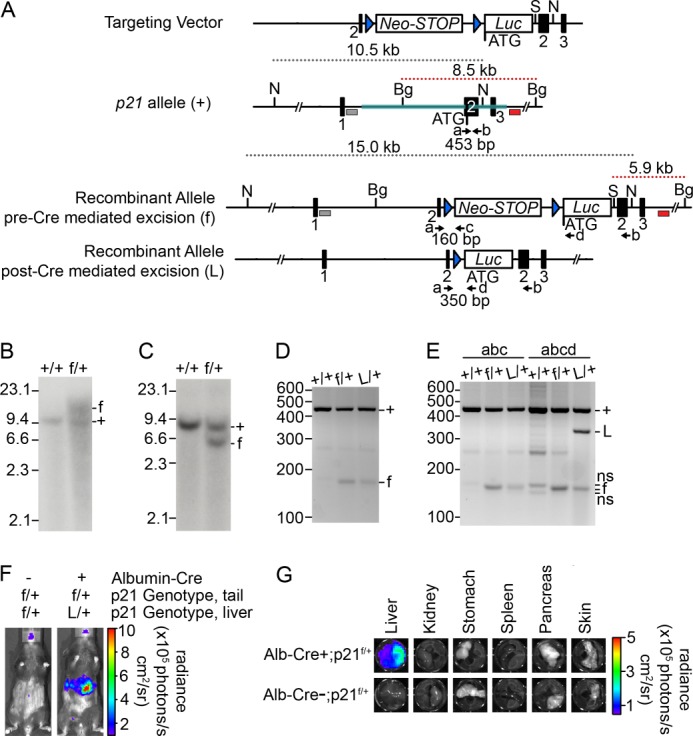
Generation and characterization of conditional p21-Luciferase reporter mouse. A, structure of the targeting vector, wild-type p21 genomic allele (+), and recombinant allele before (f) and after (L) Cre-mediated excision. The coding region of the mouse Cdkn1a gene was disrupted by insertion of a neomycin phosphotransferase cDNA cassette followed by a modified stop cassette (Neo-STOP) with each of the 3 stop codons in each reading frame (to reduce any read-through driven by the phosphoglycerine kinase promoter), followed by a codon-optimized click-beetle red luciferase cDNA (Luc) and bovine growth hormone polyadenylation sequences. Upon homologous recombination, the Luc cDNA utilizes the ATG start codon of endogenous p21 in exon 2. Exons are represented by black boxes; 5′ and 3′ arms are highlighted in teal; SphI sites are denoted by S; NdeI sites are denoted by N; BglII sites are denoted by Bg; loxp sites are shown by blue triangles; the 5′ Southern probe is shown by a gray box; the 3′ Southern probe is shown by a red box; PCR primers are shown by black arrows and lowercase letters. Sizes of expected Southern blotting and PCR products are indicated. B, genomic DNA from an ES cell clone was digested with BglII and SphI. Southern blotting was performed using the 5′ probe shown in panel A. The wild-type allele (+) gave rise to a 10.5-kb digestion product, and the recombined allele (f) gave rise to a 15.0-kb digestion product. C, genomic DNA from an ES cell clone was digested with BglII and SphI, and Southern blotting was performed using the 3′ probe shown in panel A. The wild-type allele (+) gave rise to a 8.5-kb digestion product, and the recombined allele (f) gave rise to a 5.9-kb product. D, PCR analysis of tail DNA from a wild-type mouse (+/+), conditional mouse without liver-specific Cre (f/+), and conditional mouse with liver-specific Cre (L/+) amplified with primers indicated by the black arrows (a, b, and c) in panel A. The WT (+) allele produced a 453-bp product with primers a and b, and the recombined alleles (f and L) produced a 160-bp allele, regardless of liver-specific Cre expression, with primers a and c. E, PCR analysis of liver DNA from a wild type (+/+), conditional mouse without liver-specific Cre (f/+), and conditional mouse with liver-specific Cre (L/+) amplified with the indicated primer combinations. Addition of the “d” primer distinguished between the conditional mouse without liver-specific Cre (r/+), and conditional mouse with liver-specific Cre (L/+) by a 350-bp product. F and G, conditional mice with and without the Albumin-Cre allele were shaved and injected with 150 mg/kg d-luciferin and imaged using the IVIS Lumina system (Caliper). Mice were sacrificed, and all organs located in the bioluminescence region were isolated and then imaged ex vivo. Photon flux is indicated in the pseudocolored heat maps.
FIGURE 5.
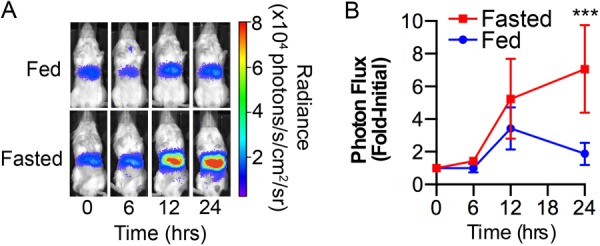
Dynamics of p21 expression in the fasted liver. p21Liv-Luc/+ male and female mice were subjected to BLI (time 0) and then allowed to feed ad libitum or were fasted (24 h). Mice were re-imaged at the indicated time points. A, representative images of mice, photon flux is indicated in the pseudocolored heat map; B, bioluminescence relative to the value at time 0, displayed graphically (n = 6 fed, n = 7 fasted). **, p < 0.01 by Tukey post-test of a 2-way ANOVA.
Activation of p21 Promoter Is a Cellular Response to Metabolic Stress
Next, experiments were carried out to determine if activation of the p21 promoter was a cellular response to metabolic stress or if p21 plays a role in maintaining metabolic homeostasis. Several parameters were measured in male mice that were either wild type (WT) or null (KO) for p21. Significant differences in steady-state body weight were not detected between p21 WT and p21 KO mice (p = 0.06), although p21 KO males trended toward weighing less than p21 WT littermates (Fig. 6A). Plasma collected from male mice that had been fasted for 24 h was assayed for levels of glucose, free fatty acids, triglycerides, and cholesterol. Mice were fasted for 24 h in these experiments, rather than the more commonly chosen times of 4 to 16 h in metabolic studies to allow for significant activation of p21 expression. Significant differences were not detected in the levels of any of these metabolites between p21 WT and p21 KO mice in either the fed or fasted states (Fig. 6, B--E). Livers isolated from male littermates that had been fed or fasted for 24 h were homogenized, glycogen was hydrolyzed to glucose, and glucose levels were used to calculate glycogen levels. As seen in Fig. 6F, glycogen levels were similar in p21 WT and p21 KO mice in both the fed and fasted states. Thus, loss of p21 did not impact the ability of glucose to be stored as glycogen in the livers of fed or fasted mice.
FIGURE 6.

p21 is not required for metabolic homeostasis. A, male p21+/+ (p21 WT) and p21FLuc/FLuc (p21 KO) littermates were weighed at 5 weeks of age. Body weights of p21 KO mice were normalized to that of their p21 WT littermates. Each mouse is represented as a circle, and the mean is represented by a solid black line. p = 0.06 by a two-tailed paired t test. B–E, plasma was isolated from 5-week-old fed mice and 1 week later plasma was isolated from the same mice after a 24 h fast. Plasma levels of triglycerides (B), glucose (C), cholesterol (D), and free fatty acids (E) were determined. Each mouse is represented as a circle, the mean for p21 WT mice is represented by a solid black line and the mean for p21 KO mice is represented by a dashed black line. F, liver glycogen levels in 4–6-week-old p21 WT and KO mice that were fed or fasted for 24 h were quantified and normalized to μg of liver tissue.
Activation of p21 Promoter by Fasting Is p53-independent
Given that p53 regulates p21 expression in response to a variety of stress stimuli, we asked if p53 regulated p21 promoter activity in response to fasting. p21+/FLuc mice were crossed to Trp53−/− mice, and progeny were intercrossed to obtain reporter mice that were either wild-type for Trp53 (p21+/FLucTrp53+/+) or null for Trp53 (p21+/FLucTrp53−/−), hereafter referred to as p53 WT or p53 KO, respectively. Mice were imaged to obtain baseline bioluminescence and then randomly assigned to fed or fasted groups. As seen in Fig. 7 (panels A and B), whole body bioluminescence demonstrated that p53 loss had no effect on the induction of p21 expression in fasted mice. In addition, BLI of individual organs revealed that p53 loss did not impact the effects of fasting on p21 promoter activity in liver, pancreas, brain, small intestine, large intestine, or skeletal muscle (Fig. 7C). Thus, p53 was not required for enhanced p21 expression during fasting.
FIGURE 7.

Fasting-induced p21 expression is p53-independent. p21+/FLucTrp53+/+ and p21+/FLucTrp53−/− male and female mice, hereafter referred to as p53 WT and p53 KO, respectively, were imaged (time 0) and then were allowed to feed ad libitum or were fasted for 24 h. Whole-body bioluminescence was determined at the indicated times during treatment. A, representative images; B, bioluminescence relative to the value at time 0, displayed graphically. ***, p < 0.001 as determined by Tukey multiple-comparison post-test of a 2-way repeated measure ANOVA between the fed and starved groups within the same genotype at 24 h, no significant difference was detected between fasted p53 WT and p53 KO mice. C, at 24 h of treatment, organs were harvested and immediately imaged. The normalized photon flux of each organ is represented as the photon flux/sample weight (photons/s/g) to control for variation in organ size. Individual mice (squares, circles, and triangles) and the group average (bar) are shown (p53 WT: n = 6 fed, n = 7 fasted; p53 KO: n = 5 fed, n = 6 fasted). The Mann-Whitney U test p value is included in each column.
FOXO1 Contributes to Activation of p21 Promoter during Fasting
Lowered IGF-1 levels during fasting increases the transcriptional activity of FOXO (13–16), and the FOXO/Smad3/4 complex has been shown to activate the p21 promoter in response to TGF-β signaling (3). Therefore, we asked if FOXO regulated p21 promoter activity in response to fasting. p21Liv-Luc mice were infected with recombinant adenoviruses expressing wild-type FOXO1 or a dominant negative form of FOXO3 (FOXO3NT) that encodes the DNA binding domain but not the transactivation domain of FOXO3 (3, 17). Analysis of mice that can be conditionally deleted for each family member either alone or in combination in the liver suggests functional redundancy between FOXO1, -3, and -4. For example, hepatic glucose production in mice conditionally deleted for all three family members in the liver is more severely impaired than in mice with liver-specific deletion of FOXO1 (18). Given that the DNA binding domains of FOXO1 and FOXO3 exhibit 88% homology, FOXO3NT was expressed with the intent to generally block FOXO activity in the liver. Reporter mice were subjected to whole-body BLI at baseline and every 3 days after adenoviral infection. No difference was detected in basal p21 promoter activity between FOXO1WT- and FOXO3NT-expressing mice during this time. On Day 9 post infection, mice were subjected to BLI at baseline and again after 24 h of fasting. As seen in Fig. 8A, the ability of fasting to induce p21 expression was attenuated in the livers of mice expressing FOXO3NT relative to FOXO1WT.
FIGURE 8.
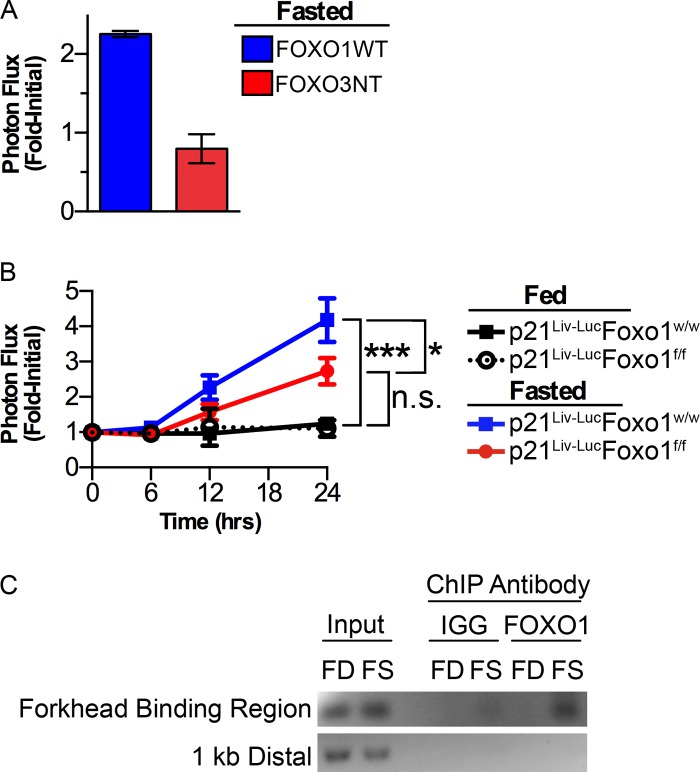
Fasting-induced expression of p21 requires FOXO1. A, p21Liv-Luc male mice were imaged and then infected with recombinant adenoviruses encoding either FOXO1WT or FOXO3NT. After 9 days of recovery, mice were reimaged (baseline), fasted for 24 h, and then reimaged (FOXO1WT n = 4, FOXO3NT n = 6. ***, p < 0.001 by an unpaired, two-way t test). B, p21Liv-LucFoxo1w/w and p21liv-LucFoxo1f/f male mice were imaged (time 0) and then were allowed to feed ad libitum or were fasted. Liver-specific bioluminescence was measured at the indicated times during treatment (p21Liv-LucFoxo1w/w fed n = 6, p21Liv-LucFoxo1w/w fasted n = 10, p21Liv-LucFoxo1f/f fed n = 7, p21Liv-LucFoxo1f/f fasted n = 13. *, p < 0.05; ***, p < 0.001, n.s., not significant as determined by Tukey multiple-comparison posttest of a 2-way repeated measure ANOVA between the indicated group at 24 h). C, p21+/+ mice were fed (FD) or fasted for 24 h (FS), and standard chromatin-immunoprecipitation for Foxo1 or control IgG was performed on isolated livers and PCR of Foxo1 and IgG-bound DNA amplified the p21 promoter Forkhead Binding Region and a control region 1-kb distal; representative experiment is shown.
Next, we asked if FOXO1 regulated p21 promoter activity in response to fasting. Foxo1f/f mice with targeted insertion of loxp sites in the endogenous Foxo1 locus on a C56BL/6J background (19) were backcrossed to Albino-B6 mice until they acquired a white coat. These mice were then crossed to p21Liv-Luc mice that express Cre recombinase from the albumin promoter. Progeny were intercrossed to obtain reporter mice that were either wild-type for FOXO1 (p21Liv-Luc Foxo1w/w) or reporter mice that could be made null for FOXO1 in hepatocytes after Cre-mediated excision (p21Liv-Luc Foxo1f/f). These mice enable real-time monitoring of p21 expression in hepatocytes that were WT or null for FOXO1. Mice of each genotype were imaged at 4 to 6 weeks of age to obtain baseline bioluminescence and then randomly assigned to fed or fasted groups. As seen in Fig. 8B, the ability of fasting to induce p21 expression was attenuated in FOXO1-deficient hepatocytes.
Given that the p21 promoter has binding sites for FOXO1 (3), we asked if FOXO1 bound to the p21 promoter during fasting. Hepatocytes were isolated from wild-type mice that had been fed or fasted and analyzed for FOXO1 occupancy on the p21 promoter by ChIP. FOXO1 was detected at the forkhead-binding region of the p21 promoter in the fasted, but not fed state. Additional controls demonstrated that FOXO1 was not bound to a region of DNA 1kb distal (upstream) of the forkhead-binding region on the p21 promoter and that no binding to the p21 promoter was detected when control IgG antibody was used (Fig. 8C).
DISCUSSION
Two types of reporter mice were used in this study to monitor endogenous p21 expression, one that enables p21 expression to be visualized throughout the whole mouse and the other that enables specific tissues of the mouse to be interrogated. In the first model, firefly luciferase was expressed whenever the endogenous p21 promoter was active. Using these mice, we previously demonstrated that expression of firefly luciferase accurately reports endogenous p21 expression, enabling the activity of the endogenous p21 promoter to be dynamically monitored in real time in vivo and under a variety of experimental conditions (1). In the second model, conditional knock-in mice were generated such that click beetle red luciferase is expressed in a tissue-specific manner whenever the endogenous p21 promoter is active. We chose to monitor p21 expression in hepatocytes using this model.
Using the first mouse model, we demonstrated that fasting potently induces p21 expression in several mouse tissues. Intriguingly, fasting induced significant increases in p21 expression in post-mitotic cells of the brain and liver. Enhanced p21 expression following fasting was also measured in other relatively quiescent organs including pancreas, lung, salivary gland, heart, and kidney. In the case of the brain, p21 expression was increased in the dorsomedial, paraventricular and arcuate nuclei of the hypothalamus. These regions detect nutrient levels in the blood stream and signal metabolic actions throughout the body (20). Neurons within arcuate nuclei are activated by modulation in blood glucose, fatty acids, and insulin. The POMC/CART and NPY/AGRP neurons of the arcuate communicate the metabolic status of the mouse to the paraventricular and dosromedial nuclei. The paraventricular nucleus integrates signals from the arcuate, as well as other inputs, and signals to the hypothalamic pituitary axis. The paraventricular nucleus also releases corticotropin-releasing hormone (CRH), a peptide hormone and neurotransmitter involved in stress responses. Finally, the dorsomedial nucleus regulates thermogenesis, energy expenditure, autonomic stress, and neuroendocrine stress.
Microarray studies conducted in mice that were fasting or put on a caloric restricted diet noted enhanced p21 expression in skeletal muscle and liver (21, 22). Ebert et al. (2010) demonstrated that p21 expression was induced upon ectopic overexpression of ATF4 in skeletal muscle. However, a demonstration that ATF4 was directly responsible for this effect was not provided.
p53 responds to numerous extrinsic and intrinsic stresses, including DNA damage, oncogene activation, hypoxia, and lack of nutrient availability to promote a variety of responses (23). Therefore, it was somewhat surprising to find that the ability of short-term starvation to activate p21 expression was normal in p53-deficient mice. This result led us to investigate other transcription factors that might be responsible for inducing p21 expression under conditions of fasting.
The forkhead box O (FOXO) family of transcription factors become activated under conditions of nutrient stress and FOXO1, -3, and -4 have overlapping and distinct roles in regulating gluconeogenesis, lipogenesis, food intake, autophagy, and cell cycle arrest (24, 25). Furthermore, FOXO1/3/4 have been shown to transcribe p21 mRNA in response to TGF-β signaling (3). Therefore, we tested if expression of dominant negative FOXO3 in the liver would impair the induction of p21 expression during fasting. Expression of dominant negative FOXO3 was found to impair the ability of fasting to induce p21 expression in the livers of infected mice. Next, we generated p21 reporter mice where Foxo1 could be conditionally deleted in hepatocytes. This was accomplished by breeding our conditional p21 reporter mice with transgenic mice that drive Cre expression from the albumin promoter. In this way Cre recombinase removes the lox-stop-lox codon immediately preceding the CBRLuc cDNA in the p21 reporter in the same hepatocytes where Foxo1 is undergoing Cre-mediated deletion. Using these mice, we demonstrated that FOXO1 was required for full activation of the p21 promoter upon fasting, but loss of FOXO1 did not completely ablate the fasting-induced activation of p21 expression. Thus, additional transcription factors including FOXO 3 and 4, which are also expressed in the liver (26), likely contribute to activation of p21 expression under conditions of low nutrient availability. Importantly, ChIP experiments performed with liver DNA demonstrated that FOXO1 was bound to the p21 promoter during fasted but not fed conditions. Taken together, these results demonstrate that FOXO1 binds to and activates the p21 promoter, resulting in an increase in p21 expression and protein in livers of mice during fasting.
The question remains whether p21 induction provides cells with a survival advantage under conditions of low nutrient availability. Loss of p21 did not impact levels of blood glucose, free fatty acids, triglycerides and cholesterol or liver glycogen at either baseline or after fasting. Thus, p21 has no apparent intrinsic role in metabolic regulation. It is also unlikely that its role as a cell cycle inhibitor is important under conditions of low nutrient availability in nondividing cells (hypothalamus, hepatocytes). However, p21 induction may serve to block apoptosis under conditions of severe nutrient deprivation. p21 has been shown to protect against apoptosis in response to growth factor deprivation, p53 overexpression, low density culture, and during monocyte differentiation (2, 27). Thus, p21 expression has an anti-apoptotic function distinct from its cell cycle inhibitory activities. The anti-apoptotic function of p21 may relate to its ability to regulate gene transcription and/or bind and inhibit proteins directly involved in apoptosis (2, 27). For example, cytoplasmically localized p21 binds to and inhibits the activity of procaspase 3, caspase 8, caspase 10, stress-activated protein kinases (SAPKs), and apoptosis signal-regulating kinase 1 (ASK1). Furthermore, p21 can mediate the up-regulation of genes encoding secreted factors with anti-apoptotic activities (27). p21 also suppresses the induction of pro-apoptotic genes by MYC and E2F1 through direct binding and inhibition of their transactivation functions (2, 27). We have not observed enhanced apoptosis in the cells/organs of fasted p21-null mice (data not shown). However, other family members (p27) may compensate for loss of p21 function under these conditions. Additional studies will be required to mechanistically decipher the contributions of p21 under conditions of metabolic stress.
Acknowledgments
We thank Jinwu Sun for generating the conditional p21 targeting vector and for screening clones, Catherine Kusmicki for assistance with cloning and Philippe Soriano for providing pBigT plasmid. Anne Brunet is thanked for her generous gift of FOXO1 antibody for ChIP and Ashley Webb is thanked for providing advice on the ChIP protocol. We thank Ron DePinho for providing FOXO1f/f mice, Shin Imai for providing Albumin-Cre mice, Mike White for performing blastocyst injections, Emily Powell for editorial assistance, Reece Goiffon for statistical assistance, and Clay Semenkovich and Trey Coleman for assistance with metabolic analysis. Finally, we thank the Alvin J. Siteman Cancer Center at Washington University School of Medicine and Barnes-Jewish Hospital for the use of the Embryonic Stem Cell Core and electroporation services. The Alvin J. Siteman Cancer Center is supported in part by an NCI Cancer Center Support Grant (P30 CA91842).
This study was supported in part by National Institutes of Health Grants P50 CA94056 to the Molecular Imaging Center at Washington University, P60 DK 20579 to the Diabetes Research Core at Washington University, P30 NS057105 to Washington University, P30 AR048335 to the Rheumatic Disease Core Center for Speed Congenics at Washington University, MH63140 (to E. D. H.), and by a Department of Defense Prostate Cancer Research Program Training Award Grant (PC101951) (to K. L. T.).
- CDK
- cyclin-dependent kinase
- BLI
- bioluminescence imaging
- FOXO1
- Forkhead Box O1
- FOXO3
- Forkhead Box O3
- KO
- knockout
- NT
- N terminus.
REFERENCES
- 1. Tinkum K. L., Marpegan L., White L. S., Sun J., Herzog E. D., Piwnica-Worms D., Piwnica-Worms H. (2011) Bioluminescence imaging captures the expression and dynamics of endogenous p21 promoter activity in living mice and intact cells. Mol. Cell. Biol. 31, 3759–3772 [DOI] [PMC free article] [PubMed] [Google Scholar]
- 2. Abbas T., Dutta A. (2009) p21 in cancer: intricate networks and multiple activities. Nat. Rev. Cancer 9, 400–414 [DOI] [PMC free article] [PubMed] [Google Scholar]
- 3. Seoane J., Le H. V., Shen L., Anderson S. A., Massagué J. (2004) Integration of Smad and forkhead pathways in the control of neuroepithelial and glioblastoma cell proliferation. Cell 117, 211–223 [DOI] [PubMed] [Google Scholar]
- 4. Postic C., Magnuson M. A. (2000) DNA excision in liver by an albumin-Cre transgene occurs progressively with age. Genesis 26, 149–150 [DOI] [PubMed] [Google Scholar]
- 5. Marpegan L., Swanstrom A. E., Chung K., Simon T., Haydon P. G., Khan S. K., Liu A. C., Herzog E. D., Beaulé C. (2011) Circadian regulation of ATP release in astrocytes. J. Neurosci. 31, 8342–8350 [DOI] [PMC free article] [PubMed] [Google Scholar]
- 6. Paxions G., Franklin K. B. J. (2001) The Mouse Brain in Stereotatic Coordinates, 2nd Ed., Academic Press [Google Scholar]
- 7. Abramoff M. D., Magelhaes P. J., Ram S. J. (2004) Image processing with Image J. Biophotonics Int. 11, 36–42 [Google Scholar]
- 8. Chaya D., Zaret K. S., Allis C. D., Carl W. (2003) in Methods in Enzymology, pp. 361–372, Academic Press [Google Scholar]
- 9. Sengupta S., Peterson T. R., Laplante M., Oh S., Sabatini D. M. (2010) mTORC1 controls fasting-induced ketogenesis and its modulation by ageing. Nature 468, 1100–1104 [DOI] [PubMed] [Google Scholar]
- 10. Marshall B. A., Tordjman K., Host H. H., Ensor N. J., Kwon G., Marshall C. A., Coleman T., McDaniel M. L., Semenkovich C. F. (1999) Relative hypoglycemia and hyperinsulinemia in mice with heterozygous lipoprotein lipase (LPL) deficiency. Islet LPL regulates insulin secretion. J. Biol. Chem. 274, 27426–27432 [DOI] [PubMed] [Google Scholar]
- 11. He T.-C., Zhou S., da Costa L. T., Yu J., Kinzler K. W., Vogelstein B. (1998) A simplified system for generating recombinant adenoviruses. Proc. Natl. Acad. Sci. U.S.A. 95, 2509–2514 [DOI] [PMC free article] [PubMed] [Google Scholar]
- 12. Gross S., Abraham U., Prior J. L., Herzog E. D., Piwnica-Worms D. (2007) Continuous delivery of D-luciferin by implanted micro-osmotic pumps enables true real-time bioluminescence imaging of luciferase activity in vivo. Mol. Imaging 6, 121–130 [PubMed] [Google Scholar]
- 13. Brunet A., Bonni A., Zigmond M. J., Lin M. Z., Juo P., Hu L. S., Anderson M. J., Arden K., Blenis J., Greenberg M. E. (1999) Akt promotes cell survival by phosphorylating and inhibiting a forkhead transcription factor. Cell 96, 857–868 [DOI] [PubMed] [Google Scholar]
- 14. Kops G. J., de Ruiter N. D., De Vries-Smits A. M., Powell D. R., Bos J. L., Burgering B. M. (1999) Direct control of the Forkhead transcription factor AFX by protein kinase B. Nature 398, 630–634 [DOI] [PubMed] [Google Scholar]
- 15. Biggs W. H., 3rd, Meisenhelder J., Hunter T., Cavenee W. K., Arden K. C. (1999) Protein kinase B/Akt-mediated phosphorylation promotes nuclear exclusion of the winged helix transcription factor FKHR1. Proc. Natl. Acad. Sci. U.S.A. 96, 7421–7426 [DOI] [PMC free article] [PubMed] [Google Scholar]
- 16. Jacobs F. M., van der Heide L. P., Wijchers P. J., Burbach J. P., Hoekman M. F., Smidt M. P. (2003) FoxO6, a novel member of the FoxO class of transcription factors with distinct shuttling dynamics. J. Biol. Chem. 278, 35959–35967 [DOI] [PubMed] [Google Scholar]
- 17. Nakae J., Barr V., Accili D. (2000) Differential regulation of gene expression by insulin and IGF-1 receptors correlates with phosphorylation of a single amino acid residue in the forkhead transcription factor FKHR. The EMBO J. 19, 989–996 [DOI] [PMC free article] [PubMed] [Google Scholar]
- 18. Haeusler R. A., Kaestner K. H., Accili D. (2010) FoxOs function synergistically to promote glucose production. J. Biol. Chem. 285, 35245–35248 [DOI] [PMC free article] [PubMed] [Google Scholar]
- 19. Paik J. H., Kollipara R., Chu G., Ji H., Xiao Y., Ding Z., Miao L., Tothova Z., Horner J. W., Carrasco D. R., Jiang S., Gilliland D. G., Chin L., Wong W. H., Castrillon D. H., DePinho R. A. (2007) FoxOs are lineage-restricted redundant tumor suppressors and regulate endothelial cell homeostasis. Cell 128, 309–323 [DOI] [PMC free article] [PubMed] [Google Scholar]
- 20. Yeo G. S., Heisler L. K. (2012) Unraveling the brain regulation of appetite: lessons from genetics. Nature Neurosci. 15, 1343–1349 [DOI] [PubMed] [Google Scholar]
- 21. Ebert S. M., Monteys A. M., Fox D. K., Bongers K. S., Shields B. E., Malmberg S. E., Davidson B. L., Suneja M., Adams C. M. (2010) The transcription factor ATF4 promotes skeletal myofiber atrophy during fasting. Mol. Endocrinol. 24, 790–799 [DOI] [PMC free article] [PubMed] [Google Scholar]
- 22. Estep P. W., 3rd, Warner J. B., Bulyk M. L. (2009) Short-term calorie restriction in male mice feminizes gene expression and alters key regulators of conserved aging regulatory pathways. PLoS One 4, e5242. [DOI] [PMC free article] [PubMed] [Google Scholar]
- 23. Maddocks O. D., Vousden K. H. (2011) Metabolic regulation by p53. J. Mol. Med. 89, 237–245 [DOI] [PMC free article] [PubMed] [Google Scholar]
- 24. Eijkelenboom A., Burgering B. M. (2013) FOXOs: signalling integrators for homeostasis maintenance. Nat. Rev.. Mol. Cell Biol. 14, 83–97 [DOI] [PubMed] [Google Scholar]
- 25. Zhang K., Li L., Qi Y., Zhu X., Gan B., DePinho R. A., Averitt T., Guo S. (2012) Hepatic suppression of Foxo1 and Foxo3 causes hypoglycemia and hyperlipidemia in mice. Endocrinology 153, 631–646 [DOI] [PMC free article] [PubMed] [Google Scholar]
- 26. Furuyama T., Nakazawa T., Nakano I., Mori N. (2000) Identification of the differential distribution patterns of mRNAs and consensus binding sequences for mouse DAF-16 homologues. Biochem. J. 349, 629–634 [DOI] [PMC free article] [PubMed] [Google Scholar]
- 27. Roninson I. B. (2002) Oncogenic functions of tumour suppressor p21(Waf1/Cip1/Sdi1): association with cell senescence and tumour-promoting activities of stromal fibroblasts. Cancer Letters 179, 1–14 [DOI] [PubMed] [Google Scholar]