Abstract
The aim of the current study was to assess the ability of PET imaging agents to detect early response to therapy in an orthotopic experimental rodent model of glioma. Clinically, MRI and [18F]FDG PET are routinely used but their ability to assess early therapeutic response can be limited. In this study, nude rats were implanted with U87-MG tumors orthotopically and imaged with either [18F]FDG or [18F]FLT to determine which tracer acts as the most sensitive biomarker for evaluation of treatment response in animals undergoing anti-angiogenic therapy with sunitinib, a receptor tyrosine kinase (RTK) inhibitor. Of the radiopharmaceuticals tested, [18F]FLT proved to be the most sensitive biomarker in the proliferating glioma, based on tumour-to-normal tissue radiotracer uptake (TNR ~17) in comparison to [18F]FDG (TNR ~1.7). Furthermore, [18F]FLT displayed earlier assessment of therapy efficacy, than either tumour volume measured by MRI or [18F]FDG PET imaging. Overall, longitudinal molecular imaging with [18F]FLT provides earlier detection of therapy response than either of the commonly used clinical imaging modalities potentially improving patient management.
Keywords: PET, glioma, sunitinib, [18F]FLT, [18F]FDG, angiogenesis, orthotopic
Introduction
In recent years, research has focused on the development of anti-angiogenic therapies for the treatment of a variety of cancers including gliomas [1,2]. A number of successful therapies have been produced including the targeted antibody bevacizumab (Avastin®; Genentech) and the receptor tyrosine kinase inhibitor sunitinib (Sutent®; Pfizer). Gliomas are one of the most common forms of brain tumour and prove difficult to treat. High grade glioma are usually associated with elevated angiogenesis which supports neovascularization and extensive diffuse dispersion into the brain [3], hence, many standard therapies prove ineffective [1]. Consequently, the mean survival time for patients with glioma is less than two years, thus, accurate, early monitoring of therapy response is imperative [4]. Anatomical imaging modalities such as MRI and CT are used regularly to diagnose brain tumors, allowing some delineation between normal and pathological anatomy [5]. PET imaging, however, is able to provide molecular information related to tumour pathology such as proliferation rate, tumour metabolism and hypoxia levels, which may be of more practical value for clinical management and therapy selection [5,6].
PET imaging is regularly performed using [18F]fluorodeoxyglucose ([18F]FDG), which provides a measure of glucose metabolism in the tumour and surrounding tissue [7]. However, the clinical utility of [18F]FDG for the detection of brain tumors is complicated by the high basal metabolic rate of the surrounding neural tissues, therefore, low grade or small tumors may exhibit little differential uptake, making visualization difficult [8-10]. Radiolabelled nucleosides have also been investigated such as 3-deoxy-3-[18F]-fluoro-L-thymidine ([18F]FLT) which acts as a surrogate marker for thymidine kinase-1 activity, expressed during the DNA synthesis phase of the cell cycle, thus providing information on the proliferation rate of the tumour. [18F]FLT uptake in proliferating gliomas is high relative to normal brain tissue, hence, potentially providing an excellent marker for later stage and malignant gliomas [8,9,11-14].
Current therapies for recurrent glioma are limited to antiangiogenics, with bevacizumab being the only FDA licensed therapy. Bevacizumab relies on leaky vessels and a damaged blood brain barrier (BBB) to access the tumour, thus therapies that repair the blood brain barrier limit their own availability [15]. The current study investigates the ability of [18F]FDG and [18F]FLT to measure tumour development and assess early therapeutic response in an experimental orthotopic glioma model in response to an alternative antiangiogenic therapy sunitinib (Sutent®, Pfizer), which is an orally bioavailable receptor tyrosine kinase inhibitor, which readily crosses the blood brain barrier.
Materials and methods
Radiochemistry
All chemicals obtained commercially were of analytical grade and used without further purification. Solvents and chemicals were purchased from Sigma-Aldrich (Singapore) unless stated otherwise. Reference compound FLT was purchased from ABX (Radeberg, Germany). [18F]FDG was supplied by Singapore Radio-pharmaceuticals (Singapore).
[18F]FLT
3-Deoxy-3’-[18F]fluorothymidine ([18F]FLT) was produced by nucleophilic fluorination, based on previously described procedures [16]. Radioactive analytical HPLC was performed with a PerkinElmer Series 200 liquid chromatography system (Waltham, MA) equipped single wavelength UV detector and a Flow-Ram NaI/PMT-radiodetector (LabLogic, Sheffield, UK). Thin-layer chromatography was performed on silica gel thin layer chromatography (Sigma-Aldrich, Singapore) and analyzed using an EZ-Scan radio-TLC strip scanner (Carroll & Ramsey, Berkeley, CA). Radio-TLC analysis (silica gel, eluent: 95% aqueous acetonitrile) indicated > 99% radiochemical purity. The radiopharmaceutical identity was confirmed by HPLC (Thermo Aquasil C18 150 × 2.1 mm, 266 nm, 5 μm, guard column; eluent: 14% methanol in water, 0.3 mL/min) and the specific activity was 150–270 GBq/μmol at the end of synthesis (EOS). Impurities were estimated at 0.1–0.6 μg/mL from their absorbance at 266 nm and the molar extinction coefficient of FLT. The final product was a clear and colorless solution (7% ethanol, 0.9% sodium chloride, 10 mM phosphate) at pH 7 (1.0–2.0 GBq/mL at EOS).
Preparation of tumour-bearing rats
Forty male athymic nude CBH/RNu/Nu rats (250-300 g) were purchased from The Animal Resources Centre (Canning Vale, Western Australia). Animal experiments were performed in accordance with the Institutional Animal Care and Use Committee (IACUC) guidelines.
Human glioma cells
Human glioma cancer cells, U87-MG, were purchased from the American Type Culture Collection (ATCC, Manassas, VA). Cells were cultured in Dulbecco’s modified Eagle medium (DMEM, Invitrogen), supplemented with 10% fetal bovine serum, 100 U/mL penicillin and 100 μg/mL streptomycin, at 37°C in a humidified atmosphere, with 5% of CO2.
Stereotactic implantation
All surgical procedures were conducted under anaesthesia; 5% isoflurane for induction and 2% for maintenance in air/O2 1:1 (vol:vol). Rectal temperature was monitored and maintained at 37.0 ± 0.5°C throughout the experiments using a rectal probe connected to an electric heating blanket (M2M imaging Corporation, Cleveland, OH). U87-MG cells were trypsinized, washed twice and resuspended in L-15 medium. U87-MG cells (7.5 × 10⁴ cells in 2 μL) were stereotactically injected into the right striatum in a total of 40 male athymic nude CBH/RNu/Nu rats, as previously described [17]. Initially for the biomarker study 10 animals were inoculated and assessed for tumour growth using T2 weighted MRI. Tumors were successfully developed in 8 animals which were assessed for radiotracer uptake (with [18F]FDG or [18F]FLT) at 16 days post inoculation. Subsequently, a further 30 animals were implanted as described above and subsequently 24 were assessed for therapy efficacy longitudinally with T2 weighted MRI, [18F]FDG and [18F]FLT PET imaging from 6 days post inoculation.
Randomization of animals
Out of 30 male athymic nude CBH/RNu/Nu rats inoculated with U-87MG cells, 29 animals had successful tumour development. T2 weighted MRI was used to assess tumour growth. For the therapy efficacy study, of the 29 tumor-bearing animals, 24 with similar sized tumors were chosen for the assessment of therapy efficacy with [18F]FLT or [18F]FDG (12 in each group, where half the animals received sunitinib and the other half vehicle).
Dosing regime
At 6 days post stereotactic inoculation of U87-MG tumour cells, the rats were divided into 2 treatment groups. One group received administrations of sunitinib (Selleck pharmaceuticals, Houston, TX), at a dose of 60 mg/kg by oral gavage, whilst the second group received oral administrations of the vehicle alone (water containing hydrochloric acid; pH 3.5 ± 0.2, 0.5% polysorbate, 10% polyethylene glycol). The tumour-bearing animals were treated with sunitinib or vehicle alone using a five-day-on/two-day-off treatment cycle (5/2 schedule) previously described by de Boüard et al. [1].
MRI imaging
Magnetic resonance imaging was performed on all animals to assess tumour growth and response to therapy. MRI imaging was performed with a horizontal bore magnet, operating at 400 MHz (7 T) with a 22 cm diameter (Bruker Cliniscan, Ettlingen, Germany), and equipped with actively shielded magnetic field gradient coils, and a linear volume coil (72 mm bore diameter; Bruker). From Day 6 post tumour implantation (0.28 ± 0.08 mm3) and throughout the duration of the study the volumes of the tumors were evaluated using T2-weighted MRI without contrast enhancement. Rapid imaging (three images in axial, coronal and sagittal orientations; FLASH sequence; repetition time TR/TE = 10/2 ms; nominal resolution 0.18 × 0.18 × 1.02 mm3, acquisition time = 9 s) was performed for subsequent slice positioning. The tumour volume was acquired using a fast T2w sequence (RARE sequence with rare factor of 9; TR/TEeff = 2500/58 ms; number of experiments = 4 with 12 contiguous slices; nominal resolution 0.12 × 0.12 × 0.70 mm3; acquisition time = 12 min). A three-dimensional (3D) FLASH sequence was acquired with the same transaxial and rostrocaudal field of view (FOV) as the microPET FOV, i.e. 100 × 100 × 127 mm (TR/TEeff = 400/4.81 ms; NEX = 1; nominal resolution 0.78 × 0.78 × 0.78 mm3; acquisition time = 1 min) for co-registration. Total acquisition time per animal was approx. 20 min. MRI imaging dates were coregistered with the PET imaging for all experiments, Figure 1. Tumor volume was calculated from the T2 weighted images by drawing a region of interest around the tumor border manually on each slice and multiplying by the slice thickness (Syngo Fast View, Siemens USA).
Figure 1.
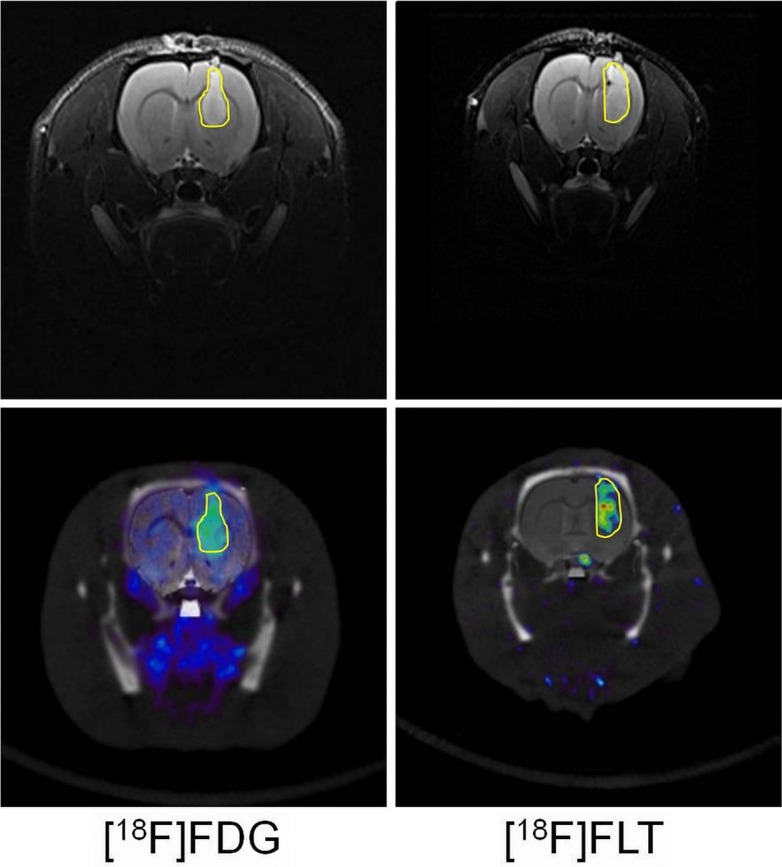
Top row shows orthotopic tumors measured by T2 weighted MRI at Day 20, tumour border is delineated in yellow. Bottom row shows tumour uptake of [18F]FDG or [18F]FLT following intravenous bolus injection. Images show static acquisition data from 40–60 or 30–50 min respectively, tumour border from MRI data is outlined in yellow on the PET data for reference.
Small-animal PET/CT imaging
Small-animal PET imaging was performed on an Inveon PET/CT system (Siemens Inc., Washington DC). Images were generated from sinogram data, rebinned to 2-dimensional format by the Fourier rebinning algorithm, followed by 2-dimensional filtered back projection. The microPET scanner was calibrated in terms of absolute activity concentration (kBq/cm3) by imaging a phantom approximating the dimensions of a rat body and filled with a known concentration of [18F]fluoride.
For the ‘static’ imaging protocols, the [18F]FDG animals were fasted for 12 hours and images were acquired at 40-60 min post injection (p.i.). The ‘static’ [18F]FLT images were acquired 30-50 min p.i.. Approximately 20 MBq of the 18F-labelled radiopharmaceuticals were injected via the lateral tail vein (in an injection volume of not more than 5 mL/kg). The animals were anaesthetized using inhalational isoflurane at 2% alveolar concentration and fixed using stereotactic ear bars to a custom made PET imaging bed (ASI instruments, Warren, MI) for acquisition of the PET data and a CT scan was performed for anatomical placement and attenuation correction (40 kV, 500 μA; 4 × 4 binning, ~100 μm resolution, ensuring a total radiation dose within safe exposure limits of ~15 mGy, thus limiting the tumour radiation effects as much as possible). Images were reconstructed using the image reconstruction, visualization, and analysis software supplied by the manufacturer. Small animal PET and CT data were analyzed by using Amide software (Sourceforge 10.1, http://amide.sourceforge.net). The PET, CT and MRI images were co-registered to confirm anatomical location of the tumors. Uptake of radioactivity in the tumour was determined by placement of a Volume of Interest (VOI) around the tumour border delineated using the MRI images and presented as percent injected dose/gram (%ID/g). A VOI was also placed around an identical volume of the normal contralateral brain hemisphere, to provide normal brain reference tissue values and presented as percent injected dose/gram (%ID/g). These tumour and normal brain tissue values were used to determine a tumour to normal brain tissue ratio (TNR) to assess which radiotracer acts as the best biomarker for tumour detection.
For the therapy efficacy study, the animals were repeatedly imaged using the same protocol as above on days 6, 9, 13, 16, 20 and 22 post-inoculation (0, 3, 7, 10, 14 or 16 days post initiation of the dosing regimen). Therapy efficacy was assessed by group comparison on each imaging day (2-tailed, non-paired, t-test).
Immunohistochemical analysis of therapy response
On the last imaging day (Day 22 post inoculation), once assayed for radioactivity, the brains were immediately removed and fixed in neutral buffered formalin. The microvasculature density (MVD) of the tumors was quantified using a method previously described by Wedge et al. [18]. Tumour specimens were fixed and stained for CD31 using a chromogen endpoint, and analyzed in a blind to treatment manner using a KS400 instrument (Advanced Molecular Pathology labs, IMCB, Singapore). MVD was calculated as the CD31-positive vessel number per mm2 viable glioma tumour area in each brain section and normalised to the average of the vehicle specimens. The same brains were assessed for Ki67 staining using a method previously described by Viel et al [14]. Tumor specimens were treated with proteinase K at room temperature for 5 minutes, 5% serum blocking solution for 10 minutes and incubated overnight at 4°C with anti-human Ki67 monoclonal antibody diluted 1:75 (Dako), and visualized with a secondary antibody and DAB staining. Slides were analyzed in a blind to treatment manner using a Leica SCN400 slide scanner (Leica Microsystems, Germany) using the Measure Stained Cells algorithms of Slidepath Tissue IA software (Leica Microsystems, Germany). Scanning and image analysis was performed by the Advanced Molecular Pathology Laboratory, IMCB, Singapore.
Results
Effect of sunitinib on U87-MG brain tumour volume
Figures 2 and 3 illustrate the changes in tumour volume from Day 6 post tumour implantation (0.28 ± 0.08 mm3) over the course of the study in vehicle-treated and sunitinib-treated animals. The T2w MRI data show retardation of tumour growth in the sunitinib treated animals that reached significance by Day 16 (10 days post therapy initiation, n = 10, p < 0.01, 2-tailed, non-paired, t-test).
Figure 2.
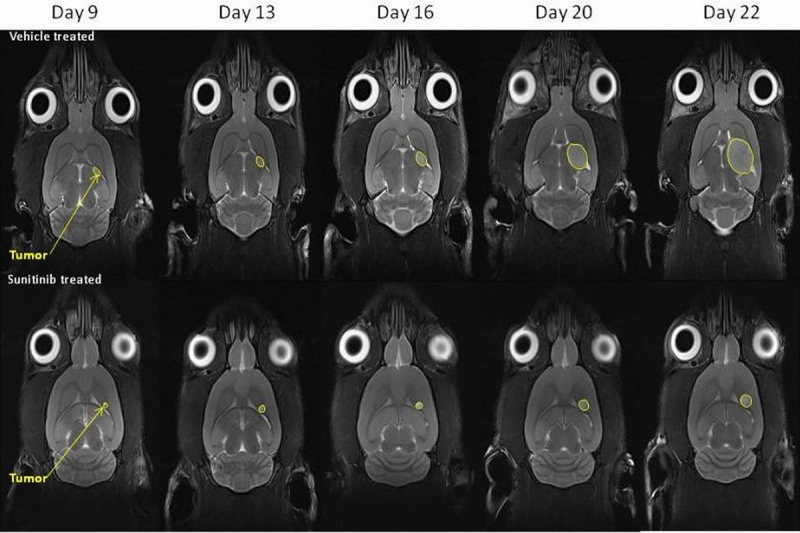
Representative T2 weighted MRI images depicting glioma tumour sizes at the imaging time points in the vehicle-treated animals and sunitinib-treated animals (tumors are indicated by yellow arrows).
Figure 3.
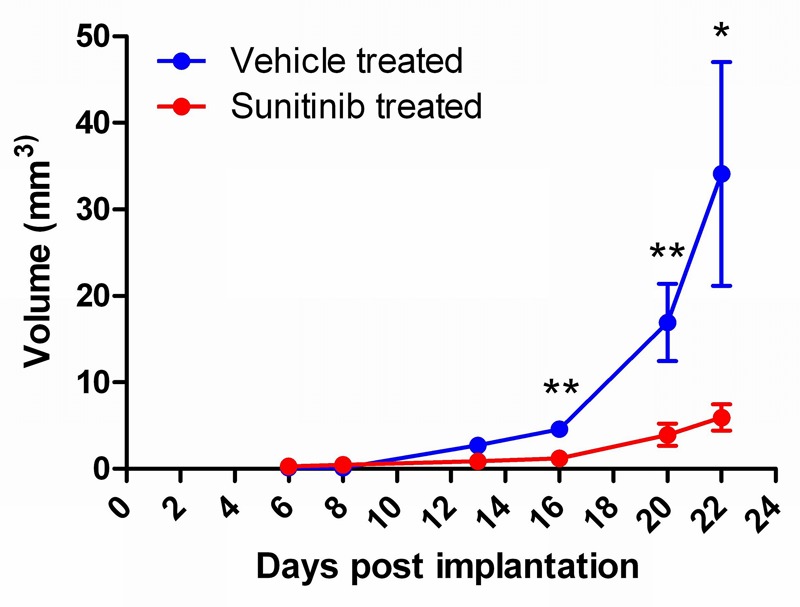
Graph showing glioma tumour volume in mm3 ± SEM. at the imaging time points in the vehicle-treated animals and sunitinib-treated animals (n = 5, *p < 0.05, **p < 0.01).
Effect of sunitinib on U87-MG tumour retention of [18F]FDG and [18F]FLT
Tumour retention of [18F]FDG was significantly lower (2 tailed t-test) in the sunitinib-treated group (1.34 ± 0.09 %ID/g) compared to the vehicle-treated group (1.84 ± 0.06 %ID/g, mean ± SEM, n = 6) by day 22 only (p < 0.05, 16 days post therapy initiation), as can be seen in Figure 4. Overall, retention of [18F]FDG in normal brain tissue stayed stable throughout the study in both the vehicle-treated and sunitinib-treated animals. The [18F]FDG retention measured in the sunitinib-treated group and the vehicle treated group is shown in Table 1.
Figure 4.
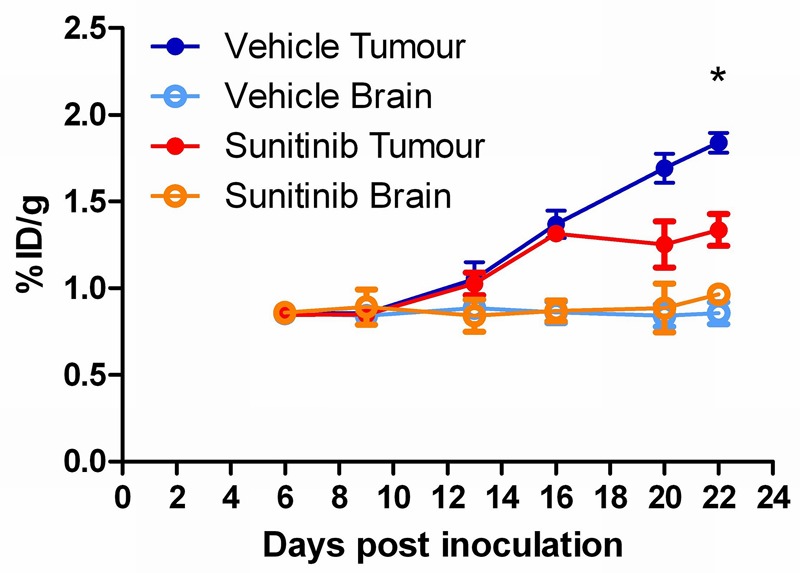
Longitudinal assessment of sunitinib therapy response using [18F]FDG in an orthotopic glioma model (%ID/g ± SEM; n = 6; *p < 0.05).
Table 1.
Table displaying the %ID/g uptake (mean ± SEM) of [18F]FDG in glioma tissue and contralateral normal brain issue at each of the days post implantation studied
| [18F]FDG | Sunitinib treated (%ID/g) | Vehicle treated (%ID/g) | ||
|---|---|---|---|---|
|
| ||||
| Days post-inoculation | Glioma | Normal brain | Glioma | Normal brain |
| 6 | 0.85 ± 0.01 | 0.86 ± 0.04 | 0.86 ± 0.03 | 0.86 ± 0.02 |
| 9 | 0.85 ± 0.04 | 0.89 ± 0.12 | 0.86 ± 0.03 | 0.84 ± 0.03 |
| 13 | 1.03 ± 0.06 | 0.84 ± 0.12 | 1.05 ± 0.10 | 0.89 ± 0.03 |
| 16 | 1.32 ± 0.02 | 0.87 ± 0.06 | 1.37 ± 0.08 | 0.86 ± 0.06 |
| 20 | 1.25 ± 0.13 | 0.89 ± 0.14 | 1.69 ± 0.08 | 0.84 ± 0.06 |
| 22 | 1.34 ± 0.09 | 0.97 ± 0.03 | 1.84 ± 0.06 | 0.86 ± 0.06 |
The tumour retention of [18F]FLT, however, was significantly attenuated (2-tailed t-test) in the sunitinib-treated group (0.06 ± 0.01 %ID/g) compared to the vehicle-treated group (0.11 ± 0.01 %ID/g, mean ± SEM, n = 6) from day 13 (p < 0.05) onward (7 days post-therapy initiation), as seen in Figure 5. Again, the uptake of [18F]FLT in normal brain tissue remained stable throughout the study in both treated groups. The [18F]FLT uptake is summarized in Table 2.
Figure 5.
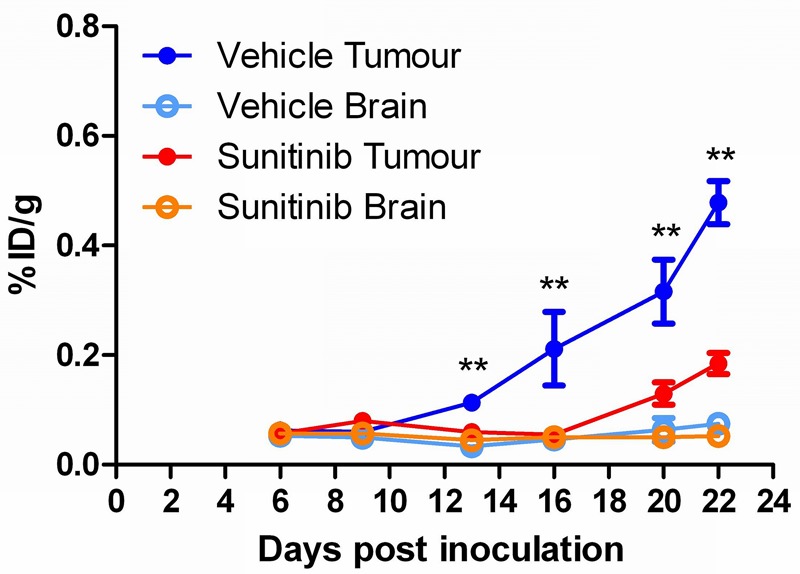
Longitudinal assessment of sunitinib therapy response using [18F]FLT in an orthotopic glioma model (%ID/g ± SEM; n = 6; *p < 0.05).
Table 2.
Table displaying the %ID/g uptake (mean ± SEM) of [18F]FLT in glioma tissue and contralateral normal brain issue at each of the days post implantation studied
| [18F]FDG | Sunitinib treated (%ID/g) | Vehicle treated (%ID/g) | ||
|---|---|---|---|---|
|
| ||||
| Days post-inoculation | Glioma | Normal brain | Glioma | Normal brain |
| 6 | 0.06 ± 0.003 | 0.06 ± 0.003 | 0.06 ± 0.01 | 0.05 ± 0.01 |
| 9 | 0.08 ± 0.012 | 0.06 ± 0.012 | 0.06 ± 0.00 | 0.05 ± 0.01 |
| 13 | 0.06 ± 0.011 | 0.05 ± 0.003 | 0.11 ± 0.01 | 0.03 ± 0.01 |
| 16 | 0.06 ± 0.009 | 0.05 ± 0.007 | 0.21 ± 0.07 | 0.05 ± 0.01 |
| 20 | 0.13 ± 0.020 | 0.05 ± 0.001 | 0.32 ± 0.06 | 0.06 ± 0.02 |
| 22 | 0.19 ± 0.019 | 0.05 ± 0.011 | 0.48 ± 0.04 | 0.08 ± 0.01 |
Immunohistochemical analysis of therapy response
After 16 days of therapy, significantly lower amounts of CD31-positive staining were observed in the sunitinib-treated gliomas compared to the vehicle-treated (~50%, p < 0.05, Figures 6A, 7A and 7C) indicating a lower micro-vessel density. At the same time point, significantly lower staining of Ki67 was observed in the sunitinib-treated gliomas compared to the vehicle-treated (~65%, p < 0.01, Figures 6B, 7B and 7D) showing a reduction in tumour cell proliferation.
Figure 6.
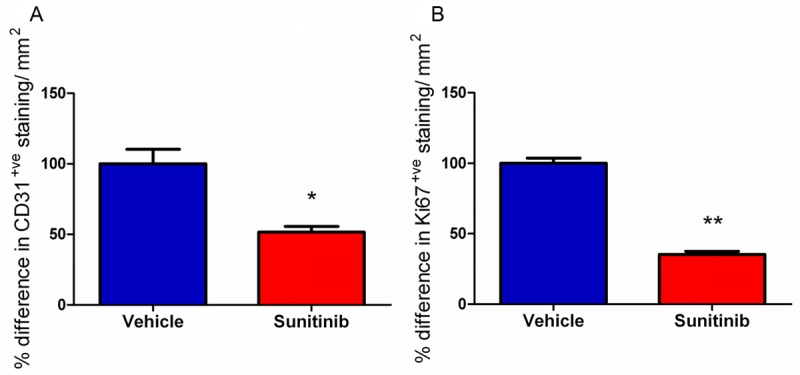
Representative glioma tumor sections were taken 22 days after tumour inoculation (16 days after initiation of therapy dosing regimen with sunitinib or vehicle administration, and were analyzed for glioma microvascular density (MVD) after staining for endothelial cells with CD31 and for proliferation by staining for Ki67. Both MVD measurement of angiogenesis and Ki67 staining for proliferation were significantly lower in glioma tumors from sunitinib-treated rats than in vehicle treated rats 22 days after inoculation (*p < 0.05, **p < 0.01). Data shown as the relative difference in CD31/Ki67-positive staining per mm2 normalized to the average of the vehicle specimens.
Figure 7.
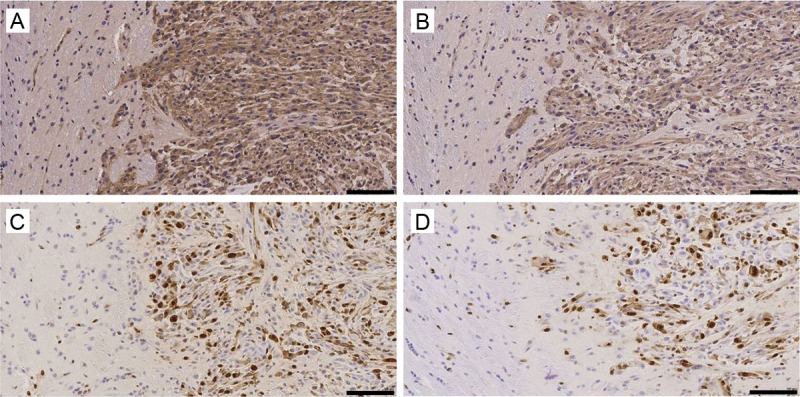
Representative tumor sections were taken from both treated and vehicle treated tumors 22 days after initiation of the therapy regime. Sections from the vehicle treated tumors were analysed for MVD using CD31 staining (A) and proliferation using Ki67 staining (C) and compared to sunitinib treated CD31 staining (B) and Ki67 stained sections (D, — = 100 μm).
Discussion
Two-dimensional tumour measurements derived from magnetic resonance imaging (MRI) are the current clinical standard for assessment of therapy response in gliomas. Contrast enhanced MRI imaging can be used to measure therapy efficacy in gliomas, however, the contrast agents rely on the leakiness of vessels surrounding the glioma. As anti-angiogenic therapies normalize tumour vasculature, this could potentially hamper interpretation of therapy response [15]. Therefore, PET based molecular imaging may provide a more accurate assessment of efficacy for this class of therapeutics.
Anti-angiogenics have been shown to be of benefit in the treatment of gliomas, yielding smaller tumors and improving progression-free survival in patients [5]. The anti-VEGF monoclonal antibody bevacizumab (Avastin©, Genentech/Roche) has been approved by the FDA for the management of patients with recurrent glioma. Previous studies using PET imaging to assess therapy response with bevacizumab, confirm that [18F]FDG and [18F]FLT are good biomarkers for monitoring treatment efficacy in rapidly growing tumors [19-21]. However, as previously stated, bevacizumab relies on leaky vessels surrounding the glioma and a damaged blood brain barrier (BBB) for access to the tumour, and hence therapeutic response, which in itself can be self-limiting, as bevacizumab induces partial vessel repair and normalization of the BBB [15]. In contrast, receptor tyrosine kinase inhibitors, such as sunitinib (Sutent©, Pfizer), which indirectly target both VEGF and PDGF, have no such BBB issues, as they are not substrates for ABC transporters and specifically target endothelial cells [22]. Nevertheless, sunitinib has been used to treat glioma clinically with varying degrees of success depending on tumour type and staging [15,23-26]. Pre-clinical non-invasive molecular imaging has been used to determine the efficacy of sunitinib in peripheral tumors [27-31]; however few studies have investigated the efficacy of sunitinib in an orthotopic glioma model using molecular imaging [32].
The current preclinical study demonstrates that [18F]FLT PET acts as a superior prognostic imaging biomarker for early therapy response to receptor tyrosine kinase inhibitors when compared to [18F]FDG PET. In the current model, sunitinib treatment successfully attenuated orthotopic tumour growth, displaying a retarded growth rate, yielding a significantly smaller tumour volume in the treated animals by day 16 (10 days post-initiation of therapy) assessed using T2 weighted MRI. In contrast to the MRI data, [18F]FDG displayed significant therapeutic effect only by day 22 (16 days post therapy) displaying relative insensitivity to therapy efficacy. Therapy efficacy was corroborated at Day 22 by the reduction in the MVD and proliferation rates in sunitinib treated tumors compared to vehicle treatment as shown in Figure 6. The apparent lack of [18F]FDG sensitivity may be due to the high expression of the glucose transporter GLUT2 on glioma tumour cells themselves, thus making the assessment of changes in [18F]FDG retention due to therapy efficacy difficult to quantify [9,14]. Indeed, both clinical and preclinical studies have indicated difficulties in [18F]FDG characterization of tumors in the brain due to the high basal glucose metabolic rate of adjacent normal brain tissue explaining the low TNR in this study (~1.7). Clinically [18F]FDG uptake in low-grade tumors has been shown to be similar to that of normal white matter, whilst that of high grade tumor uptake is similar to that of normal gray matter [33,34].
The nucleoside analogue [18F]FLT is of particular interest in glioma research as there is little accumulation in normal brain tissue, resulting in high TNR ratios which have been corroborated in this study (TNR ~17). [18F]FLT displays relatively low normal brain tissue uptake due to the fact that neurons and glia are post-mitotic and fully differentiated, hence the expression level of thymidine kinase-1, is very low [5,35]. Due to this low normal brain uptake [18F]FLT PET has the advantage that it may prove useful in detecting tumor recurrence [5].
In the current report, [18F]FLT displayed a significant attenuation in uptake in the sunitinib treated tumors at day 13 post-implantation, only 7 days after initiation of the dosing regimen, where no significant difference in tumour size had yet been seen by MRI. The reason for this early therapy response lies in the mechanism of action of [18F]FLT, as a marker of cell proliferation [36,37] and its low normal brain uptake. However, low [18F]FLT uptake in the healthy brain also reflects the limited transport of thymidine analogs across the intact BBB [35]. The limited ability of [18F]FLT to cross intact BBB may limit the sensitivity to detect early tumor development. As [18F]FLT is only retained in brain tumors where there is a breakdown of the BBB, one potential concern is that [18F]FLT may be largely tracking the patency of the BBB [8,15].
Overall, these data demonstrate the value of longitudinal molecular imaging using the PET radiopharmaceutical [18F]FLT, for monitoring therapy response in glioma; repeated imaging of the same subject allows the thymidine kinase activity to be easily followed over time, allowing very rapid assessment of therapy response providing invaluable clinical information and potentially improving patient treatment.
Acknowledgements
The authors would like to acknowledge the kind support of the BMRC, A*STAR for the funding of this research.
Disclosure of conflict of interest
The authors declare that they have no conflict of interest.
References
- 1.de Bouard S, Herlin P, Christensen JG, Lemoisson E, Gauduchon P, Raymond E, Guillamo JS. Antiangiogenic and anti-invasive effects of sunitinib on experimental human glioblastoma. Neuro Oncol. 2007;9:412–423. doi: 10.1215/15228517-2007-024. [DOI] [PMC free article] [PubMed] [Google Scholar]
- 2.Fratto ME, Imperatori M, Vincenzi B, Tomao F, Santini D, Tonini G. New perspectives: role of Sunitinib in breast cancer. Clin Ter. 2011;162:251–257. [PubMed] [Google Scholar]
- 3.Wesseling P, Ruiter DJ, Burger PC. Angiogenesis in brain tumors; pathobiological and clinical aspects. J Neurooncol. 1997;32:253–265. doi: 10.1023/a:1005746320099. [DOI] [PubMed] [Google Scholar]
- 4.Miyake K, Shinomiya A, Okada M, Hatakeyama T, Kawai N, Tamiya T. Usefulness of FDG, MET and FLT-PET studies for the management of human gliomas. J Biomed Biotechnol. 2012;2012:205818. doi: 10.1155/2012/205818. [DOI] [PMC free article] [PubMed] [Google Scholar]
- 5.Schwarzenberg J, Czernin J, Cloughesy TF, Ellingson BM, Pope WB, Geist C, Dahlbom M, Silverman DH, Satyamurthy N, Phelps ME, Chen W. 3’-deoxy-3’-18F-fluorothymidine PET and MRI for early survival predictions in patients with recurrent malignant glioma treated with bevacizumab. J Nucl Med. 2012;53:29–36. doi: 10.2967/jnumed.111.092387. [DOI] [PMC free article] [PubMed] [Google Scholar]
- 6.Jeong SY, Lim SM. Comparison of 3’-deoxy-3’-[(18)F] fluorothymidine PET and O-(2-[(18)F] fluoroethyl)-L-tyrosine PET in patients with newly diagnosed glioma. Nucl Med Biol. 2012;39:977–81. doi: 10.1016/j.nucmedbio.2012.02.009. [DOI] [PubMed] [Google Scholar]
- 7.Wu HM, Huang SC, Choi Y, Hoh CK, Hawkins RA. A modeling method to improve quantitation of fluorodeoxyglucose uptake in heterogeneous tumor tissue. J Nucl Med. 1995;36:297–306. [PubMed] [Google Scholar]
- 8.Chen W, Cloughesy T, Kamdar N, Satyamurthy N, Bergsneider M, Liau L, Mischel P, Czernin J, Phelps ME, Silverman DH. Imaging proliferation in brain tumors with 18F-FLT PET: comparison with 18F-FDG. J Nucl Med. 2005;46:945–952. [PubMed] [Google Scholar]
- 9.Gulias B, Halldin C. New PET radiopharmaceuticals beyond FDG for brain tumor imaging. Q J Nucl Med Mol Imaging. 2012;56:173–190. [PubMed] [Google Scholar]
- 10.van Waarde A, Cobben DC, Suurmeijer AJ, Maas B, Vaalburg W, de Vries EF, Jager PL, Hoekstra HJ, Elsinga PH. Selectivity of 18F-FLT and 18F-FDG for differentiating tumor from inflammation in a rodent model. J Nucl Med. 2004;45:695–700. [PubMed] [Google Scholar]
- 11.Backes H, Ullrich R, Neumaier B, Kracht L, Wienhard K, Jacobs AH. Noninvasive quantification of 18F-FLT human brain PET for the assessment of tumour proliferation in patients with high-grade glioma. Eur J Nucl Med Mol Imaging. 2009;36:1960–1967. doi: 10.1007/s00259-009-1244-4. [DOI] [PMC free article] [PubMed] [Google Scholar]
- 12.Bradbury MS, Hambardzumyan D, Zanzonico PB, Schwartz J, Cai S, Burnazi EM, Longo V, Larson SM, Holland EC. Dynamic small-animal PET imaging of tumor proliferation with 3’-deoxy-3’-18F-fluorothymidine in a genetically engineered mouse model of high-grade gliomas. J Nucl Med. 2008;49:422–429. doi: 10.2967/jnumed.107.047092. [DOI] [PMC free article] [PubMed] [Google Scholar]
- 13.Muzi M, Spence AM, O’Sullivan F, Mankoff DA, Wells JM, Grierson JR, Link JM, Krohn KA. Kinetic analysis of 3’-deoxy-3’-18F-fluorothymidine in patients with gliomas. J Nucl Med. 2006;47:1612–1621. [PubMed] [Google Scholar]
- 14.Viel T, Talasila KM, Monfared P, Wang J, Jikeli JF, Waerzeggers Y, Neumaier B, Backes H, Brekka N, Thorsen F, Stieber D, Niclou SP, Winkeler A, Tavitian B, Hoehn M, Bjerkvig R, Miletic H, Jacobs AH. Analysis of the Growth Dynamics of Angiogenesis-Dependent and -Independent Experimental Glioblastomas by Multimodal Small-Animal PET and MRI. J Nucl Med. 2012;53:1135–1145. doi: 10.2967/jnumed.111.101659. [DOI] [PubMed] [Google Scholar]
- 15.Navis AC, Hamans BC, Claes A, Heerschap A, Jeuken JW, Wesseling P, Leenders WP. Effects of targeting the VEGF and PDGF pathways in diffuse orthotopic glioma models. J Pathol. 2011;223:626–634. doi: 10.1002/path.2836. [DOI] [PubMed] [Google Scholar]
- 16.Bourdier T, Greguric I, Roselt P, Jackson T, Faragalla J, Katsifis A. Fully automated one-pot radiosynthesis of O-(2-[18F] fluoroethyl)-L-tyrosine on the TracerLab FX(FN) module. Nucl Med Biol. 2011;38:645–651. doi: 10.1016/j.nucmedbio.2011.01.001. [DOI] [PubMed] [Google Scholar]
- 17.Geletneky K, Kiprianova I, Ayache A, Koch R, Herrero YCM, Deleu L, Sommer C, Thomas N, Rommelaere J, Schlehofer JR. Regression of advanced rat and human gliomas by local or systemic treatment with oncolytic parvovirus H-1 in rat models. Neuro Oncol. 2010;12:804–814. doi: 10.1093/neuonc/noq023. [DOI] [PMC free article] [PubMed] [Google Scholar]
- 18.Wedge SR, Kendrew J, Hennequin LF, Valentine PJ, Barry ST, Brave SR, Smith NR, James NH, Dukes M, Curwen JO, Chester R, Jackson JA, Boffey SJ, Kilburn LL, Barnett S, Richmond GH, Wadsworth PF, Walker M, Bigley AL, Taylor ST, Cooper L, Beck S, Jurgensmeier JM, Ogilvie DJ. AZD2171: a highly potent, orally bioavailable, vascular endothelial growth factor receptor-2 tyrosine kinase inhibitor for the treatment of cancer. Cancer Res. 2005;65:4389–4400. doi: 10.1158/0008-5472.CAN-04-4409. [DOI] [PubMed] [Google Scholar]
- 19.Colavolpe C, Chinot O, Metellus P, Mancini J, Barrie M, Bequet-Boucard C, Tabouret E, Mundler O, Figarella-Branger D, Guedj E. FDG-PET predicts survival in recurrent high-grade gliomas treated with bevacizumab and irinotecan. Neuro Oncol. 2012;14:649–657. doi: 10.1093/neuonc/nos012. [DOI] [PMC free article] [PubMed] [Google Scholar]
- 20.Harris RJ, Cloughesy TF, Pope WB, Nghiemphu PL, Lai A, Zaw T, Czernin J, Phelps ME, Chen W, Ellingson BM. 18F-FDOPA and 18F-FLT positron emission tomography parametric response maps predict response in recurrent malignant gliomas treated with bevacizumab. Neuro Oncol. 2012;14:1079–1089. doi: 10.1093/neuonc/nos141. [DOI] [PMC free article] [PubMed] [Google Scholar]
- 21.Corroyer-Dulmont A, Peres EA, Petit E, Guillamo JS, Varoqueaux N, Roussel S, Toutain J, Divoux D, Mackenzie ET, Delamare J, Ibazizene M, Lecocq M, Jacobs AH, Barre L, Bernaudin M, Valable S. Detection of glioblastoma response to temozolomide combined with bevacizumab based on muMRI and muPET imaging reveals [18F] -fluoro-L-thymidine as an early and robust predictive marker for treatment efficacy. Neuro Oncol. 2013;15:41–56. doi: 10.1093/neuonc/nos260. [DOI] [PMC free article] [PubMed] [Google Scholar]
- 22.Hu S, Chen Z, Franke R, Orwick S, Zhao M, Rudek MA, Sparreboom A, Baker SD. Interaction of the multikinase inhibitors sorafenib and sunitinib with solute carriers and ATP-binding cassette transporters. Clin Cancer Res. 2009;15:6062–6069. doi: 10.1158/1078-0432.CCR-09-0048. [DOI] [PMC free article] [PubMed] [Google Scholar]
- 23.Dimitropoulos K, Giannopoulou E, Argyriou AA, Zolota V, Petsas T, Tsiata E, Kalofonos HP. The effects of anti-VEGFR and anti-EGFR agents on glioma cell migration through implication of growth factors with integrins. Anticancer Res. 2010;30:4987–4992. [PubMed] [Google Scholar]
- 24.Neyns B, Sadones J, Chaskis C, Dujardin M, Everaert H, Lv S, Duerinck J, Tynninen O, Nupponen N, Michotte A, De Greve J. Phase II study of sunitinib malate in patients with recurrent high-grade glioma. J Neurooncol. 2011;103:491–501. doi: 10.1007/s11060-010-0402-7. [DOI] [PubMed] [Google Scholar]
- 25.Reardon DA, Vredenburgh JJ, Coan A, Desjardins A, Peters KB, Gururangan S, Sathornsumetee S, Rich JN, Herndon JE, Friedman HS. Phase I study of sunitinib and irinotecan for patients with recurrent malignant glioma. J Neurooncol. 2011;105:621–627. doi: 10.1007/s11060-011-0631-4. [DOI] [PMC free article] [PubMed] [Google Scholar]
- 26.Kamoun WS, Ley CD, Farrar CT, Duyverman AM, Lahdenranta J, Lacorre DA, Batchelor TT, di Tomaso E, Duda DG, Munn LL, Fukumura D, Sorensen AG, Jain RK. Edema control by cediranib, a vascular endothelial growth factor receptor-targeted kinase inhibitor, prolongs survival despite persistent brain tumor growth in mice. J. Clin. Oncol. 2009;27:2542–2552. doi: 10.1200/JCO.2008.19.9356. [DOI] [PMC free article] [PubMed] [Google Scholar]
- 27.Liu G, Jeraj R, Vanderhoek M, Perlman S, Kolesar J, Harrison M, Simoncic U, Eickhoff J, Carmichael L, Chao B, Marnocha R, Ivy P, Wilding G. Pharmacodynamic study using FLT PET/CT in patients with renal cell cancer and other solid malignancies treated with sunitinib malate. Clin Cancer Res. 2011;17:7634–7644. doi: 10.1158/1078-0432.CCR-11-1677. [DOI] [PMC free article] [PubMed] [Google Scholar]
- 28.Gan HK, Seruga B, Knox JJ. Sunitinib in solid tumors. Expert Opin Investig Drugs. 2009;18:821–834. doi: 10.1517/13543780902980171. [DOI] [PubMed] [Google Scholar]
- 29.Yuasa T, Tsuchiya N, Urakami S, Horikawa Y, Narita S, Inoue T, Saito M, Yamamoto S, Yonese J, Fukui I, Nakano K, Takahashi S, Hatake K, Habuchi T. Clinical efficacy and prognostic factors for overall survival in Japanese patients with metastatic renal cell cancer treated with sunitinib. BJU Int. 2012;109:1349–1354. doi: 10.1111/j.1464-410X.2011.10534.x. [DOI] [PubMed] [Google Scholar]
- 30.Yuasa T, Takahashi S, Hatake K, Yonese J, Fukui I. Biomarkers to predict response to sunitinib therapy and prognosis in metastatic renal cell cancer. Cancer Sci. 2011;102:1949–1957. doi: 10.1111/j.1349-7006.2011.02054.x. [DOI] [PubMed] [Google Scholar]
- 31.Battle MR, Goggi JL, Allen L, Barnett J, Morrison MS. Monitoring tumor response to antiangiogenic sunitinib therapy with 18F-fluciclatide, an 18F-labeled alphaVbeta3-integrin and alphaV beta5-integrin imaging agent. J Nucl Med. 2011;52:424–430. doi: 10.2967/jnumed.110.077479. [DOI] [PubMed] [Google Scholar]
- 32.Valable S, Petit E, Roussel S, Marteau L, Toutain J, Divoux D, Sobrio F, Delamare J, Barre L, Bernaudin M. Complementary information from magnetic resonance imaging and (18)F-fluoromisonidazole positron emission tomography in the assessment of the response to an antiangiogenic treatment in a rat brain tumor model. Nucl Med Biol. 2011;38:781–793. doi: 10.1016/j.nucmedbio.2011.01.010. [DOI] [PubMed] [Google Scholar]
- 33.Olivero WC, Dulebohn SC, Lister JR. The use of PET in evaluating patients with primary brain tumors: is it useful? J Neurol Neurosurg Psychiatry. 1995;58:250–252. doi: 10.1136/jnnp.58.2.250. [DOI] [PMC free article] [PubMed] [Google Scholar]
- 34.Wong TZ, van der Westhuizen GJ, Coleman RE. Positron emission tomography imaging of brain tumors. Neuroimaging Clin N Am. 2002;12:615–626. doi: 10.1016/s1052-5149(02)00033-3. [DOI] [PubMed] [Google Scholar]
- 35.Saga T, Kawashima H, Araki N, Takahashi JA, Nakashima Y, Higashi T, Oya N, Mukai T, Hojo M, Hashimoto N, Manabe T, Hiraoka M, Togashi K. Evaluation of primary brain tumors with FLT-PET: usefulness and limitations. Clin Nucl Med. 2006;31:774–780. doi: 10.1097/01.rlu.0000246820.14892.d2. [DOI] [PubMed] [Google Scholar]
- 36.Toyohara J, Waki A, Takamatsu S, Yonekura Y, Magata Y, Fujibayashi Y. Basis of FLT as a cell proliferation marker: comparative uptake studies with [3H] thymidine and [3H] arabinothymidine, and cell-analysis in 22 asynchronously growing tumor cell lines. Nucl Med Biol. 2002;29:281–287. doi: 10.1016/s0969-8051(02)00286-x. [DOI] [PubMed] [Google Scholar]
- 37.Troost EG, Bussink J, Slootweg PJ, Peeters WJ, Merkx MA, van der Kogel AJ, Oyen WJ, Kaanders JH. Histopathologic validation of 3’-deoxy-3’-18F-fluorothymidine PET in squamous cell carcinoma of the oral cavity. J Nucl Med. 2010;51:713–719. doi: 10.2967/jnumed.109.071910. [DOI] [PubMed] [Google Scholar]


