Abstract
Objective
To study the mechanism(s) linking insulin resistance (IR) to hepatic fibrosis and the role of the epithelial component in tissue repair and fibrosis in chronic hepatitis C (CHC).
Design
Prospective observational study.
Setting
Tertiary care academic centre.
Patients
78 consecutive patients with CHC.
Main outcome measures
IR, calculated by the oral glucose insulin sensitivity during oral glucose tolerance test; necroinflammatory activity and fibrosis, defined according to Ishak’s score; steatosis, graded as 0 (<5% of hepatocytes), 1 (5–33%), 2 (33–66%) and 3 (>66%). To evaluate the role of the epithelial component in tissue repair and fibrosis, the expansion of the ductular reaction (DR) was calculated by keratin-7 (CK7) morphometry. Nuclear expression of Snail, downregulation of E-cadherin and expression of fibroblast specific protein-1 (FSP1) and vimentin by CK7-positive cells were used as markers of epithelial-mesenchymal transition in DR elements.
Results
IR, the degree of necroinflammation and expansion of the DR (stratified as reactive ductular cells (RDCs), hepatic progenitor cells and intermediate hepatobiliary cells according to morphological criteria) were all associated with the stage of fibrosis. Nuclear Snail expression, E-cadherin downregulation and vimentin upregulation were observed in RDCs. By dual immunofluorescence for CK7 and FSP1, the number of RDCs undergoing epithelial-mesenchymal transition progressively increased together with the necroinflammatory score. By multivariate analysis, total inflammation and insulin resistance were the only factors significantly predicting the presence of advanced fibrosis (Ishak score ≥3) and the expansion of RDCs.
Conclusion
This study indicates that IR is associated with the degree of necroinflammatory injury in CHC and contributes to hepatic fibrosis by stimulating the expansion of RDCs that express epithelial-mesenchymal transition markers.
Chronic HCV hepatitis (CHC) is the main cause of death from liver disease and the leading indication for liver transplantation.1 Progression of CHC to liver cirrhosis depends on a number of disease co-factors, including overweight and steatosis, components of the so-called metabolic syndrome.1,2 Insulin resistance (IR) represents the pathogenetic mechanism of the metabolic syndrome, and it is also an independent risk factor for advanced fibrosis in both non-alcoholic steatohepatitis (NASH) and CHC.3 The mechanisms linking IR to hepatic fibrosis in vivo in CHC are largely unknown.
The pathophysiological mechanism underlying CHC progression is liver fibrosis. Hepatic fibrogenesis is characterised by the activation of extracellular matrix-producing cells with proliferative, synthetic and contractile features.4 They may derive from activation of hepatic stellate cells (HSCs), from circulating fibrocytes and/or from epithelial cells undergoing epithelial-mesenchymal transition (EMT).4,5 Considerable attention is currently being given to the epithelial component of liver repair. The appearance of the ductular reaction (DR) is a common finding in human liver disease.5-8 The elements of the DR contributes to hepatic fibrosis by generating cytokines and chemokines which can recruit and activate myofibroblasts, through EMT.5 This process enables epithelial cells to express mesenchymal properties and it has been recently highlighted as an important progression mechanism in chronic inflammatory conditions of the kidney, lung and the liver.9
To better understand the mechanisms of disease progression in patients with CHC, we have examined the hypothesis that IR might correlate with the histological severity and extent of DR in patients with CHC. We also investigated the expression of different EMT markers in the elements of the DR.
PATIENTS AND METHODS
Patients and clinical data
The study population comprised a series of 78 consecutive Italian patients with CHC who had undergone a liver biopsy at the Ospedali Riuniti Ancona, Italy. The protocol of data collection was part of the common clinical practice in the Clinica di Gastroenterologia, Università Politecnica delle Marche-Ospedali Riuniti Ancona. All subjects were asked to give their informed consent to the use of personal data, analyses and liver biopsy at the time of admission. This specific study was approved by the institutional review boards of Ospedali Riuniti Ancona, regulating non-interventional studies, and by the Italian Ministry of Health.
CHC was defined by elevated transaminase values (for more than 6 months) and the presence of serum HCV/RNA in the absence of other causes of chronic liver injury. Subjects with pharmacologically treated diabetes or previous antiviral treatment were also excluded. The alcohol intake in the past 6 months was assessed by interviews extended to family members and general practitioners, and patients with alcohol consumption >40 g/day were excluded from this study. As controls, we used biopsy samples with normal hepatic histology from subjects who had been submitted to liver biopsy for occasional high transaminases values, in the absence of HCV infection.
Anthropometric and laboratory evaluations
Body mass index (BMI) was calculated as weight (kg)/height squared (m2). Subjects in the BMI range 25–29.9 kg/m2 and >30 kg/m2 were considered overweight and obese, respectively. An oral glucose tolerance test (OGTT) with glucose and insulin determinations every 30 min for 120 min was also performed. Venous plasma glucose was measured in duplicate with an automated analyser (Beckman Instruments, Fullerton, California, USA; interassay coefficient of variation <4%). Basal and glucose-stimulated insulin was measured by an immunoenzymometric assay (AIA-PACK IRI, AIA-1200 system, Tosoh Co, Tokyo, Japan) with intra- and interassay coefficients of variation for quality control <7%.
IR was calculated by the oral glucose insulin sensitivity (OGIS) calculator during OGTT. OGIS, which measures IR in response to glucose load, was previously shown to be a more robust correlate of IR in this liver disease population than homoeostasis model assessment (HOMA).3 Patients were considered to have post-load insulin resistance in the presence of OGIS <9.8 mg/kg/min.8 OGTT was not carried out in three cases, diagnosed as diabetes on the basis of fasting glucose levels. For statistical purposes, these cases were considered to have OGIS <9.8 mg/kg/min.
HCV-RNA was quantified by Quantiplex HCV RNA 2.0 assay (Chiron Diagnostics, Emeryville, California, USA). HCV genotyping was performed with a second-generation reverse hybridisation line probe assay (Inno-Lipa HCVII; Innogenetics, Zwijndrecht, Belgium) and patients were divided according to genotype 3 (CHC-3) and genotype non-3 (CHC-non-3).
Histopathology
Liver biopsies were scored in a blinded manner by an experienced hepato-pathologist (GSB). The degree of necroinflammatory activity was scored 0–18 and the stage of fibrosis 0–6 according to Ishak et al.10 Steatosis was scored according to the criteria proposed by Kleiner et al as 0 (<5% of hepatocytes), 1 (5–33%), 2 (33–66%) and 3 (>66%).11
Immunohistochemistry and morphometric determinations
Formalin-fixed, paraffin-embedded liver biopsy specimens were used.12-15 For the immunohistochemical detection of keratin-7 (CK7, bile duct and ductular reaction, 1:50, DAKO, Milan, Italy), a-smooth muscle actin (αSMA, activated HSC and myofibroblast, 1:100, DAKO) and Snail1 (a transcription factor suppressing E-cadherin expression, 1:200, AbCam, Cambridge, UK), non-specific binding sites were blocked for 30 min at room temperature in phosphate-buffered saline (PBS) containing 3% bovine serum albumin. For single immunostainings, reactive sites were detected by a DAKO Envision peroxidase detection system (DAKO K5007), according to the manufacturer’s instructions.
For the simultaneous visualisation of CK7 and αSMA, a sequential double immunoenzymatic reaction was performed. After the first sequence for CK7 visualisation by peroxidase reactivity which resulted in a brown staining, αSMA reactive sites were visualised by a DAKO Envision alkaline phosphatase detection system (DAKO K5355). For both single and double immunostainings, antigen retrieval was performed according to the manufacturer’s instructions.
Double immunofluorescence staining was performed matching CK7 with different markers of epithelial or mesenchymal phenotype to assess features of transition. Briefly, after deparaffinisation and rehydration, slides were heated in a steamer in 10 mM citrate buffer, pH 6, for 20 min, then slides were incubated with CK7 (raised in mouse, 1:50, DAKO, or goat, 1:100, Santa Cruz, Heidelberg, Germany) matched with each of the following primary antibodies: fibroblast-specific protein-1 (FSP1, an early marker of EMT, 1:400, DAKO), vimentin (marker of the intermediate filament, late marker of EMT 1:100, DAKO), or E-cadherin (an epithelial cell marker whose downregulation is considered a hallmark of EMT, 1:100, DAKO). Then, specimens were rinsed in PBS 1 M supplemented with 0.05% Tween 20 (Sigma, Milan, Italy) and incubated for 30 min at room temperature with the appropriate fluorescent-conjugated secondary antibody (Alexa Fluor 488 or 594, 1:200, Invitrogen, San Giuliano Milanese, Italy). To avoid fluorescence bleaching, specimens were mounted in Vectashield + DAPI (Vector Laboratories, Segrate, Italy). All the antibodies were diluted in PBS (Sigma) supplemented with 5% normal human serum type 0. Pictures of the three different fluorescent channels (red, green and blue) were taken separately with a cooled digital camera (DS-U1, Nikon, Calenzano, Italy) and then merged using the image analysis software LuciaG 5.0 (Nikon). Under these conditions, single labelling appears green (Alexa Fluor 488) or red (Alexa Fluor 594), whereas coincident labelling appears yellow.
The different epithelial elements of the DR were categorised, as previously shown by us, according to Roskams et al8,13,16,17 Reactive ductular cells (RDCs) were defined as CK7-positive cells with biliary phenotype arranged in irregularly shaped structures. Intermediate hepatobiliary cells (IHBCs) were defined as cells with morphology and size intermediate between hepatocytes and cholangiocytes (>6 μm in diameter (the approximate size of the normal canal of Hering cell—that is, the smallest cholangiocyte), but <40 μm (the typical size of a hepatocyte)), with a peculiar pattern of CK7 immunoreactivity, faint on the cytoplasm and reinforced at the plasma membrane. Hepatic progenitor cells (HPCs) were considered as small, oval, or spindle-shaped CK7-positive cells with scant cytoplasm and oval nucleus, alone or in small clamps, localised in the parenchyma or at the portal interface. In digital images of the entire biopsy specimen taken at ×200 magnification the keratin-positive area was calculated as the percentage of pixels above the threshold value with respect to the total pixels per field. The area of the RDCs was then calculated by subtracting the CK7 area related to IHBCs and HPCs, and expressed as a percentage of hepatic parenchyma. The number of IHBCs and HPCs was calculated by counting these cells in the entire biopsy at ×200 final magnification, and expressed as number of cells/field. To evaluate the acinar distribution of DR and its relationship with periportal fibrosis, we selected patients with a histological Ishak stage ≤3 to avoid the architectural derangement of the most advanced cases of chronic liver injury. The different epithelial elements of the DR were considered periportal when located within 150 mm from the portal rim, as opposed to mid-lobular/centrilobular location.12,18
Quantification of αSMA- and Sirius red-positive parenchyma was performed at ×100 final magnification.12 For immunofluorescence, pictures were taken with the Eclipse E800 microscope (Nikon) equipped with a cooled digital camera (Nikon DS-U1, Nikon) and analysed by LuciaG 5.0 software (Nikon). At least five portal spaces in each histological section were analysed at ×200 magnification. CK7-positive elements of the DR coexpressing FSP1 were counted by computer-assisted morphometry and expressed with respect to the overall number of CK7-positive cells lining the DR.
Statistical analysis
A descriptive analysis of data was carried out by calculating the mean and SD or median and IQR for normally and non-normally distributed data, respectively. Comparison between groups was made by two-tail parametric and non-parametric methods, respectively. Correlation analyses were carried out by Spearman test. Later, we tested the association of independent factors with advanced fibrosis (Ishak score ≥3) in a multivariate logistic regression analysis. The presence of IR (defined as the presence of OGIS <9.8 mg/kg/min), together with histological data were considered independent variables. All analyses were corrected for gender, age and BMI. p Values <0.05 were considered statistically significant.
RESULTS
Association of IR with the different features of liver injury in CHC
The patients’ data are given in table 1.
Table 1. Clinical, biochemical and histological characteristics of patients with chronic hepatitis C (mean±SD or % of cases).
| Characteristics | |
|---|---|
| Age (years) | 48.0±11.1 |
| Male/female (%) | 68/32 |
| Body mass index (kg/m2) | 24.8±3.5 |
| Normal weight/overweight/obese (%) | 56/38/6 |
| Normal glucose regulation/impaired fasting glucose or impaired glucose tolerance/diabetes (%) |
60/25/15 |
| Oral glucose insulin sensitivity (mg/kg/min) | 11.40±2.37 |
| Oral glucose insulin sensitivity <9.8 mg/kg/min (%) | 30 |
| Genotype 3/non-3 (%) | 17/83 |
| ALT (IU/ml) | 104.9±63.1 |
| Liver biopsy size (mm) | 14.7±3.7 |
| Portal tracts | 10.2±3.6 |
| Steatosis grade (absent/mild/moderate/severe) (%) | 58/21/14/7 |
| Necroinflammatory score | 6.26±3.46 |
| Fibrosis stage (0–2/3–4/5–6)(%) | 60/24/16 |
Impaired glucose regulation (impaired fasting glucose or impaired glucose tolerance) was present in 25% of cases, and 15% of cases fulfilled the criteria for diabetes, either at fasting glucose levels (three cases) or during OGTT. To measure IR, OGIS (which measures IR in response to glucose load) was chosen since it has been previously shown to be a more robust correlate of IR in this liver disease population than HOMA.3 IR (defined as the presence of OGIS <9.8 mg/kg/min) was detected in 23 (30%) patients. Patients with insulin resistance at OGIS had similar lipid and aminotransferase levels, and moderately higher BMI (26.0±3.7 kg/m2 vs 24.3±3.4 in insulin sensitive patients; p=0.059). The table also details the distribution of subjects within each stage of fibrosis as well as the extent of hepatocyte steatosis. Steatosis was found in 32 (41%) patients, and was macrovesicular in 64% of them, and mixed in 36%. No evidence of isolated microvesicular steatosis was found.
No association was found between ALT levels and the histological degree of steatosis, inflammation and fibrosis. For the viral factors, genotype 3 was significantly associated with the histological degree of steatosis (p=0.045), while no associations were found between the different genotypes and the grade of necroinflammation or the stage of fibrosis. When the viral load was considered, a slight significant association was found with the grade of necroinflammation only (p=0.049).
As shown in table 2, and after adjustment for confounders, insulin resistance at OGIS was significantly associated with steatosis, total necroinflammatory grading and its individual components (interface hepatitis, confluent necrosis, portal inflammation) with the exclusion of focal necrosis, and with the stage of fibrosis.
Table 2. Association of insulin resistance, assessed as the presence of diabetes/oral glucose insulin sensitivity (OGIS) <9.8 mg/kg/min, with the different component of liver injury in chronic hepatitis C (OR and 95% CI).
| OGIS <9.8 |
||
|---|---|---|
| OR (95% CI) | p Value | |
| Steatosis grade | 1.83 (1.07 to 3.13) | 0.027 |
| Necroinflammation | ||
| Total score | 1.29 (1.08 to 1.54) | 0.004 |
| Interface hepatitis | 1.69 (1.01 to 2.82) | 0.044 |
| Confluent necrosis | 1.42 (1.05 to 1.91) | 0.022 |
| Focal necrosis | 1.24 (0.63 to 2.42) | 0.537 |
| Portal inflammation | 2.48 (1.37 to 4.51) | 0.003 |
| Fibrosis | 1.66 (1.17 to 2.36) | 0.004 |
Furthermore, total necroinflammation (rs=0.678), interface hepatitis (rs=0.539), confluent necrosis (rs=0.531) and portal inflammation (rs=0.677) were significantly associated with the stage of fibrosis (p<0.001 for all). The association between the grade of steatosis and the stage of fibrosis was less strong but still significant (rs=0.256, p<0.05). When patients were divided according to genotype, no associations were found between steatosis, the grade of inflammation and the stage of fibrosis in CHC-3.
Association of DR with IR
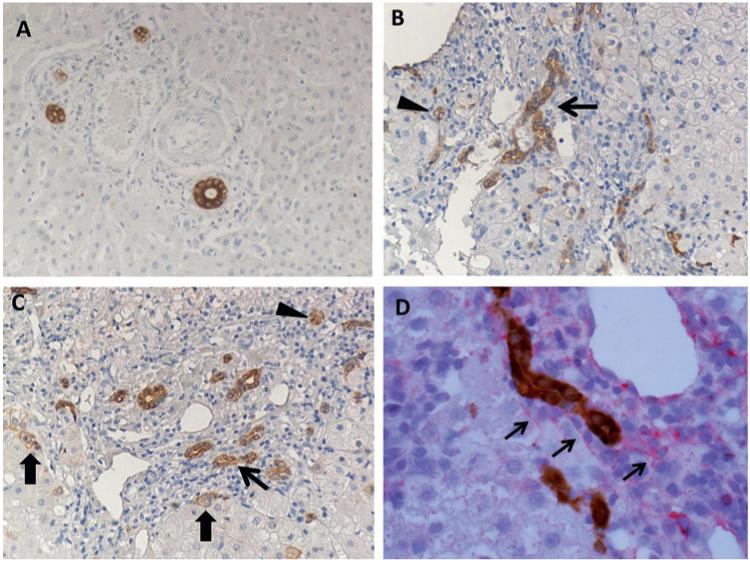
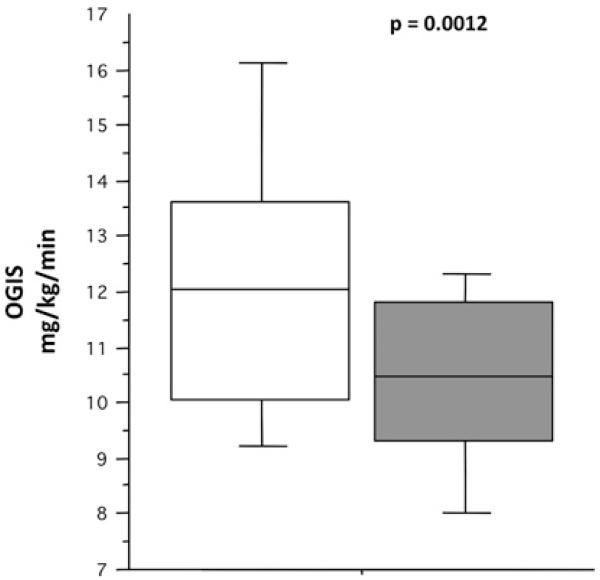
In controls, DR was absent and the mean biliary area formed by anatomical ducts was 0.01±0.008% of hepatic parenchyma (figure 1A). The presence of DR was commonly found in biopsy specimens of patients with CHC. DR cells were located at the periphery of the portal tract, quite distinct from the original bile ducts, and appeared as dysmorphic ductules without a well-defined lumen, or strings of cells, or isolated small oval cell-like elements (figure 1B,C). The area occupied by CK7-positive cells (ie, anatomical bile ducts and DR) was extremely variable, ranging almost 60-fold from 0.02% to 1.21% (0.25±0.19, p<0.01 vs controls). IR was significantly associated with the presence of both RDCs (rs=−0.327, p<0.01) and HPCs (rs=−0.271, p<0.05). Similarly, OGIS values were considerably lower in the presence of IHBCs (10.4±1.7 mg/kg/min vs 12.1±2.5; p=0.001; figure 2).
Figure 1.
Ductular reaction (DR) in patients with chronic hepatitis C (CHC) by immunohistochemistry for CK7 and its topographical association with α-smooth muscle actin (αSMA). (A) Normal liver, with bile ducts of regular morphology without any evidence of DR. (B,C) Evidence of DR in a patient with CHC. Reactive ductular cells appeared as CK7-positive cells with biliary phenotype arranged in irregularly shaped structures (thin arrows). Hepatic progenitor cells appeared as small, oval, or spindle-shaped cells with scant cytoplasm and oval nucleus, alone or in small clamps (arrowheads). Intermediate hepatobiliary cells appeared as cells with morphology and size intermediate between hepatocyte and cholangiocyte with a peculiar pattern of CK7 immunoreactivity, faint on the cytoplasm and reinforced at the plasma membrane (thick arrows); ×50 final magnification. (D) Double immunohistochemistry for CK7 (brown) and αSMA (red) in a patients with CHC, showing a close topographical association between these two elements at the interface between the portal tract and the hepatic parenchyma; ×100 final magnification.
Figure 2.
Insulin sensitivity and the presence of intermediate hepatobiliary cells (IHBCs) in patients with chronic hepatitis C. In this ‘box and whiskers’ plot, the boxes identify the median, and the 25th and 75th centiles, whereas the ‘whiskers’ stretch to the 5th and 95th centiles. Note that the presence of IHBCs (grey box) was associated with reduced oral glucose insulin sensitivity (OGIS) levels (ie, higher degree of insulin resistance) (p=0.0012).
Correlation of DR with grading and staging, and its association with the expression of EMT markers
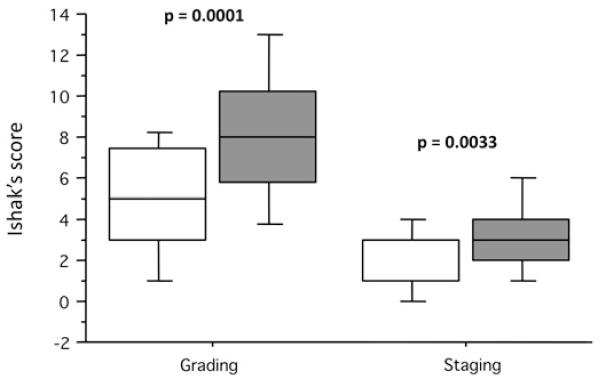
In the overall population, no association was found between the different elements of DR and the degree of steatosis in CHC. When patients were split according to genotype, a significant association was found between the grade of steatosis and the presence of IHBCs. On the other hand, for both RDCs and HPCs, a close relationship was seen for necroinflammatory activity (rs=0.533 and rs=0.525, p<0.001). When the individual components were analysed separately, a correlation was present with interface hepatitis (rs=0.425, p<0.001 and rs=0.361, p<0.01), confluent necrosis (rs=0.391 and rs=0.386, p<0.001), focal necrosis (rs=0.276 and rs=0.267, p<0.05) and portal inflammation (rs=0.529 and rs=0.52, p<0.001). A significant association was seen with the stage of fibrosis (rs=0.386, p<0.01 and rs=0.526 for RDCs and HPCs, respectively). A highly significant association was found between the grade and stage of liver injury and the presence of IHBCs, that was not found in the absence of fibrosis (figure 3). The presence of DR was observed in the nine patients with stage 0 fibrosis.
Figure 3.
Association between the presence of intermediate hepatobiliary cells (IHBCs) and the grading and staging of liver injury in chronic hepatitis C. In this ‘box and whiskers’ plot, the boxes identify the median, and the 25th and 75th centiles, whereas the ‘whiskers’ stretch to the 5th and 95th centiles. Note that the presence of IHBCs (grey box) was associated with a higher grade of necroinflammatory liver injury (p=0.0001) and higher stage of fibrosis (p=0.0033).
To evaluate the acinar distribution of the reactive elements of the DR (RDCs, HPCs and IHBCs) and its relationship with periportal fibrosis, we selected patients with histological stage ≤3 to avoid the architectural derangement of the most advanced cases of chronic liver injury. CK7-reactive elements were pref-erentially distributed in the periportal zone 1 of the hepatic acinus (90.7±10.4%) rather than in the mid-lobular/centrilobular location (9.2±8.7%) (p<0.0001).
The expression of αSMA is considered to be a marker of fibrogenesis.19 In normal liver, αSMA immunoreactivity was mostly observed in the vessel walls in all samples. In CHC, αSMA-positive cells were mostly localised in zone 1, close to the portal space; they were significantly higher than in controls (2.2±0.7% vs 0.4±0.3%, p<0.001) and correlated significantly with the expansion of DR (rs=0.382, p<0.001, rs=0.377, p<0.01 and rs=0.263, p=0.022, for RDCs, HPCs and IHBCs, respectively). A correlation was also seen between αSMA positivity, the total necroinflammatory score (rs=0.304, p<0.01), some components of the necroinflammatory score (confluent necrosis, rs=0.252, p<0.05; interface hepatitis, rs=0.316; p<0.01; portal inflammation, rs=0.319, p<0.01) and the fibrosis score (rs=0.436; p<0.001).
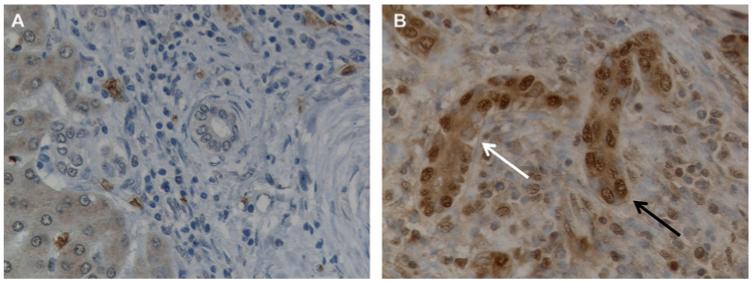
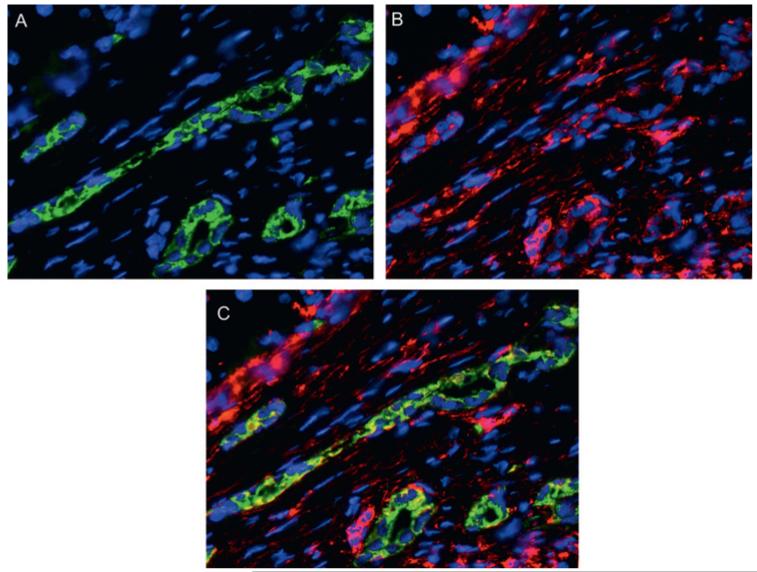
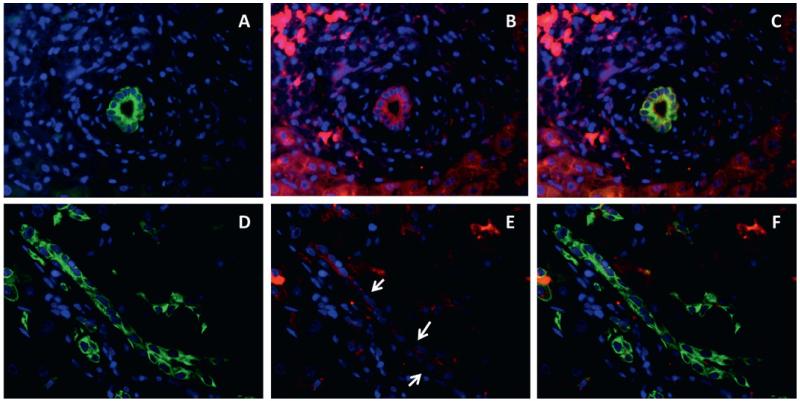
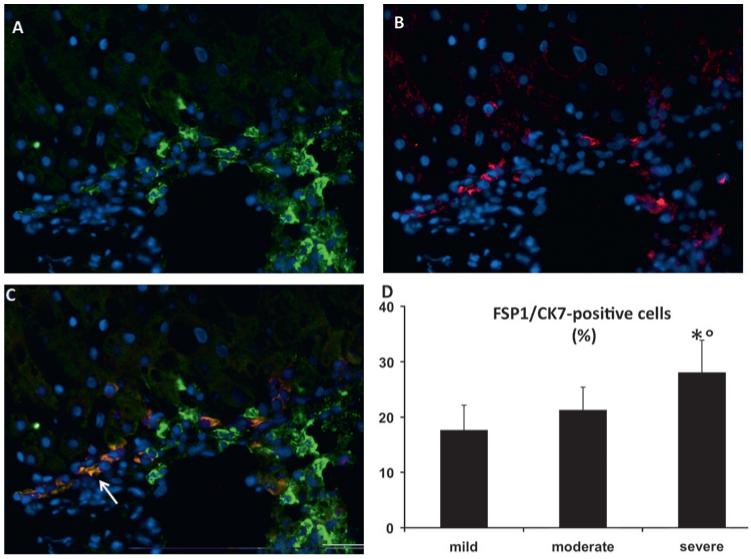
EMT markers were not observed in hepatocytes. On the contrary, nuclear upregulation of Snail1 (figure 4), expression of the intermediate filament marker vimentin (figure 5) and focal downregulation of E-cadherin were present in DR elements (figure 6). Dual immunofluorescence for FSP1 and CK7 revealed the presence of FSP1-positive DR elements predominantly in the periportal area (figure 7A–C). To quantify this process, grading of necroinflammation in CHC was scored as mild (<5), moderate (5–8) and severe (≥9). By morphometry, the number of the CK7-positive cells coexpressing FSP1 was higher in patients with severe necroinflammation than in those in whom it was mild or moderate (figure 7D). The number of CK7/FSP1 positive cells did not differ in the presence or absence of IR. Consistent with this observation, a significant association was observed between the total grade of necroinflammation and the dual expression of FSP1/CK7 (rs=0.392, p<0.05), while no association was found with IR measured by OGIS.
Figure 4.
Snail expression in ductular reaction cells. (A,B) Immunohistochemical staining for Snail. Snail is strongly expressed by reactive ductular cells in a tissue section from a patient with chronic hepatitis C and severe necroinflammatory damage (B) while it is absent in the normal bile ducts (A). Negative (white arrow) and positive (black arrow) nuclei are indicated; ×400 final magnification.
Figure 5.
Vimentin expression in ductular reaction cells. (A–C) Dual immunofluorescence for CK7 (green, A) and vimentin (red, B) in a sample of a patients with chronic HCV-hepatitis, showing that reactive ductular cells express vimentin (merged, C), a late mesenchymal marker, thus indicating their engagement in a phenotypic transitional process; ×200 final magnification.
Figure 6.
Downregulation of E-cadherin in ductular reaction cells. Dual immunofluorescence for CK7 (green, A, D) and E-cadherin (red, B, E) (C, F merged) in normal (A–C) and chronic hepatitis C livers (D–F) shows that ductular reaction partially lose E-cadherin expression (arrow, E) with respect to normal bile ducts (B); ×200 final magnification.
Figure 7.
Expression of fibroblast specific protein 1 (FSP1) by ductular reaction (DR) cells. Dual immunofluorescence with FSP1 (A, green) and CK7 (B, red) showing co-localisation in DR structures of a chronic hepatitis C (CHC) sample with severe necroinflammatory damage (arrow, C, merged); ×200 final magnification. (D) Morphometric count of DR cells coexpressing FSP-1 significantly increases from mild to severe CHC. *p<0.001 versus mild liver injury; °p<0.01 versus moderate liver injury.
Multivariate analysis
The presence of bridging fibrosis (Ishak’s score stage ≥3) is an important predictor of future progression to cirrhosis and therefore an indication for treatment.1 In multivariate analysis, after adjustment for age, gender and BMI, total inflammation (OR=1.46; 95% CI 1.14 to 1.97; p=0.003) and IR by OGIS (OR=4.96; 1.13 to 21.72; p=0.033) were the only factors significantly predicting the presence of advanced fibrosis (Ishak score ≥3). No significant effect of DR was demonstrated. Further adjustment for genotype 3/non-3 did not change the results. Total inflammation (OR=1.55; 1.17 to 2.06; p=0.002) and IR by OGIS (OR=5.73; 1.08 to 30.51; p=0.041) remained the only independent factors significantly predicting the presence of advanced fibrosis and again no significant effect of DR was demonstrated.
By multivariate linear regression analysis, and after adjustment for age, gender and BMI, the total score of inflammation and IR by OGIS were the only factors significantly associated with the expansion of RDCs (p=0.0001 and p=0.032, respectively), while the score of inflammation was the only factor significantly associated with the presence of HPCs (p<0.0001). By logistic regression analysis and after adjustment for age, gender and BMI, total inflammation was the only factor significantly associated with the presence of IHBCs (OR=1.34; 1.12 to 1.59, p=0.0009).
DISCUSSION
The main findings of our study are that in CHC (1) IR and the degree of necroinflammation are independent predictors of advanced fibrosis; (2) IR and the degree of necroinflammation are significantly associated with expansion of the DR; (3) ductular reactive cells express phenotypic markers suggestive of EMT.
The relationship between liver fibrosis and IR has been difficult to assess and, because of methodological differences, conflicting results have been reported.20-23 Several methods are available to determine insulin sensitivity/resistance, each has advantages and limitations. OGIS is a good correlate of the insulin sensitivity measured by the clamp, and it has been previously shown to be a more robust index of IR in patients with CHC than HOMA.3 It was also argued that advanced liver fibrosis may impair insulin clearance, resulting in increased serum insulin levels regardless of the insulin secretion status.24 However, in our population, the presence of IR was seen also in patients with minimal fibrosis, indicating that it precedes the development of advanced disease.
IR can contribute to fibrosis progression in CHC by several mechanisms. IR represents a subacute inflammatory state that is associated with increased circulating levels of substances involved in the fibrogenetic process, since HSCs express several of the cognate receptors.19 IR was significantly associated with the degree of hepatic steatosis. Steatosis was shown to be an important cofactor for liver fibrosis.3,22 In our study, we confirm a significant association between the degree of steatosis and the stage of fibrosis, which was, however, not maintained when IR and the grade of necroinflammation entered into the multivariate analysis. Thus steatosis could represent a dependent variable linking between IR and the liver pathological mechanisms leading to HSCs activation, as shown both in patients with CHC and in experimental models.25-27
In our series, IR and the degree of necroinflammatory liver injury were independent predictors of advanced hepatic fibrosis (Ishak score ≥3), and therefore may be considered prognostic factors for future progression to fibrosis. Both IR and the degree of necroinflammation were also associated with a specific aspect of the reparative mechanisms during chronic liver injury—that is, the expansion of the DR. During chronic liver injury and in individuals who are progressing to cirrhosis, periportal spaces contain large numbers of mesenchymal and immature ductular cells extending into the forming septae.7,28 DR is a term commonly used for the expanded population of epithelial cells at the interface between the biliary tree and the hepatocytes that can arise from proliferation of pre-existing bile ductular cells, from activated progenitor cells, from circulating stem cells, or from biliary metaplasia of hepatocytes.8 Our data show that the total necroinflammatory score and its individual components were significantly associated with the expansion of DR as well as with the enrichment of αSMA-positive cells, marker of HSCs activation, in close proximity to the DR elements. In this regard, reactive DR elements were preferentially located in the periportal area (from where fibrosis develops) in patients with CHC and an Ishak score ≤3, indicating that they are associated with the most prominent inflammatory infiltrate and that their expansion precedes the development of advanced fibrosis.
DR expansion has been shown to correlate to hepatic fibrosis in CHC, NASH and genetic cholangiopathies.13,29,30 According to our results, we can hypothesise that DR expansion may be one of several mechanisms by which portal/periportal inflammation drives the progression of chronic liver injury in hepatitis C. Our study also shows for the first time that IR is significantly associated with the expansion of the RDCs in CHC. Considering that in the multivariate analysis the grade of necroinflammation and IR were the only factors significantly predicting the presence of advanced fibrosis (Ishak score ≥3), the expansion of RDCs may represent a link between IR and hepatic inflammation, and the fibrogenetic process. IR may contribute (either directly through cytokine release or through steatosis induction) to the hepatocyte replicative arrest that is a prerequisite for DR expansion and for hepatic fibrogenesis and fibrosis.5 It has been reported that hepatic steatosis correlates with DR expansion in CHC.29 To study the expansion of the DR, we used well-standardised nomenclature and, found that steatosis was significantly associated only with the appearance of IHBCs.8,17 Furthermore, these differences can be explained by the lower presence of CHC-3 in our population (17% vs 41%).
Our study also shows that different phenotypic markers indicating the activation of an EMT programme are expressed by DR cells.15 EMT is a novel mechanism considered to contribute significantly to organ fibrosis and cancer metastasis.31 Evidence in favour and against a transition of liver epithelial cells (hepatocytes and cholangiocytes) towards myofibroblasts in experimental models of chronic liver injury has been recently published.9,13,32-35 EMT markers were shown to localise in DR elements in liver in primary biliary cirrhosis, alcoholic liver injury and NASH.32,33,36 Our study is the first to examine this aspect in CHC and our data provide unequivocal evidence that ductular reactive cells in patients with HCV hepatitis express phenotypic markers of EMT.
Type 2 EMT is considered to be one of the mechanisms leading to organ fibrosis in conditions with chronic injury, by which immotile epithelial cells acquire the motile properties needed to repair the architectural damages.15,31 Consistent with type 2 EMT, we found that RDCs expressed the early EMT marker FSP1, the intermediate filament protein vimentin (a later marker of mesenchymal conversion than FSP1), in addition to the nuclear expression of the transcription factor Snail, a major driver of the EMT process, and to the partial loss of the cell surface epithelial marker E-cadherin, the hallmark of EMT.15 In agreement with Taura et al, no EMT markers were observed in hepatocytes.34 Furthermore, in this study we show that the number of CK7/FSP1-positive cells significantly increased as the necroinflammatory damage progressed, reaching 30% of RDCs in the most severe cases of CHC (necroinflammation grading ≥9 by Ishak’s score), which have a higher risk of progression towards liver cirrhosis. Consistent with this observation, a significant association was observed between the total grade of necroinflammation and the dual expression of FSP1/CK7. Our study thus shows that the periportal area, from which fibrotic septa depart in CHC, are progressively enriched in elements of the DR, many of which express EMT markers. These data suggest an association between the EMT process and the progression of liver fibrosis and are consistent with several published experimental observations in the liver as well as in other organs.9,31
In conclusion, our study indicates that IR (measured by the OGIS method) and hepatic inflammation are independently associated with hepatic fibrosis in CHC. Furthermore, a mechanism has been identified—namely, the expansion of the DR and the occurrence of EMT, by which IR and hepatic inflammation might cause liver fibrosis. These data could result in the definition of biological and histological markers of progression of CHC before the development of overt fibrosis, and in the definition of novel therapeutic targets in patients at high risk of cirrhosis.
Significance of this study.
What is already known about this subject?
-
▶
An association between insulin resistance and the stage of fibrosis in chronic hepatitis C has been reported but remains controversial.
-
▶
Although much emphasis has been given in the past to the role of hepatic stellate cells in fibrogenesis, the role of the epithelial component of liver repair through the so-called ductular reaction is now under scrutiny.
-
▶
In addition to producing factors able to recruit mesenchymal elements, it has been reported that ductular reaction could contribute to fibrogenesis through the process of epithelial-mesenchymal transition.
What are the new findings?
-
▶
Insulin resistance, measured by a dynamic test (oral glucose insulin sensitivity), and the grade of necroinflammation represent independent predictors of advanced hepatic fibrosis (Ishak’s stage >3) in chronic hepatitis C.
-
▶
Insulin resistance and the grade of necroin-flammation are associated with specific components of the ductular reaction.
-
▶
Reactive ductular cells, a specific compartment of the ductular reaction, may undergo the process of epithelial-mesenchymal transition in patients with the highest grade of necroinflammation.
How might it impact on clinical practice in the foreseeable future?
-
▶
Insulin resistance should be measured using a dynamic test in the diagnostic investigation of patients with chronic hepatitis C, particularly in those not undergoing liver biopsy, owing to its association with the advanced stage of fibrosis.
-
▶
The presence of the ductular reaction should be routinely considered in the histological evaluation of patients with chronic hepatitis C, and its potential as a prognostic factor should be tested.
Acknowledgments
Funding This work was supported by MIUR grant 2007 - prot. 2007HPT7BA_002 to GSB, GF, SS and AB. GF is a recipient of Scuola di Dottorato in Alimentazione e Salute from Università Politecnica delle Marche. LF is a recipient of Grant Telethon GGP09189. MC is a recipient of Progetto di Ateneo CPDA083217/08. MS is supported by supported by NIH DK079005, by Yale University Liver Center (NIH DK34989), and Fondazione S Martino, Bergamo.
Footnotes
Competing interests None.
Ethics approval This study was conducted with the approval of the Polytechnic University of Marche-Ospedali Riuniti Ancona.
Provenance and peer review Not commissioned; externally peer reviewed.
REFERENCES
- 1.Ghany MG, Strader DB, Thomas DL, et al. Diagnosis, management, and treatment of hepatitis C: an update. Hepatology. 2009;49:1335–74. doi: 10.1002/hep.22759. [DOI] [PMC free article] [PubMed] [Google Scholar]
- 2.Powell EE, Jonsson JR, Clouston AD. Steatosis: co-factor in other liver diseases. Hepatology. 2005;42:5–13. doi: 10.1002/hep.20750. [DOI] [PubMed] [Google Scholar]
- 3.Svegliati-Baroni G, Bugianesi E, Bouserhal T, et al. Post-load insulin resistance is an independent predictor of hepatic fibrosis in virus C chronic hepatitis and in non-alcoholic fatty liver disease. Gut. 2007;56:1296–301. doi: 10.1136/gut.2006.107946. [DOI] [PMC free article] [PubMed] [Google Scholar]
- 4.Zeisberg EM, Tarnavski O, Zeisberg M, et al. Endothelial-to-mesenchymal transition contributes to cardiac fibrosis. Nat Med. 2007;13:952–61. doi: 10.1038/nm1613. [DOI] [PubMed] [Google Scholar]
- 5.Xia X, Demorrow S, Francis H, et al. Cholangiocyte injury and ductopenic syndromes. Semin Liver Dis. 2007;27:401–12. doi: 10.1055/s-2007-991516. [DOI] [PubMed] [Google Scholar]
- 6.Desmet V, Roskams T, Van Eyken P. Ductular reaction in the liver. Pathol Res Pract. 1995;191:513–24. doi: 10.1016/s0344-0338(11)80870-8. [DOI] [PubMed] [Google Scholar]
- 7.Desmet VJ. The amazing universe of hepatic microstructure. Hepatology. 2009;50:333–44. doi: 10.1002/hep.23152. [DOI] [PubMed] [Google Scholar]
- 8.Roskams TA, Theise ND, Balabaud C, et al. Nomenclature of the finer branches of the biliary tree: canals, ductules, and ductular reactions in human livers. Hepatology. 2004;39:1739–45. doi: 10.1002/hep.20130. [DOI] [PubMed] [Google Scholar]
- 9.Choi SS, Diehl AM. Epithelial-to-mesenchymal transitions in the liver. Hepatology. 2009;50:2007–13. doi: 10.1002/hep.23196. [DOI] [PMC free article] [PubMed] [Google Scholar]
- 10.Ishak K, Baptista A, Bianchi L, et al. Histological grading and staging of chronic hepatitis. J Hepatol. 1995;22:696–9. doi: 10.1016/0168-8278(95)80226-6. [DOI] [PubMed] [Google Scholar]
- 11.Kleiner DE, Brunt EM, Van Natta M, et al. Design and validation of a histological scoring system for nonalcoholic fatty liver disease. Hepatology. 2005;41:1313–21. doi: 10.1002/hep.20701. [DOI] [PubMed] [Google Scholar]
- 12.Benedetti A, Di Sario A, Casini A, et al. Inhibition of the NA(+)/H(+) exchanger reduces rat hepatic stellate cell activity and liver fibrosis: an in vitro and in vivo study. Gastroenterology. 2001;120:545–56. doi: 10.1053/gast.2001.21203. [DOI] [PubMed] [Google Scholar]
- 13.Fabris L, Cadamuro M, Guido M, et al. Analysis of liver repair mechanisms in Alagille syndrome and biliary atresia reveals a role for notch signaling. Am J Pathol. 2007;171:641–53. doi: 10.2353/ajpath.2007.070073. [DOI] [PMC free article] [PubMed] [Google Scholar]
- 14.Svegliati-Baroni G, Ridolfi F, Caradonna Z, et al. Regulation of ERK/JNK/p70S6K in two rat models of liver injury and fibrosis. J Hepatol. 2003;39:528–37. doi: 10.1016/s0168-8278(03)00291-5. [DOI] [PubMed] [Google Scholar]
- 15.Zeisberg M, Neilson EG. Biomarkers for epithelial-mesenchymal transitions. J Clin Invest. 2009;119:1429–37. doi: 10.1172/JCI36183. [DOI] [PMC free article] [PubMed] [Google Scholar]
- 16.Fabris L, Strazzabosco M, Crosby HA, et al. Characterization and isolation of ductular cells coexpressing neural cell adhesion molecule and Bcl-2 from primary cholangiopathies and ductal plate malformations. Am J Pathol. 2000;156:1599–612. doi: 10.1016/S0002-9440(10)65032-8. [DOI] [PMC free article] [PubMed] [Google Scholar]
- 17.Libbrecht L, Desmet V, Van Damme B, et al. Deep intralobular extension of human hepatic ‘progenitor cells’ correlates with parenchymal inflammation in chronic viral hepatitis: can ‘progenitor cells’ migrate? J Pathol. 2000;192:373–8. doi: 10.1002/1096-9896(2000)9999:9999<::AID-PATH700>3.0.CO;2-5. [DOI] [PubMed] [Google Scholar]
- 18.Svegliati-Baroni G, D’Ambrosio L, Curto P, et al. Interferon gamma decreases hepatic stellate cell activation and extracellular matrix deposition in rat liver fibrosis. Hepatology. 1996;23:1189–99. doi: 10.1002/hep.510230538. [DOI] [PubMed] [Google Scholar]
- 19.Svegliati-Baroni G, De Minicis S, Marzioni M. Hepatic fibrogenesis in response to chronic liver injury: novel insights on the role of cell-to-cell interaction and transition. Liver Int. 2008;28:1052–64. doi: 10.1111/j.1478-3231.2008.01825.x. [DOI] [PubMed] [Google Scholar]
- 20.Cua IH, Hui JM, Kench JG, et al. Genotype-specific interactions of insulin resistance, steatosis, and fibrosis in chronic hepatitis C. Hepatology. 2008;48:723–31. doi: 10.1002/hep.22392. [DOI] [PubMed] [Google Scholar]
- 21.Fartoux L, Poujol-Robert A, Guechot J, et al. Insulin resistance is a cause of steatosis and fibrosis progression in chronic hepatitis C. Gut. 2005;54:1003–8. doi: 10.1136/gut.2004.050302. [DOI] [PMC free article] [PubMed] [Google Scholar]
- 22.Leandro G, Mangia A, Hui J, et al. Relationship between steatosis, inflammation, and fibrosis in chronic hepatitis C: a meta-analysis of individual patient data. Gastroenterology. 2006;130:1636–42. doi: 10.1053/j.gastro.2006.03.014. [DOI] [PubMed] [Google Scholar]
- 23.Moucari R, Asselah T, Cazals-Hatem D, et al. Insulin resistance in chronic hepatitis C: association with genotypes 1 and 4, serum HCV RNA level, and liver fibrosis. Gastroenterology. 2008;134:416–23. doi: 10.1053/j.gastro.2007.11.010. [DOI] [PubMed] [Google Scholar]
- 24.Petrides AS, Vogt C, Schulze-Berge D, et al. Pathogenesis of glucose intolerance and diabetes mellitus in cirrhosis. Hepatology. 1994;19:616–27. doi: 10.1002/hep.1840190312. [DOI] [PubMed] [Google Scholar]
- 25.Svegliati-Baroni G, Candelaresi C, Saccomanno S, et al. A model of insulin resistance and nonalcoholic steatohepatitis in rats: role of peroxisome proliferator-activated receptor-alpha and n-3 polyunsaturated fatty acid treatment on liver injury. Am J Pathol. 2006;169:846–60. doi: 10.2353/ajpath.2006.050953. [DOI] [PMC free article] [PubMed] [Google Scholar]
- 26.Vidali M, Tripodi MF, Ivaldi A, et al. Interplay between oxidative stress and hepatic steatosis in the progression of chronic hepatitis C. J Hepatol. 2008;48:399–406. doi: 10.1016/j.jhep.2007.10.011. [DOI] [PubMed] [Google Scholar]
- 27.Walsh MJ, Vanags DM, Clouston AD, et al. Steatosis and liver cell apoptosis in chronic hepatitis C: a mechanism for increased liver injury. Hepatology. 2004;39:1230–8. doi: 10.1002/hep.20179. [DOI] [PubMed] [Google Scholar]
- 28.Roskams T. Progenitor cell involvement in cirrhotic human liver diseases: from controversy to consensus. J Hepatol. 2003;39:431–4. doi: 10.1016/s0168-8278(03)00333-7. [DOI] [PubMed] [Google Scholar]
- 29.Clouston AD, Powell EP, Walsh MJ, et al. Fibrosis correlates with a ductular reaction in hepatitis C: roles of impaired replication, progenitor cells and steatosis. Hepatology. 2005;41:809–18. doi: 10.1002/hep.20650. [DOI] [PubMed] [Google Scholar]
- 30.Richardson MM, Jonsonn JR, Powell EE, et al. Progressive fibrosis in nonalcoholic steatohepatitis: association with altered regeneration and a ductular reaction. Gastroenterology. 2007;133:80–90. doi: 10.1053/j.gastro.2007.05.012. [DOI] [PubMed] [Google Scholar]
- 31.Acloque H, Adams MS, Fishwick K, et al. Epithelial-mesenchymal transitions: the importance of changing cell state in development and disease. J Clin Invest. 2009;119:1438–49. doi: 10.1172/JCI38019. [DOI] [PMC free article] [PubMed] [Google Scholar]
- 32.Omenetti A, Porrello A, Jung Y, et al. Hedgehog signaling regulates epithelial-mesenchymal transition during biliary fibrosis in rodents and humans. J Clin Invest. 2008;118:3331–42. doi: 10.1172/JCI35875. [DOI] [PMC free article] [PubMed] [Google Scholar]
- 33.Syn WK, Jung Y, Omenetti A, et al. Hedgehog-mediated epithelial-to-mesenchymal transition and fibrogenic repair in nonalcoholic fatty liver disease. Gastroenterology. 2009;137:1478–88.e8. doi: 10.1053/j.gastro.2009.06.051. [DOI] [PMC free article] [PubMed] [Google Scholar]
- 34.Taura K, Miura K, Iwaisako K, et al. Hepatocytes do not undergo epithelial-mesenchymal transition in liver fibrosis in mice. Hepatology. 2010;51:1027–36. doi: 10.1002/hep.23368. [DOI] [PMC free article] [PubMed] [Google Scholar]
- 35.Wells RG. The epithelial-to-mesenchymal transition in liver fibrosis: here today, gone tomorrow? Hepatology. 2010;51:737–40. doi: 10.1002/hep.23529. [DOI] [PMC free article] [PubMed] [Google Scholar]
- 36.Rygiel KA, Robertson H, Marshall HL, et al. Epithelial-mesenchymal transition contributes to portal tract fibrogenesis during human chronic liver disease. Lab Invest. 2008;88:112–23. doi: 10.1038/labinvest.3700704. [DOI] [PubMed] [Google Scholar]


