Figure.
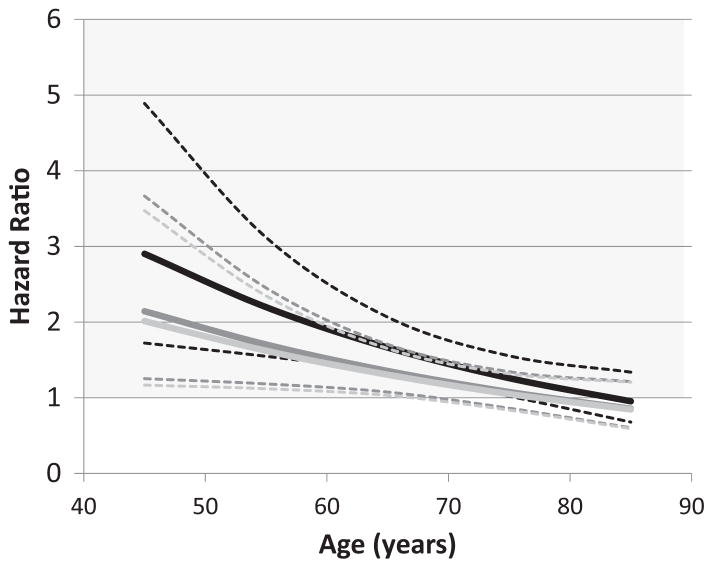
Estimated black/white hazard ratio as a function of age and covariate adjustment. Black lines show hazard ratio and 95% confidence limits after adjustment for sex; dark gray lines show hazard ratio and 95% confidence limits after further adjustment for Framingham stroke risk factors; and light gray lines show hazard ratio and 95% confidence limits after further adjustment for socioeconomic status factors.

