

Abstract
The discovery of activation state dependent kinase inhibitors, which bind specifically to the inactive conformation of the protein, is considered to be a promising pathway to improved cancer treatments. Identifying such inhibitors is challenging, however, because they can have Kd values similar to molecules known to inhibit kinase function by interacting with the active form. Further, while inhibitor induced changes within the kinase tertiary structure are significant, few technologies are able to correctly assign inhibitor binding modes in a high-throughput fashion based exclusively on protein-inhibitor complex formation and changes in local protein structure. We have developed a new assay, using ion mobility-mass spectrometry, capable of both rapidly detecting inhibitor binding and classifying the resultant kinase binding modes. Here, we demonstrate the ability of our approach to classify a broad set of kinase inhibitors, using micrograms of protein, without the need for protein modification or tagging.
Introduction
Kinase regulation plays a central role in multiple biochemical pathways and several disease states, most-notably, cancer.1 For example, tyrosine kinase inhibitors are a prominent treatment approach for chronic myelogenous leukemia (CML), where fusion between the Abelson (Abl) kinase gene and the break point cluster (BCR) at chromosome 22 results in a chimeric Bcr-Abl tyrosine kinase implicated in the disease.2 As such, there are many ongoing efforts aimed at designing small molecules capable of influencing the function of this broad class of proteins. Small molecule kinase inhibitors can fall into at least four general categories, with two of the most important being those that bind to the ATP binding site within the kinase domain (type I) and those that extend into a nearby “allosteric” site outside the ATP binding pocket (type II).3 The tertiary structure of kinases bound to these two small molecule classes are known to undergo small, yet significant changes.4 Type I molecules are conformationally non-specific, and thus will bind all states of the kinase including the open, or active conformation. In contrast, type II binders interact preferentially with an inactive, or closed conformation, where the flexible 'activation loop' region of the protein refolds to cover the substrate binding site. While the active kinase form is broadly conserved, inactive forms can vary considerably between kinases. Thus, while many small molecule drugs are available for type I binding, these inhibitors typically lead to less-selective control over kinase function.3 Type II inhibitors are, therefore, generally preferred for therapeutic purposes, as they provide higher degrees of kinase selectivity. However, the widespread use of type II kinase inhibitors as cancer therapies has, in some cases, led to drug resistance in many cell lines and CML patients,5 thus new type II inhibitors are needed to counteract such effects.
The main technology underpinning our approach to this problem is ion mobility-mass spectrometry (IM-MS), where ions produced by nano-electrospray ionization (nESI) can be filtered first by a quadrupole according to their m/z, separated according to their orientiationally averaged size (collision cross-section, CCS) on the millisecond timescale, and can then be analyzed by time-of-flight mass spectrometry.6 IM-MS has been used extensively to characterize the structures of small biomolecules in the gas-phase,7 and has begun to be used broadly to analyze the structure of larger proteins and protein complexes,8 in many cases revealing high degrees of correlation between solvated and solvent-free datasets.9 Many past IM-MS experiments have focused on protein and peptide systems where alterations in IM data could be related to significant structural changes in the gas-phase biomolecules of interest.10 For example, IM-MS experiments are capable of discerning helical and globular peptide conformations,11 as well as the calcium dependant conformational shifts of calmodulin,12 at modest IM resolution values. To assess finer protein tertiary structure details, IM-MS datasets must be combined with sophisticated MD simulations.13 Since many protein folds project identical CCS values, the information content carried by the IM-MS experiment necessarily decreases as the size of the protein increases, and the structural filtering requirements of the MD simulations utilized are greatly enhanced. Despite this inherent limitation, the structures of many small proteins have been determined in this fashion, including the desolvated structures for ubiquitin 14 and Aβ1–42.15 However, it is also clear from these previous reports that the inherent limitations of CCS as a lone constraint in structure determinations are a key challenge for the application of IM-MS in structural biology.
In addition to simple CCS measurements, IM-MS is also capable of recording protein CCS as a function of ion internal energy, thus enabling the technology to record protein unfolding as well as static protein structure. The first observations of protein ion unfolding predate the application of IM-MS to gas-phase biomolecules,16 and related to the influences of Coulombic forces on gas-phase protein structure. Following these observations, IM 17 and IM-MS 18 were coupled with ESI, enabling the observation of protein unfolding both as a function of ion charge and internal temperature. Though these observations appeared throughout the early IM-MS literature, they were rarely interpreted relative to solution-phase protein structures. Recently we, and others, introduced collision induced unfolding (CIU) as a means of distinguishing between the subtle differences in protein tertiary structure that result as a function of small molecule binding.19 For example, CIU data has been used to assess the different binding modes that exist between tetrameric transthyretin (TTR) and its natural ligand, thyroxin.19a Significant differences in CIU response were detected in wild type TTR and an amyloidogenic mutant form of the protein, indicating that different thyroxin binding modes are operative in the two protein forms. While these data allowed for a critical demonstration of the CIU method as a means of detecting local stability shifts within proteins upon ligand binding, such data had not yet been correlated with the more-subtle changes that occur within protein tertiary structure upon ligand binding.
In this report, we develop a new method using the basic architecture of CIU, aimed at protein kinases. We have begun by differentiating type I and II inhibitors using the protein kinase domain of the Abl kinase as a model system. Key innovations in this new IM-MS and CIU based method include using both collision induced dissociation (CID) and CIU data as a means of creating a more discriminating ‘fingerprint’ for kinase-inhibitor complexes, as well as employing CIU 'fingerprints' to assign regions of interest capable of streamlining the CIU methodology. Most critically, we find that despite the relatively small structural changes that exist between active and inactive kinases, CIU is an excellent method for differentiating type I and II inhibitors, requiring relatively small amounts of unmodified protein. In addition, since the technology is built using an MS-based technology, it functions in a manner that can be extended, in principle, to any kinase/inhibitor system in a relatively high-throughput mode (up to 100s of samples per day).
Experimental Methods
General
Imatinib, dasatinib, ponatinib, nilotinib, tozasertib, staurosporine, saracatinib, and sorafenib were purchased from LC Labs (Woburn, MA), PP2 was purchased from Sigma (St. Louis, MO), DCC-2036 was purchased from SelleckChem (Houston, TX), and bosutinib was purchased from Tocris Bioscience (Bristol, United Kingdom). Protein samples were buffer exchanged into 100 mM ammonium acetate at pH 7 using Micro Bio-Spin 6 columns (Bio-Rad, Hercules, CA), and prepared to a final concentration of 8.8 KM. The inhibitors were added in a 1:1 mole ratio of Abl: inhibitor and incubated at room temperature for 1 hr, after which all samples were moved to ice until analysis.
Protein Expression, Purification and Activity Assays
c-Abl kinase domain was synthesized by GeneArt (Life Technologies, Grand Island, NY) using E. coli modified codons. The kinase domain was subcloned into pET28a, modified with a TEV protease cleavable N-terminal 6x-His tag. The plasmid was transformed by electroporation into Bl21DE3 electrocompetent cells containing YopH in pCDFDuet-1. Cell growth, expression, and protein purification were performed using modified literature protocols previously reported for expression of wild-type c-Src kinase domain.20 For the experimental details of our kinase activity assays, see the online supporting information documentation.
Ion Mobility-Mass Spectrometry
Sample aliquots (~5 µl) were analyzed by ion mobility-mass on a quadrupole-ion mobility-time-of-flight mass spectrometer (Q-IM-ToF MS) instrument (Synapt G2 HDMS, Waters, Milford, Ma) and ionized using a nESI source, as described previously.6b, 21 The capillary voltages ranged from 1.2–2.0 kV, with the source operating in positive mode and the sample cone operating at 50V. The trap travelling-wave ion guide was pressurized to 2.2×10⁻² mbar of argon gas. The ToF-MS was operated over the m/z range of 1000–8000 and at a pressure of 1.6×10⁻⁶, and the quad profile was set to dwell on 3000 m/z. The wave height was set to 40V and the wave velocity set to 900 m/s. The concentration of both inhibitor and protein are kept sufficiently low so as to avoid the formation of artifact complexes, and all data collected conforms to the expected inhibitor binding stoichiometry.22
Prior to the ion mobility separator, ions were activated by collisions in the ion trap traveling-wave ion guide in order to perform CIU of protein complexes in order to investigate the differences in the unfolding pathways of unphosphorylated Abl stabilized by type I and type II inhibitors.19a Charge states were chosen based on their relative intensity as a function of ligand binding and according to the number of intermediate conformations that could be observed during CIU experiments. Each mass-selected ion was activated by increasing the trap collision voltage (TCE), from 20V to 50V in 2V increments.
All mass spectra were calibrated externally using a solution of cesium iodide (100 mg ml−1) and were processed using Masslynx 4.1 software (Waters, UK) 23. The data for previously identified type I and type II drift time spectra were averaged to produce their corresponding average spectra for high-throughput analysis. Similarity scores were found by first determining the χ2 correlation between the averaged data and individual datasets.
| (1) |
In Equation 1 above, Aij and Eij are the actual and expected frequency of the ith row, jth column respectively, r is the number of data rows, and c is the number of data columns. The χ2 value is used here as a measure of the goodness of fit between IM data acquired from a given inhibitor and either type I or II averaged data, and could be further used in conjunction with knowledge of the critical values from the χ2 probability distribution and the degrees of freedom for a dataset to determine the confidence interval of such assignments (as in the Pearson test).24 Determining χ2 is a common approach used to analyze MS and separations datasets for similarity.25 The similarity score discussed at length here was derived by normalizing the χ2 value obtained for an imatinib/average type II comparison to a value of 100. The same normalization factor was then applied to all other χ2, thus creating a scale for ranking the type II character of a given Abl-inhibitor CIU response. Smaller values indicate a poorer fit to the averaged type II data (the inverse of the original χ2 metric). The errors shown in Table 1 result from standard deviations of three replicate experiments, and are 1.9% on average. Complete χ2 and similarity scores for three different CIU fingerprint regions are shown below in Table S1. White colored values indicate those that would not cluster correctly during an analysis based only on the similarity score shown.
Table 1.
CIU-based similarity scores for the current training dataset of type I and II kinase inhibitors
| Drugs | Mass (Da) |
Structure1 | Kd (nM)2 |
PDB ID |
Type3 | Type II Similarity Score |
|---|---|---|---|---|---|---|
| Imatinib | 493.6 | 1.1 | 1IEP | II | 100 +/−1.2 | |
| Nilotinib | 529.2 | 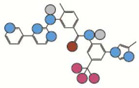 |
10 | 3CS9 | II | 73.9 +/−0.5 |
| Ponatinib | 532.4 | 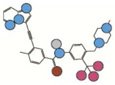 |
-- | 3OXZ | II | 61.9 +/−0.9 |
| Sorafenib | 637.0 | 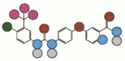 |
130 | N/A | II | 48.6 +/−1.0 |
| DCC-2036 | 553.6 |  |
-- | 3QRI | II | 43.4 +/−0.2 |
| Bosutinib | 529.2 | 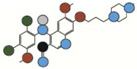 |
0.12 | 3UE4 | I | 42.5 +/−1.2 |
| Tozasertib | 464.6 | 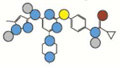 |
13 | 2F4J | I | 42.2 +/−0.7 |
| PP2 | 301.1 |  |
-- | N/A | I | 38.9 +/−0.9 |
| Saracatinib | 541.4 | 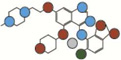 |
-- | N/A | I | 35.2 +/−0.7 |
| Staurosporine | 466.5 | 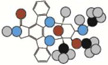 |
37 | 2HZ4 | I | 24.5+/−1.5 |
| Dasatinib | 487.2 | 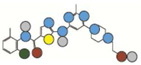 |
0.029 | 2GQG | I | 21.8 +/−0.1 |
Atom types shown as colored circles: blue = nitrogen, grey = hydrogen, red = oxygen, pink = fluorine, green = chlorine, black = carbon, yellow = sulfur.
Ligand dissociation constants can be found in reference 39.
Binding type derived from PDB entries showing the indicated small molecule bound to the Abl kinase. In cases where no Abl structure was available, data for similar kinases were used to confirm the binding type shown. References: PP2 = 40, Saracatinib = 41, Sorafinib = 42.
Results
Outlining the Challenges in Activation State-Selective Kinase Inhibitor Discovery
Screening for type II inhibitors with current measurement technologies is a major challenge, as the structural changes that occur within the kinase domain upon binding are small, and mainly limited to the activation loop within the protein fold. Enzyme activity assays, while effective in limited cases, are exceptionally difficult to utilize within the framework of a broad inhibitor screen. For example, we began our experiments by employing a fluorescence assay, where the activity of the Abl kinase domain (33.2 kDa) is measured in the presence of an inhibitor. Measurements are then made for Abl where the activation loop has been phosphorylated, causing the enzyme to favor its active conformation (Figure S1A). Since the primary mode for differentiating kinase inhibitor binding type involves similar activity assays,26 the results shown in Figure S1 likely represent a good benchmark for state-of-the-art high-throughput methods in kinase inhibitor binding mode identification.
While our results indicate the expected disparity in enzymatic activities for the known type II inhibitor imatinib (Gleevec), dasatinib (Sprycel) and all other inhibitors tested had a statistically preference for the active form of Abl, despite representing different known Abl binding modes (Figure S1B). Type I and II inhibitors appear to bind with similar strengths to the kinase if the activation state of the protein is not considered, making them difficult to distinguish using classical molecular biology tools. Screening methods that compare compound binding strengths to the different phosphorylation-controlled forms of Abl are available,27 as are those that use fluorescence resonance energy transfer (FRET) to track the conformational form of the protein once bound to unknown inhibitors,28 but they typically involve protein modifications, covalent tagging, and limited dynamic range, making them non-optimal for high-throughput screening efforts.
The CIU kinase inhibitor binding mode assay
Many results have demonstrated that, when collisionally activated in the gas-phase, protein ions of sufficiently low charge state can unfold.8a, 29 Gas-phase protein unfolding is distinct from protein denaturation in solution, and is primarily characterized by the adoption of multiple long-lived (>100 ms) intermediately unfolded species that are likely unique to the solvent free environment. Unfolding processes have been studied in both monomeric 18, 19b, 30 and multimeric 8a, 29a protein model systems as a means of providing information on local structure and stability changes that occur upon ligand binding.19a The CIU strategy employed here is significantly modified from these previous reports, as we have optimized our ability to distinguish between different kinase inhibitors by including both unfolding and dissociative transitions in our CIU fingerprints (Figure 1). Ions are first generated by nESI in a range of charge states, which are then filtered with a quadrupole mass analyzer. For much of our final dataset, have chosen to focus on 11+ Abl-inhibitor complex ions because they typically provide a larger number of unfolding transitions due to the increased Coulombic strain on the gas-phase protein.18 Following m/z selection, activation is achieved by accelerating ions into an ion trap pressurized with argon. Energetic collisions increase the internal temperature of the protein-ligand complex and illicit unfolding transitions. At coincident energies, the protein also undergoes charge-stripping (through the dissociation of small, loosely-bound, positively-charged counterions) and ligand dissociation events that we also collect into our CIU fingerprint. Since the unfolding transitions for these systems still dominate the fingerprints recorded, we term these data 'CIU Fingerprints'. We have extensively tracked the signals within these datasets to assign each transition observed (Figure S2), and including all three types of transitions shown in Figure 1 is critically important for differentiating kinase inhibitors using our approach. The total three-dimensional dataset is then combined by plotting the IM drift time features observed against the acceleration voltage used to generate them. We use a contour plot representation, as it also allows us to track the relative intensity of features in our CIU fingerprints across the entire dataset for given protein-inhibitor complex, and thus easily focus on areas within a given dataset that provide a maximized ability to distinguish between inhibitors of interest.
Figure 1.

Schematic describing the basic steps involved in the CIU assay to determine kinase inhibitor binding modes. Protein ligand complexes are ionized by nESI in a range of charge states (A), a single charge state is selected for activation in a quadrupole mass filter (B). Following selection, collisional activation with argon (varying the amount of accelerating voltage) is used to initiate three different processes: charge stripping, inhibitor dissociation, and gas-phase protein unfolding (C). IM drift time is monitored and recorded over a broad range of collision voltages to create a complete CIU fingerprint, which creates a contour plot of the intensity of ion populations as a function of these two parameters (D).
Identifying the expected CIU response for kinase inhibitors in different binding modes
In order to build, test, and evaluate our CIU method in the first instance, we selected two kinase inhibitors, one from each of the two types we intended to differentiate using our approach. For these initial experiments, we chose dasatinib and imatinib as our archetypal type I and II kinase inhibitors respectively. Both molecules are approved for leukemia treatment, and previous structural biology and screening data has shown that they are among the clearest examples of their respective binding modes (Figure S3A, B).31 CIU fingerprints for the 10+ complex ions for both inhibitors in the presence of apo-Abl reveal striking differences (Figure S3C–E). Three or four main CIU features are observed over the acceleration voltages shown, ranging from 9ms to 13ms, with imatinib-bound complexes displaying patterns where the feature at ~12ms is entirely absent. Strikingly, the ligand-bound proteins are both de-stabilized relative to the apo form in the gas-phase, which is unique among similar gas-phase protein-ligand stability measurements reported in the literature.19, 32 Most-importantly, we observe clear differences in the energetics of CIU, such that both ligand bound states can be differentiated from one another and the apo form simply by measuring the intensity of the compact state observed over a narrow window of collision voltages (dashed box regions, Figure S3C–E). The signal intensity difference observed between imatinib and dasatinib-bound complexes for the most-compact conformer is approximately 2.5-fold (Figure S3F), and thus provides us with a promising level of dynamic range and differentiating power relative to the two inhibitor-kinase binding modes targeted in these experiments.
A complete CIU training dataset from known kinase inhibitors
Building on the initial dataset shown in Figure S3, we have compiled a more complete CIU dataset for 11+ Abl-inhibitor complexes that includes 7 inhibitors previously classified by X-ray crystallography in complex with the Abl kinase (Figure 2). Within this dataset, we note that there are a number of CIU regions that may be optimal to differentiate type I and II inhibitors. For example, the region between 22V and 26V provides an IM spectrum analogous to the region between 32V and 42V shown in Figure S3, where the low-energy transitions of compact kinase-inhibitor complexes are probed. We also note that the region between 30V and 36V provides at least 3 drift time features, appearing between 10ms and 14ms that may be utilized for effective differentiation. We have extensively analyzed these two areas, along with the region between 40V and 44V, highlighted in Figure 2A. This final region provides ~8 drift time features between 8ms and 14ms for type II-bound Abl ions, while exhibiting 2 main drift time features for type I-bound proteins. We have computed average drift time spectra for this region of the CIU fingerprints (Figure 2B) and, in addition to the dramatic differences in the number of peaks observed, all of the centroid values for the drift time peaks recorded within this range are exclusive to either type I or type II datasets. Thus, while not all IM drift time peaks observed in our dataset are resolved, the dramatic differences in the number and centroid values for the features recorded between the two binding types allow us to use this region alone to differentiate type I and II kinase inhibitors. This result is critically important for using CIU in a high-throughput screening mode, as while complete CIU fingerprint data collected over the complete acceleration voltage ranges shown in Figures 2 and S3 can take many minutes to acquire, drift time data over a narrow acceleration voltage range can be acquired in seconds.
Figure 2.

CIU fingerprints for indicated 11+ Abl-inhibitor complex ions (A). Dashed areas are between 40 and 44 volts of acceleration voltage, and are color-coded to correspond with the known binding mode of the inhibitor (as previously). Average IM drift time data derived from integrating the dashed-box regions from A (B). Data from selected types (I and II as indicated) are averaged and displayed, and overlayed below. Average IM drift time data in this region provide the greatest dissimilarity between inhibitor binding types, revealing sufficient detail to classify all of the inhibitors studied in this report.
A simple scoring approach allows the differentiation of type I and II inhibitors based on CIU data
While the data above points toward the ability of a CIU-based IM-MS approach to engage in a high-throughput screen containing hundreds or thousands of potential inhibitors, simplified metrics that measure the similarity or difference of an experimental dataset when compared to reference data for either type I or type II inhibitors is necessary to enable such applications. We have evaluated the CIU data collected for 11 inhibitor-kinase complexes, comparing multiple CIU regions and applying a wide range of approaches to evaluate their similarity (Figure S4 and Table S1 and S2).26a, 33 The optimized approach that we have developed uses the selected region shown in Figure 4 and a simple χ2 –based score. In this way, we can evaluate the similarity of the IM drift time data recorded between 40V and 44V for an individual inhibitor complex and the averaged IM drift time data for type II inhibitors shown in Figure 2B. Despite the broad chemical space that we have probed using our CIU approach, the simple χ2 – based similarity score shown effectively clusters all type II and type I binders based on their similarity to the average type II CIU response. The similarity scores shown in Table 1 range from 100 (a normalized score) for imatinib, which has the greatest similarity to the average type II CIU response within the selected acceleration voltage range, to 21.8 for dasatinib, which exhibits the least similarity to the type II response and, therefore, the most type I character in our CIU dataset. The breadth of different scores, dispersed relatively evenly in the range defined by the two extreme responses recorded for imatinib and dasatinib-bound complexes, allows us to project that CIU data would allow for type I and II differentiation in an even broader chemical screen than shown here. Replicate experiments were performed and analyzed to provide standard deviations for the similarity scores shown, and these were found to represent 1.9% of the values on average.
Discussion
Most previous methodologies aimed at the rapid discovery of novel kinase inhibitors have not focused on differentiating the binding modes accessed by the small molecules screened, and have favored instead increased speed and chemical space over additional information content on the bound species created.34 More recently, viral-fusion Kd analysis,27 fluorescence,28 and affinity selection MS (AS-MS) approaches 35 have emerged with the ability to differentiate the binding modes of potential kinase inhibitors, with final verification of the inhibitor binding mode determined ultimately by solving the high-resolution structure of the complex.4 For example, based on the concentration-dependant binding curves observed for dissociated ligands captured following multi-stage chromatography, AS-MS can differentiate between inhibitors that bind in either a competitive, independent, or cooperative manner to the kinase. Generating such data, however, is time consuming due to the chromatographic separation typically employed and the multiple concentration dependent runs that must be generated, making such detailed AS-MS data difficult to acquire in a screening mode.35 While fluorescent based approaches are capable of generating binding mode information rapidly during screening, they require covalent modification of the kinase and typically have a low (10%) dynamic range with respect to the type I and II kinase binding modes discussed here.28 Similarly, viral fusion-based approaches,26c while enabling vast datasets of kinase-inhibitor interaction profiling and Kd measurements,26b require genetic fusion of the kinase to bacteriophage (or, in principle, other signal-amplifying tags) and display limited discriminating power for many type II inhibitors.27 The IM-MS and CIU methodologies disclosed in this report mitigate many of the limitations described above. CIU provides information that is clearly correlated to the kinase-inhibitor binding mode, can operate from mixtures or in competitive assays, requires little starting material, the data can be accumulated rapidly if regions of interest are identified (as above) that adequately differentiate between the structural states of interest, and does not require covalent modification of the protein substrate prior to screening. Despite the small difference in CCS between the active and inactive forms of the kinase predicted computationally (~1%),36 CIU data allows for their clear differentiation, and thus circumvents many of the traditional limitations of IM-MS where many protein tertiary structures overlap in drift time and cannot be resolved by their CCS alone with our IM-MS instrument (Figure S5, IM Resolution of ~100 is required).
A comparison of the results shown in Tables 1 and S1 reveals a clear advantage for performing CIU experiments using more highly-charged ions. This observation is not surprising, as previous protein complex CID and CIU datasets have suggested similar trends. For example, charge amplification protocols applied to the 396 kDa 24-mer of HSP16.5 from Methanococcus jannaschii 37 and the boiling stable protein 12-mer from Populus tremula 38 have revealed substantially enhanced unfolding and dissociation. Detailed computational and IM studies have linked the unfolding transitions observed in CIU to charge migration, which in turn relies upon the total amount of charge on the protein surface. As such, charge amplification agents (i.e. sulfolane) may be useful in enhancing the CIU information content presented in this report,39 while acknowledging the potential for such additives to alter the ability of protein ions to access compact starting structures.40 Critically, the 11+ charge state of Abl-inhibitor complexes is sufficient to effectively differentiate between the activation states of the protein complexes probed here, as well as demarcate a strong correlation between inhibitor binding mode and CIU response.
The training dataset used to validate the CIU method presented in this report contains 11 total inhibitors (5 type II, and 6 type I) selected in order to represent a broad range of structures, binding constants, and molecular masses. Inhibitors were also selected for this initial set based on the availability of high-resolution structural data confirming the binding mode accessed with either Abl or other kinase domains that possess a high degree of sequence homology (Table 1). The 11 compounds included here represent all the commercially available compounds that fit the above criteria. It is worth noting that the total number of compounds we have used in proof-of-principle experiments in this report is significantly greater than that used in previous technology development efforts. We have undertaken these extra steps primarily due to the novel nature of the CIU technology employed in our assay. A detailed analysis of the data presented in Table 1 reveals a number of inhibitors clustered around a similarity score of 43, and this value would be a likely cut-off point for future screening applications that utilize the CIU protocol described here. It is worth noting that while using this similarity score as a cut-off may engender a significant false positive rate, based on the fact that DCC-2036, bosutinib, and tozasertib all posses scores within error of this value, it is also clear that this rate can be adjusted to easily accommodate a more-stringent screen without a significant loss of dynamic range. The average type II similarity score of 65.6 is 1.4 standard deviations away from the average type I value of 34.2. We find that type I values are more-tightly clustered in our dataset, having a standard deviation of 9.0, which places the mean type I response 3.5 standard deviations from that of the average type II. We have used our current dataset to extrapolate the potential results in a larger library screen (Figure S6) as well as investigate alternate scoring functions for our dataset (Table S2). In all cases, we find strong evidence of correlation between the CIU response described here and the known kinase-inhibitor binding modes for the complexes within our dataset.
Limitations of the CIU approach currently revolve around the potential universality of the technology. In order to measure a CIU response, kinase-inhibitor complexes must first be generated by nESI, which is a property that may not be constant across all kinases and inhibitors. We note, however, that Abl and other related kinases have, so far, provided excellent signal intensities and dynamic range for our experiments. In addition, while the correlations reported here remain robust, the mechanism of CIU depends, in a relatively unknown way, on the structure of the intermediates generated during gas-phase activation. As such, example inhibitors must be identified in order to train the CIU methodology prior to screening a new protein target and complete CIU fingerprints of the desired binding targets must be obtained initially so that regions of discriminatory power can be identified.
Conclusions
In summary, we present strong evidence indicating a marked correlation between the gas-phase unfolding of kinase-inhibitor complexes and their known activation states when bound to the same inhibitors in solution. Our assay integrates elements of CID and CIU for the first time to maximize the discriminatory power of the IM-MS data observed. We utilized CIU fingerprint analysis to identify regions of maximum difference between Abl kinase ions bound to type I and II inhibitors, and developed a simple scoring metric that clusters these data in a manner precisely correlated with their known binding modes. Overall, our data suggests that the CIU approach presented will likely be a highly-effective screening tool that obviates many of the limitations of current technologies. Future CIU development work will seek to use larger screening datasets to accurately define the discrimination power and confidence intervals associated with type I and II kinase binders, investigate the ability of CIU to screen for allosteric (type IV) kinase inhibitors (e.g., GNF-2) 34, and develop screens for other kinases linked to cancer (e.g., Src).20
Supplementary Material
Acknowledgments
The authors thank Meghan Breen and Steve Bremmer for their aid in collecting the kinase activity analysis data shown. BTR acknowledges support of this project, in part, by an Oak Ridge Associated Universities Powe Award and a Research Award from the American Society for Mass Spectrometry. MBS acknowledges NIH grant R01GM088546 and the University of Michigan College of Pharmacy. JNR acknowledges support from the University of Michigan Rackham Graduate School in the form of a Rackham Merit Fellowship and a Research Award.
Footnotes
Supporting Information Available: Kinase activity analysis data, detailed CIU similarity analyses, CIU fingerprint breakdowns, average Type I and Type II response drift time data, IM separations of intact protein-ligand complexes, and extrapolated overlaps for larger inhibitor screens, are presented. This material is available free of charge via the Internet at http://pubs.acs.org.
References
- 1.Krause DS, Van Etten RA. N. Engl. J. Med. 2005;353:172–187. doi: 10.1056/NEJMra044389. [DOI] [PubMed] [Google Scholar]
- 2.Deininger MWN, Goldman JM, Melo JV. Blood. 2000;96:3343–3356. [PubMed] [Google Scholar]
- 3.Liu Y, Gray NS. Nat. Chem. Biol. 2006;2:358–364. doi: 10.1038/nchembio799. [DOI] [PubMed] [Google Scholar]
- 4.Thaimattam R, Banerjee R, Miglani R, Iqbal J. Curr. Pharm. Design. 2007;13:2751–2765. doi: 10.2174/138161207781757042. [DOI] [PubMed] [Google Scholar]
- 5.Bixby D, Talpaz M. ASH Education Program Book. 2009;2009:461–476. doi: 10.1182/asheducation-2009.1.461. [DOI] [PubMed] [Google Scholar]
- 6.(a) Giles K, Williams JP, Campuzano I. Rapid Commun. Mass Spectrom. 2011;25:1559–1566. doi: 10.1002/rcm.5013. [DOI] [PubMed] [Google Scholar]; (b) Zhong Y, Hyung SJ, Ruotolo BT. Analyst. 2011;136:3534–3541. doi: 10.1039/c0an00987c. [DOI] [PubMed] [Google Scholar]
- 7.(a) Clemmer DE, Jarrold MF. J. Mass Spectrom. 1997;32:577–592. [Google Scholar]; (b) McLean JA, Ruotolo BT, Gillig KJ, Russell DH. Int. J. Mass Spectrom. 2005;240:301–315. [Google Scholar]; (c) Vonhelden G, Wyttenbach T, Bowers MT. Science. 1995;267:1483–1485. doi: 10.1126/science.267.5203.1483. [DOI] [PubMed] [Google Scholar]
- 8.(a) Ruotolo BT, Giles K, Campuzano I, Sandercock AM, Bateman RH, Robinson CV. Science. 2005;310:1658–1661. doi: 10.1126/science.1120177. [DOI] [PubMed] [Google Scholar]; (b) Zhong Y, Hyung SJ, Ruotolo BT. Expert Rev. Proteomics. 2012;9:47–58. doi: 10.1586/epr.11.75. [DOI] [PMC free article] [PubMed] [Google Scholar]; (c) Heck AJR. Nat. Methods. 2008;5:927–933. doi: 10.1038/nmeth.1265. [DOI] [PubMed] [Google Scholar]
- 9.Benesch JLP, Ruotolo BT. Curr. Opin. Struct. Biol. 2011;21:641–649. doi: 10.1016/j.sbi.2011.08.002. [DOI] [PMC free article] [PubMed] [Google Scholar]
- 10.Ruotolo BT, Robinson CV. Curr. Opin. Chem. Biol. 2006;10:402–408. doi: 10.1016/j.cbpa.2006.08.020. [DOI] [PubMed] [Google Scholar]
- 11.Jarrold MF. Phys. Chem. Chem. Phys. 2007;9:1659–1671. doi: 10.1039/b612615d. [DOI] [PubMed] [Google Scholar]
- 12.(a) Faull PA, Korkeila KE, Kalapothakis JM, Gray A, McCullough BJ, Barran PE. Int. J. Mass Spectrom. 2009;283:140–148. [Google Scholar]; (b) Wyttenbach T, Grabenauer M, Thalassinos K, Scrivens JH, Bowers MT. J. Phys. Chem. B. 2010;114:437–447. doi: 10.1021/jp906242m. [DOI] [PubMed] [Google Scholar]
- 13.(a) Mao Y, Ratner MA, Jarrold MF. J. Phys. Chem. B. 1999;103:10017–10021. [Google Scholar]; (b) Tao L, Dahl DB, Perez LM, Russell DH. J. Am. Soc. for Mass Spectrom. 2009;20:1593–1602. doi: 10.1016/j.jasms.2009.04.018. [DOI] [PubMed] [Google Scholar]
- 14.Segev E, Wyttenbach T, Bowers MT, Gerber RB. Phys. Chem. Chem. Phys. 2008;10:3077–3082. doi: 10.1039/b718610j. [DOI] [PubMed] [Google Scholar]
- 15.Baumketner A, Bernstein SL, Wyttenbach T, Bitan G, Teplow DB, Bowers MT, Shea JE. Protein Sci. 2006;15:420–428. doi: 10.1110/ps.051762406. [DOI] [PMC free article] [PubMed] [Google Scholar]
- 16.Suckau D, Shi Y, Beu SC, Senko MW, Quinn JP, Wampler FM, McLafferty FW. Proc. Natl. Acad. Sci. U. S. A. 1993;90:790–793. doi: 10.1073/pnas.90.3.790. [DOI] [PMC free article] [PubMed] [Google Scholar]
- 17.Wittmer D, Luckenbill BK, Hill HH, Chen YH. Anal. Chem. 1994;66:2348–2355. [Google Scholar]
- 18.Shelimov KB, Clemmer DE, Hudgins RR, Jarrold MF. J. Am. Chem. Soc. 1997;119:2240–2248. [Google Scholar]
- 19.(a) Hyung S-J, Robinson CV, Ruotolo BT. Chem. Biol. 2009;16:382–390. doi: 10.1016/j.chembiol.2009.02.008. [DOI] [PubMed] [Google Scholar]; (b) Hopper JTS, Oldham NJ. J. Am. Soc. Mass Spectrom. 2009;20:1851–1858. doi: 10.1016/j.jasms.2009.06.010. [DOI] [PubMed] [Google Scholar]
- 20.Seeliger MA, Nagar B, Frank F, Cao X, Henderson MN, Kuriyan J. Structure. 2007;15:299–311. doi: 10.1016/j.str.2007.01.015. [DOI] [PubMed] [Google Scholar]
- 21.Ruotolo BT, Benesch JLP, Sandercock AM, Hyung SJ, Robinson CV. Nat. Protoc. 2008;3:1139–1152. doi: 10.1038/nprot.2008.78. [DOI] [PubMed] [Google Scholar]
- 22.Benesch JLP, Ruotolo BT, Simmons DA, Robinson CV. Chem. Rev. 2007;107:3544–3567. doi: 10.1021/cr068289b. [DOI] [PubMed] [Google Scholar]
- 23.Hernandez H, Robinson CV. Nat. Protoc. 2007;2:715–26. doi: 10.1038/nprot.2007.73. [DOI] [PubMed] [Google Scholar]
- 24.Pearson K. Philosophical Magazine, Series 5. 1900;50:157–175. [Google Scholar]
- 25.(a) Xue RY, Dong L, Zhang S, Deng CH, Liu TT, Wang JY, Shen XZ. Rapid Commun. Mass Spectrom. 2008;22:1181–1186. doi: 10.1002/rcm.3466. [DOI] [PubMed] [Google Scholar]; (b) Park JW, Song JY, Lee SG, Jun JS, Park JU, Chung MJ, Ju JS, Nizamutdinov D, Chang MW, Youn HS, Kang HL, Baik SC, Lee WK, Cho MJ, Rhee KH. Helicobacter. 2006;11:533–543. doi: 10.1111/j.1523-5378.2006.00456.x. [DOI] [PubMed] [Google Scholar]; (c) Roth O, Spreux-Varoquaux O, Bouchet S, Rousselot P, Castaigne S, Rigaudeau S, Raggueneau V, Therond P, Devillier P, Molimard M, Maneglier B. Clin. Chim. Acta. 2010;411:140–146. doi: 10.1016/j.cca.2009.10.007. [DOI] [PubMed] [Google Scholar]
- 26.(a) Davis MI, Hunt JP, Herrgard S, Ciceri P, Wodicka LM, Pallares G, Hocker M, Treiber DK, Zarrinkar PP. Nat. Biotechnol. 2011;29:1046–U124. doi: 10.1038/nbt.1990. [DOI] [PubMed] [Google Scholar]; (b) Karaman MW, Herrgard S, Treiber DK, Gallant P, Atteridge CE, Campbell BT, Chan KW, Ciceri P, Davis MI, Edeen PT, Faraoni R, Floyd M, Hunt JP, Lockhart DJ, Milanov ZV, Morrison MJ, Pallares G, Patel HK, Pritchard S, Wodicka LM, Zarrinkar PP. Nat. Biotechnol. 2008;26:127–132. doi: 10.1038/nbt1358. [DOI] [PubMed] [Google Scholar]; (c) Fabian MA, Biggs WH, Treiber DK, Atteridge CE, Azimioara MD, Benedetti MG, Carter TA, Ciceri P, Edeen PT, Floyd M, Ford JM, Galvin M, Gerlach JL, Grotzfeld RM, Herrgard S, Insko DE, Insko MA, Lai AG, Lelias JM, Mehta SA, Milanov ZV, Velasco AM, Wodicka LM, Patel HK, Zarrinkar PP, Lockhart DJ. Nat. Biotechnol. 2005;23:329–336. doi: 10.1038/nbt1068. [DOI] [PubMed] [Google Scholar]
- 27.Wodicka LM, Ciceri P, Davis MI, Hunt JP, Floyd M, Salerno S, Hua XH, Ford JM, Armstrong RC, Zarrinkar PP, Treiber DK. Chem. Biol. 2010;17:1241–1249. doi: 10.1016/j.chembiol.2010.09.010. [DOI] [PubMed] [Google Scholar]
- 28.Simard JR, Kluter S, Grutter C, Getlik M, Rabiller M, Rode HB, Rauh D. Nat. Chem. Biol. 2009;5:394–396. doi: 10.1038/nchembio.162. [DOI] [PubMed] [Google Scholar]
- 29.(a) Ruotolo BT, Hyung S-J, Robinson PM, Giles K, Bateman RH, Robinson CV. Angew. Chem. Int. Edit. 2007;46:8001–8004. doi: 10.1002/anie.200702161. [DOI] [PubMed] [Google Scholar]; (b) Benesch JLP. J. Am. Soc. Mass Spectrom. 2009;20:341–348. doi: 10.1016/j.jasms.2008.11.014. [DOI] [PubMed] [Google Scholar]
- 30.Badman ER, Hoaglund-Hyzer CS, Clemmer DE. Anal. Chem. 2001;73:6000–6007. doi: 10.1021/ac010744a. [DOI] [PubMed] [Google Scholar]
- 31.Vajpai N, Strauss A, Fendrich G, Cowan-Jacob SW, Manley PW, Grzesiek S, Jahnke W. J. Biol. Chem. 2008;283:18292–18302. doi: 10.1074/jbc.M801337200. [DOI] [PubMed] [Google Scholar]
- 32.(a) Han L, Hyung S-J, Mayers JJS, Ruotolo BT. J. Am. Chem.Soc. 2011;133:11358–11367. doi: 10.1021/ja203527a. [DOI] [PMC free article] [PubMed] [Google Scholar]; (b) Han LJ, Hyung S-J, Ruotolo BT. Angew. Chem. Int. Edit. 2012;51:5692–5695. doi: 10.1002/anie.201109127. [DOI] [PMC free article] [PubMed] [Google Scholar]
- 33.(a) Muratore KE, Seeliger MA, Wang ZH, Fomina D, Neiswinger J, Havranek JJ, Baker D, Kuriyan J, Cole PA. Biochemistry. 2009;48:3378–3386. doi: 10.1021/bi900057g. [DOI] [PMC free article] [PubMed] [Google Scholar]; (b) Hennequin LF, Allen J, Breed J, Curwen J, Fennell M, Green TP, Brempt C, Morgentin R, Norman RA, Olivier A, Otterbein L, Ple PA, Warin N, Costello G. J. Med. Chem. 2006;49:6465–6488. doi: 10.1021/jm060434q. [DOI] [PubMed] [Google Scholar]; (c) Namboodiri HV, Bukhtiyarova M, Ramcharan J, Karpusas M, Lee Y, Springman EB. Biochemistry. 2010;49:3611–3618. doi: 10.1021/bi100070r. [DOI] [PubMed] [Google Scholar]
- 34.Adrian FJ, Ding Q, Sim TB, Velentza A, Sloan C, Liu Y, Zhang GB, Hur W, Ding S, Manley P, Mestan J, Fabbro D, Gray NS. Nat. Chem. Biol. 2006;2:95–102. doi: 10.1038/nchembio760. [DOI] [PubMed] [Google Scholar]
- 35.Annis DA, Nazef N, Chuang CC, Scott MP, Nash HM. J. Am. Chem. Soc. 2004;126:15495–15503. doi: 10.1021/ja048365x. [DOI] [PubMed] [Google Scholar]
- 36.Mesleh MF, Hunter JM, Shvartsburg AA, Schatz GC, Jarrold MF. J. Phys. Chem. 1996;100:16082–16086. [Google Scholar]
- 37.Benesch JLP, Ruotolo BT, Sobott F, Wildgoose J, Gilbert A, Bateman R, Robinson CV. Anal. Chem. 2009;81:1270–1274. doi: 10.1021/ac801950u. [DOI] [PubMed] [Google Scholar]
- 38.Erba EB, Ruotolo BT, Barsky D, Robinson CV. Anal. Chem. 2010;82:9702–9710. doi: 10.1021/ac101778e. [DOI] [PubMed] [Google Scholar]
- 39.Lomeli SH, Peng IX, Yin S, Loo RRO, Loo JA. J. Am. Soc. Mass Spectrom. 2010;21:127–131. doi: 10.1016/j.jasms.2009.09.014. [DOI] [PMC free article] [PubMed] [Google Scholar]
- 40.Hogan CJ, Loo RRO, Loo JA, de la Mora JF. Phys. Chem. Chem. Phys. 2010;12:13476–13483. doi: 10.1039/c0cp01208d. [DOI] [PubMed] [Google Scholar]
Associated Data
This section collects any data citations, data availability statements, or supplementary materials included in this article.