Abstract
Purpose
To evaluate how changes in tumor hypoxia, according to serial fluorine-18-labeled fluoro-misonidazole (18F-FMISO) positron emission tomography (PET) imaging, affect the efficacy of intensity-modulated radiotherapy (IMRT) dose painting.
Methods and Materials
Seven patients with head and neck cancers were imaged twice with FMISO PET, separated by 3 days, before radiotherapy. Intensity-modulated radiotherapy plans were designed, on the basis of the first FMISO scan, to deliver a boost dose of 14 Gy to the hypoxic volume, in addition to the 70-Gy prescription dose. The same plans were then applied to hypoxic volumes from the second FMISO scan, and the efficacy of dose painting evaluated by assessing coverage of the hypoxic volumes using Dmax, Dmin, Dmean, D95, and equivalent uniform dose (EUD).
Results
Similar hypoxic volumes were observed in the serial scans for 3 patients but dissimilar ones for the other 4. There was reduced coverage of hypoxic volumes of the second FMISO scan relative to that of the first scan (e.g., the average EUD decreased from 87 Gy to 80 Gy). The decrease was dependent on the similarity of the hypoxic volumes of the two scans (e.g., the average EUD decrease was approximately 4 Gy for patients with similar hypoxic volumes and approximately 12 Gy for patients with dissimilar ones).
Conclusions
The changes in spatial distribution of tumor hypoxia, as detected in serial FMISO PET imaging, compromised the coverage of hypoxic tumor volumes achievable by dose-painting IMRT. However, dose painting always increased the EUD of the hypoxic volumes.
Keywords: Tumor hypoxia, Dose painting, 18F-FMISO PET
INTRODUCTION
Despite the many advances in the treatment of head-and-neck cancers with chemoradiotherapy (e.g., hyperfractionation and new cytotoxic agents), local failure still can be as high as 50% (1, 2). Using intensity-modulated radiotherapy (IMRT), with which one can deliver radiation more precisely and to a higher dose while sparing the surrounding normal structures, locoregional control in excess of 90% has been reported (3, 4). However, clinical studies examining the patterns of failure in patients treated with IMRT indicated that some recurrence occurred within the gross target volume (GTV) (5, 6). Although investigators have suggested that further dose escalation may be needed, indiscriminate dose escalation may result in unwarranted acute and late toxicities.
A half century ago Thomlinson and Gray (7) suggested that low oxygen levels exist in tumors and could lead to treatment failure. Recent publications (8–11) provided evidence that hypoxia has a negative impact on tumor response to radiation and other methods of therapy. Tumor hypoxia has been correlated to radioresistance and poorer clinical outcome, both in terms of overall survival and local control, as well as distant metastasis.
That tumor hypoxia is associated with a more aggressive tumor phenotype may underlie the poorer prognosis for surgical patients whose tumors have significant hypoxic fraction. Specifically, the hypoxic environment is selective for genetically unstable tumor cells, and hypoxia is associated with tumors that are more likely to metastasize (12–15). Such tumor characteristics are likely due to hypoxia-associated molecular pathways, which regulate the expression of many genes, some of which are associated with tumor progression and malignant phenotypes.
To overcome tumor hypoxia–mediated radioresistance, a number of strategies have been proposed. The hypoxic cell–specific cytotoxin tirapazamine has produced encouraging early results in chemoradiotherapy clinical trials of head-and-neck cancers (16, 17), although recently the study has been closed. The simultaneous application of carbogen breathing and nicotinamide has also improved clinical outcomes for patients with head-and-neck cancer who received radiation treatment (18). Another approach to overcome hypoxia-related resistance is to use IMRT to give a higher dose to the hypoxic volume (19, 20).
The use of IMRT to boost the radiation dose to the hypoxic volume requires methods to noninvasively image tumor hypoxia. One promising approach is to use positron emission tomography (PET) scanning with a hypoxia-specific radio-tracer. In this regard, a number of radiotracers have been developed and evaluated, including fluorine-18-labeled fluoromisonidazole (18F-FMISO), 18F-fluoroerythronitroimidazole (21), 18F-EF5 (22), and 60Cu(II)-diacetyl-bis(N4-methylthiosemicarbazone) (23). Recently we have performed PET imaging with 18F-FMISO (abbreviated as FMISO) in patients with head-and-neck cancer to explore the possibility of applying dose painting to hypoxic regions with IMRT (24, 25).
In our recent study we demonstrated in 10 patients the feasibility of using IMRT to increase the dose to the hypoxic region by approximately 20% to 84 Gy, while keeping the organs at risk at the same tolerance levels (24, 25). In the same study we evaluated whether the pretreatment hypoxia images were invariant over time by performing two PET scans (FMISO PET) separated by 3 days (24, 25). Briefly, we observed changes in tumor hypoxia as defined by the sequential PET images, with the changes being quite significant in a subset of patients (25).
In this study, as a follow-up to our previous investigations, we studied the influence of changes in hypoxia images on IMRT dose painting for 7 patients. Specifically, we applied the IMRT dose distribution derived using the first FMISO PET scan to the hypoxic region of the second FMISO PET scan and evaluated the coverage of that hypoxic volume.
METHODS AND MATERIALS
Patients
A protocol entitled “A feasibility study of using fluorine-18-la-beled fluoro-misonidazole positron emission tomography to detect hypoxia in head-and-neck cancer patients” was approved by our institution’s institutional review board (#04–070) for patient accrual in 2004 (24). The purpose of this protocol was to determine the efficacy of using FMISO PET scanning to define tumor hypoxia and to study the reproducibility of hypoxic regions defined from these scans. Patient selection for the IMRT feasibility study is described in the report by Lee et al. (24). Briefly, 28 patients signed informed consent forms and were enrolled between August 2004 and October 2005, and 20 of these completed the requirements of the protocol. Of the 20 patients, 8 were excluded from the IMRT feasibility study owing to missing blood profile (n = 6) and coagulated blood (n = 2). To use a uniform standard for the delineation of hypoxia in FMISO PET scans, we chose a tumor/blood ratio of 1.3 to define the hypoxic region. This resulted in the exclusion of 2 additional patients owing to abnormally high hypoxic volumes suggesting that a threshold value of 1.3 was inappropriate for these 2 patients. For the present study the second FMISO PET scan was also used, which resulted in the further exclusion of 3 patients owing to unacceptable second scans. Thus, 7 patients were included in this study: 3 with base-of-tongue cancer, 2 with tonsil cancer, and 2 with larynx cancer.
Each patient received two FMISO PET scans before treatment and one scan during treatment. In the IMRT dose-painting feasibility study, hypoxic target volumes defined from the first FMISO scan were selectively boosted to 84 Gy, and the effects on the treatment plan has been described (24, 25). In this investigation we applied the same treatment plans (derived from the first FMISO scans) to hypoxic volumes defined by the second FMISO scans to dosimetrically assess the effects of changes of hypoxia images on dose-painting treatment planning.
Computed tomography simulation, FDG-PET, and FMISO PET scans
Patients were immobilized for simulation and treatment using an Aquaplast mask (Orfit Industries, Wijnegem, Belgium) that extended to the shoulders. An isocenter was determined at simulation; skin marks as well as markings on the mask were used to facilitate treatment setup and ensure proper repositioning. Patients were scanned with a 3-mm slice thickness on a Philips AcQSim CT scanner (Philips Medical Systems, Eindhoven, The Netherlands).
All patients received a magnetic resonance imaging scan before simulation. On the same day as the computed tomography (CT) simulation, patients also received a FDG PET/CT scan. Patients were scanned 45 min after injection on a GE Discovery LS PET/CT scanner (General Electric, Waukesha, WI) using the same immobilization device as used for CT simulation to facilitate image registration. In addition, fiducial markers were placed on the mask to aid in locating the isocenter on the FDG scan.
We have previously described the procedure for PET imaging with the hypoxic tracer FMISO (24). Briefly, on the day after the CT simulation, patients received a FMISO PET/CT scan on the GE Discovery LS. Patients were positioned in the same manner as in the CT simulation. Two venous access lines were established in each arm, one for FMISO injection and the other for blood sampling. Patients were injected intravenously with approximately 10 mCi of FMISO. The mean acquisition time for FMISO data for all patients was 162 min after injection. Three days later, patients received a second FMISO PET/CT scan using the same method.
Delineation of target volumes for treatment planning
Target volumes were delineated on the simulation CT scan by the radiation oncologist with the help of a nuclear medicine physician. The FDG PET/CT images, geometrically registered with the simulation CT, were used as an aid. The FMISO information was not used for clinical treatment-planning purposes. Gross tumor volume (GTV) was delineated as the disease visible on CT and/or FDG PET. If appropriate, clinical tumor volume was classified as high risk (CTVHR) or low risk (CTVLR), representing regions at high and low risks for microscopic disease. Corresponding planning target volumes (PTVGTV, PTVHR, and PTVLR) were created by 5-mm expansion (or 3 mm when critical structures were abutting). A dose of 70 Gy was prescribed to the PTVGTV, 59.4 Gy to the PTVHR, and 54 Gy to PTVLR.
In addition, the following standard critical structures necessary for treatment planning were delineated by the radiation oncologist or the treatment-planning physicist: spinal cord, brainstem, parotid glands, cochlea, oral cavity, mandible/temporomandibular joint, larynx, brachial plexus, and esophagus. The clinical constraints for target and critical structures used for treatment planning have been previously described (24).
Treatment plans were developed using the Memorial Sloan-Kettering Cancer Center (MSKCC) computerized treatment-planning system. All patients were treated with IMRT with dose distribution optimized using the inverse planning method previously developed at our institution.
Delineation of hypoxic target volume on FMISO PET scans
In previous FMISO PET studies, particularly by the University of Washington researchers, tumor/blood ratios of 1.2–1.5 have been used as thresholds for identifying tumor hypoxia (26, 27). For the purpose of this study and our previous IMRT feasibility study (24), we chose a tumor/blood ratio of 1.3, in the middle of the range of reported thresholds. (In another study of ours, Nehmeh et al. [25] used 1.2 as the threshold and observed similar variations in hypoxic volume reported here, leading us to surmise that the use of other threshold values will not affect the main conclusions of this study.)
To delineate the hypoxic region of the tumor for the development of the dose-painting treatment plan, we first spatially registered the planning CT scan (from CT simulation) with the CT from the FMISO PET/CT scan, using software developed at MSKCC. Because the PET and CT images of the PET/CT scan were already in the same coordinate system, this procedure simultaneously spatially registered the planning CT scan to the FMISO PET scan. With the two sets of images displayed side by side, the regions on the FMISO images with tumor/blood ratios of ≥1.3 were delineated, mapped onto the planning CT, and designated and displayed as hypoxic target volumes. The hypoxic target volumes were saved in the planning CT scan and then transferred by DICOM-RT to the MSKCC computer system for dose-painting treatment planning. The same procedure was followed for both FMISO PET data sets, except that dose-painting treatment planning was only performed using the hypoxic volume derived from the first FMISO scan.
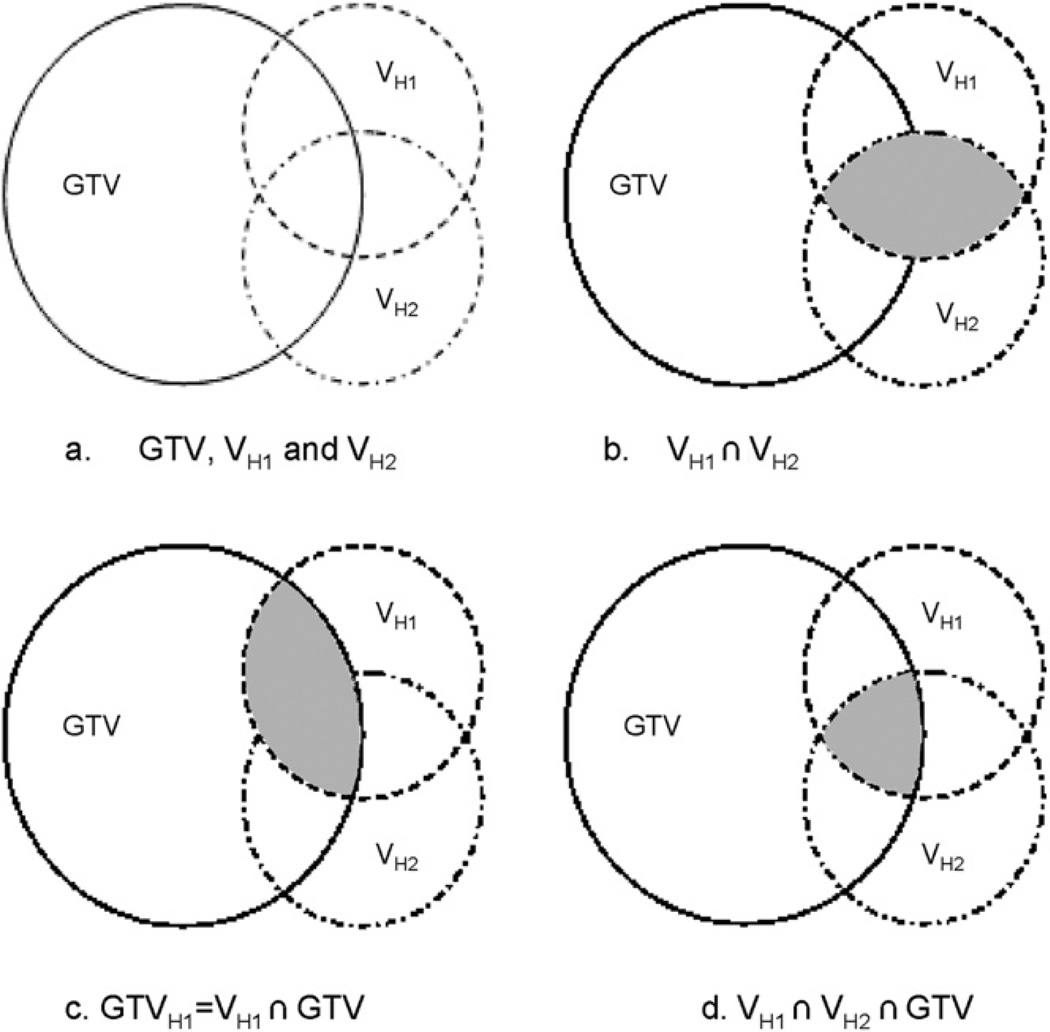
Figure 1 illustrates the spatial relationship between the GTV of the clinical treatment plan and the hypoxic volumes from the first and second FMISO scans (VH1 and VH2). We define GTVH1 as the overlap between the GTV and VH1, and likewise, GTVH2 as that between GTV and VH2. These definitions can be expressed as follows:
Fig. 1.
Schematics illustrating the spatial relationship between the gross tumor volume (GTV), VH1, and VH2 (hypoxia volumes from the two FMISO scans, respectively). (b) The shaded part shows the volume of intersection between VH1 and VH2. (c) The shaded part is the volume of intersection between VH1 and GTV. (d) The shaded part is the volume of intersection between VH1 and VH2 and GTV.
Study of dose-painting plans on hypoxic volumes from serial PET scans
Once the contours of the hypoxic regions from the FMISO PET scans were incorporated into the planning CT, the hypoxic GTV volumes were delineated as defined above. Using the GTVH1 volumes, dose-painting treatment planning was carried out in our previous study. Briefly, in that study we showed that it was feasible to boost GTVH1 to 84 Gy, while delivering 70 Gy to the PTVGTV and respecting the tolerance dose of the surrounding critical structures.
In the present study the dose-painting treatment plans developed according to GTVH1 were applied to GTVH2 to determine the coverage to the hypoxic volume delineated from the second FMISO scan. Coverage, as evaluated by maximum dose (Dmax), minimum dose (Dmin), mean dose (Dmean), dose covering 95% of the volume (D95), and equivalent uniform dose (EUD) (see below), was compared between GTVH1 and GTVH2, and the results were tested for correlation between change in coverage and degree of overlap between GTVH1 and GTVH2.
Equivalent uniform dose
Equivalent uniform dose is defined for tumors as the biologic equivalent dose that, if given uniformly, will lead to the same cell kill in the tumor volume as the actual nonuniform dose distribution. It is given by the following generalized formula (28):
where the sum is over all the dose bins, with Di being the dose in bin i and Vi the fractional volume of GTVH1 (or GTVH2) receiving Di. For tumors, n is usually a large negative number, chosen to be −30 in this study. Equivalent uniform dose was calculated accordingly with the above formula for GTVH1 and GTVH2, respectively, and compared.
RESULTS
Table 1 summarizes the various volumes of interest as defined in Fig. 1. Both the volume of the hypoxic region (VH where H can be H1 or H2) and the volume of the hypoxic GTV used in the study (GTVH where H can be H1 or H2) are given, as well as the volume of intersection between the two VH volumes and the volume of intersection of the two GTVH volumes.
Table 1.
Various volume parameters (see Fig. 1) derived from the positron emission tomography images
| Patient no. (site of tumor) |
FMISO scan |
Vol (VH) (cm3) | Vol (VH1∩VH2)/ Vol (VH1) |
Vol (VH1∩VH2)/ Vol (VH2) |
Vol (GTV) (cm3) |
Vol (GTVH) (cm3) |
Vol (GTVH1∩GTVH2) |
|---|---|---|---|---|---|---|---|
| 1 (BOT) | 1 | 5.39 | 0.98 | 28.61 | 3.87 | 3.81 | |
| 2 | 26.94 | 0.20 | 13.00 | ||||
| 2 (tonsil) | 1 | 51.44 | 0.75 | 95.48 | 45.68 | 35.82 | |
| 2 | 44.65 | 0.86 | 39.79 | ||||
| 3 (BOT) | 1 | 19.04 | 0.72 | 140.79 | 18.33 | 13.27 | |
| 2 | 18.42 | 0.74 | 18.10 | ||||
| 4 (BOT) | 1 | 3.48 | 0.86 | 92.14 | 3.08 | 2.72 | |
| 2 | 8.62 | 0.35 | 7.79 | ||||
| 5 (larynx) | 1* | 11.84 | 0.66 | 55.23 | 11.76 | 7.78 | |
| 2* | 13.01 | 0.60 | 12.52 | ||||
| 6 (tonsil) | 1 | 2.54 | 0.37 | 23.45 | 2.53 | 0.94 | |
| 2 | 1.27 | 0.74 | 1.27 | ||||
| 7 (larynx) | 1† | 5.07 | 0.80 | 32.24 | 3.00 | 2.53 | |
| 2† | 11.70 | 0.35 | 7.12 |
Abbreviations: FMISO = fluorine-18-labeled fluoro-misonidazole; GTV = gross tumor volume; BOT = base of tongue.
Three hypoxic regions.
Two hypoxic regions.
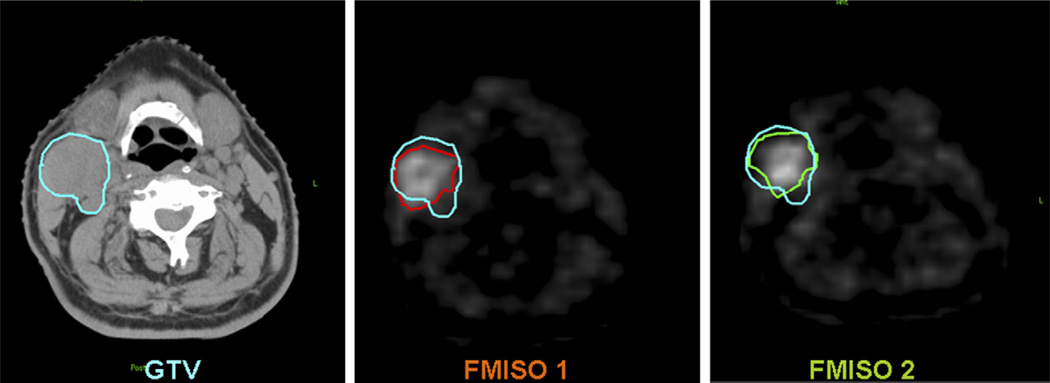
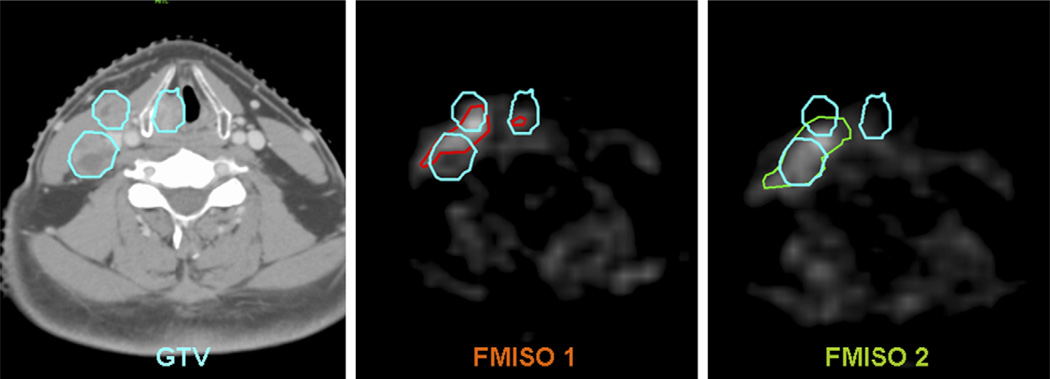
As shown in Column 3 of Table 1, not all of the volumes of hypoxia (VH) were similar between the first and second FMISO PET. A tumor section with similar hypoxic regions is shown in Fig. 2 (Patient 2), in which the two FMISO images are closely matched and within the GTV. An example of a tumor section with dissimilar hypoxic regions is shown in Fig. 3 (Patient 7). In the second FMISO scan for this patient, one of the sub-volumes in GTVH1 increased in size and the other sub-volume was not detected.
Fig. 2.
Corresponding transaxial images of computed tomography, FMISO 1, and FMISO 2 showing the gross tumor volume (GTV) (blue), VH1 (red), and VH2 (green) in Patient 2 of Table 1.
Fig. 3.
Corresponding transaxial images of computed tomography, FMISO 1, and FMISO 2 showing the gross tumor volume (GTV) (blue, consisting of three sub-volumes), VH1 (red), and VH2 (green) in Patient 7 of Table 1.
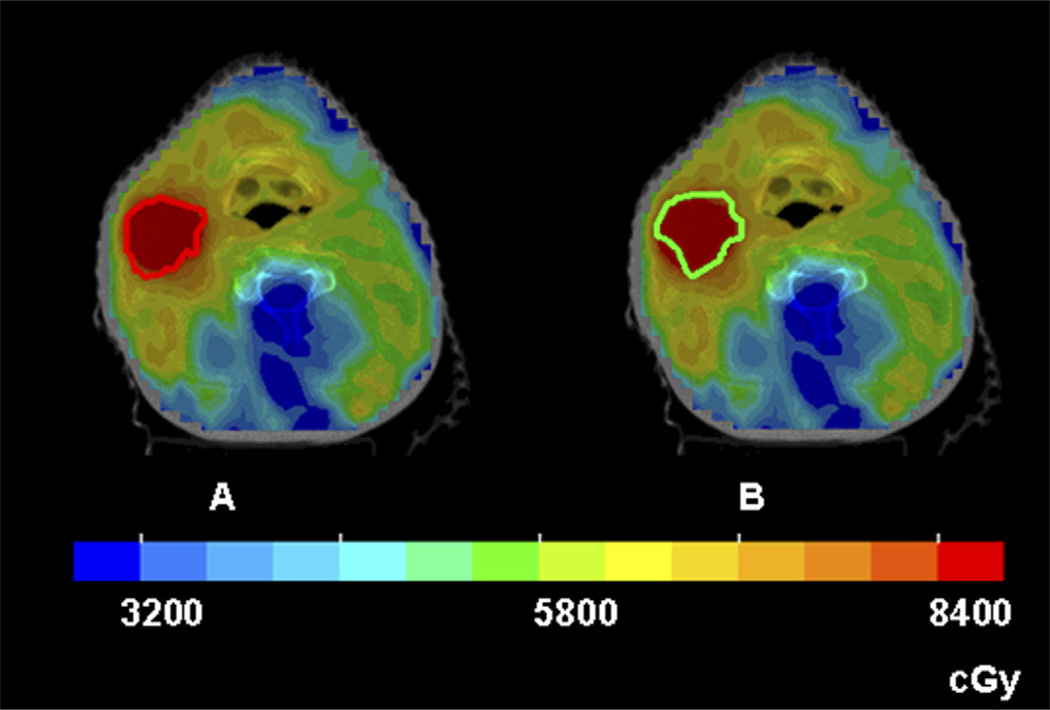
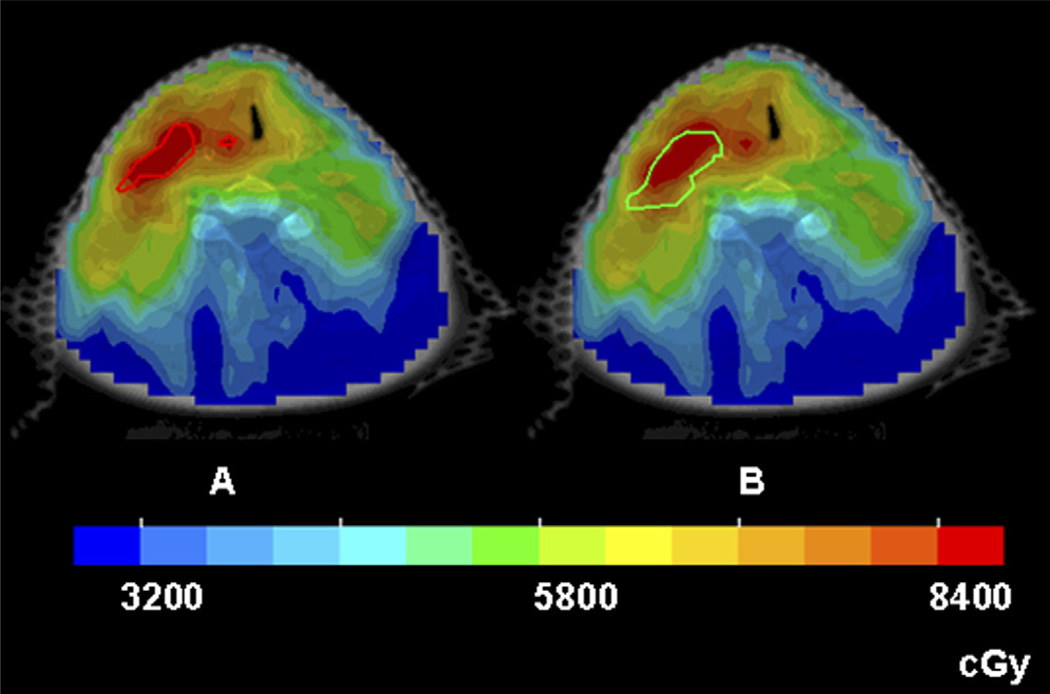
Figures 4 and 5 show color-wash dose distributions of 2 patients, superimposed on the hypoxic volumes from the two sequential FMISO scans of the respective patients. The dose distributions were derived according to GTVH1 (left panels) and were for the same 2 patients in Figs. 2 and 3, with similar and dissimilar GTVH1 and GTVH2 volumes, respectively. In Fig. 4, because they were similar, both hypoxic volumes were well-covered by the 84 Gy region. In contrast, the second hypoxic volume (right panel) in Fig. 5 was not adequately covered because it expanded relative to the first hypoxic volume.
Fig. 4.
Intensity-modulated radiotherapy dose distributions in color-wash display of Patient 2, for whom the sequential hypoxia images were similar. (a) The entire VH1 (the red contour) received the intended dose of 84 Gy. (b) When the same treatment plan was applied to VH2 (the green contour), the coverage is still reasonable.
Fig. 5.
Intensity-modulated radiotherapy dose distributions in color-wash display of Patient 7, for whom the sequential hypoxia images were dissimilar. (a) Both sub-volumes of VH1 (the red contours) received 84 Gy. (b) When the same treatment plan was applied to VH2 (the green contour), part of the hypoxic volume did not receive the intended boost dose.
Intersection of the hypoxic volume and the clinical GTV was as small as 50% of the hypoxic volume (comparing volumes of GTVH2 and VH2 for Patient 1, Scan 2 in Table 1). In Patient 4, GTVH1 and GTVH2 were similar in most transaxial slices in which they both occurred; however, there was a separate region of hypoxia present in Scan 2 that was not detected in Scan 1. In Patients 5 and 7, the hypoxia images had more than one sub-volume. (Other patients had small hypoxic regions on one or two slices, which were separated from the major hypoxic volumes. These regions were included in data analysis but not counted as “separate” regions in Table 1. A separate region for the purposes of Table 1 was defined as a geometrically isolated region consisting of multiple contiguous slices.)
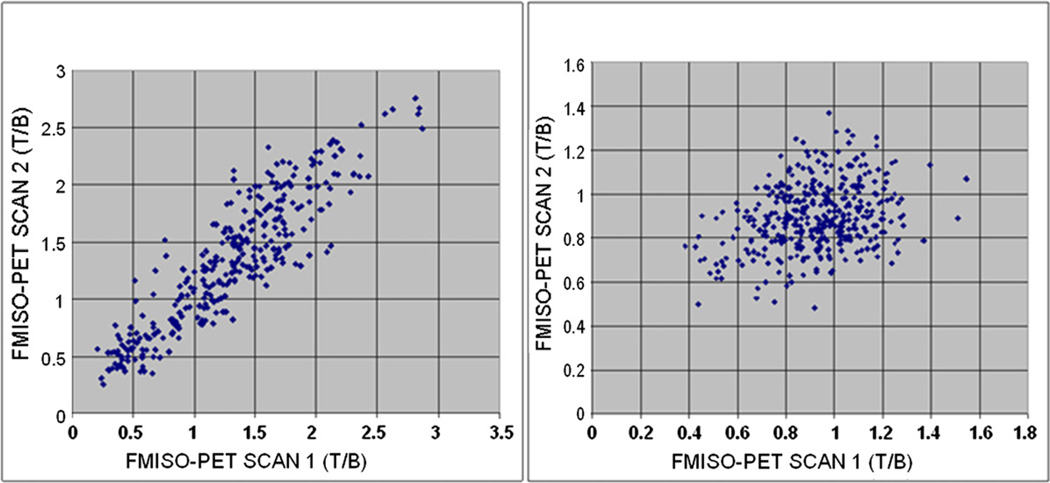
Figure 6 is a scattergram showing a voxel-by-voxel comparison between the two sequential FMISO scans. The left panel is for a patient with similar hypoxic volumes in the two FMISO scans and the right panel for a patient with dissimilar hypoxic volumes. The correlation coefficient is 0.905 for the left panel and 0.266 for the right panel.
Fig. 6.
Scatterplots showing voxel-by-voxel comparison between the two serial FMISO images of 2 patients. The correlation coefficient is 0.905 for the left panel and 0.266 for the right panel.
Dosimetric data from the dose-painting treatment plans for the hypoxic target volumes derived from the two FMISO scans are summarized in Table 2. The Dmax, Dmin, Dmean, D95, and EUD are listed for both GTVH1 and GTVH2.
Table 2.
Dose-painting dosimetric parameters of the hypoxic volumes
| Patient no. (site of tumor) |
FMISO scan | Dmax (cGy) | Dmin (cGy) | Dmean (cGy) | D95 (cGy) | EUD (cGy) |
|---|---|---|---|---|---|---|
| 1. BOT | 1 | 9205 | 7819 | 8858 | 8489 | 8773 |
| 2 | 9201 | 6945 | 8033 | 7130 | 7460 | |
| 2. Tonsil | 1 | 9717 | 7620 | 9068 | 8309 | 8709 |
| 2 | 9717 | 7083 | 9049 | 7974 | 8233 | |
| 3. BOT | 1 | 9258 | 7807 | 8899 | 8475 | 8789 |
| 2 | 9258 | 7241 | 8794 | 8034 | 8438 | |
| 4. BOT | 1 | 9202 | 7562 | 8776 | 8416 | 8682 |
| 2 | 9184 | 7242 | 8198 | 7366 | 7728 | |
| 5. Larynx | 1* | 9005 | 7695 | 8606 | 8293 | 8542 |
| 2* | 8901 | 6640 | 8438 | 7816 | 8149 | |
| 6. Tonsil | 1 | 9329 | 7616 | 8906 | 8439 | 8723 |
| 2 | 9313 | 7658 | 8845 | 8192 | 8601 | |
| 7. Larynx | 1† | 9322 | 7571 | 8816 | 8367 | 8663 |
| 2† | 9291 | 6406 | 8167 | 7054 | 7371 | |
| Average 1 | 9291 | 7670 | 8847 | 8398 | 8697 | |
| Average 2 | 9267 | 7031 | 8503 | 7652 | 7997 |
Abbreviations: FMISO = fluorine-18-labeled fluoro-misonidazole; EUD = equivalent uniform dose; BOT = base of tongue.
Three hypoxic regions.
Two hypoxic regions.
As mentioned above, the treatment plans were designed such that GTVH1 received a dose of 84 Gy without compromising normal tissue tolerance. Thus, D95 of GTVH1 was approximately 84 Gy in all cases. However, there is a decrease in coverage, based on Dmin, Dmean, D95, and EUD, for GTVH2 in all 7 patients. Whereas the maximum dose (Dmax) of GTVH1 and GTVH2 was similar, the minimum dose was different, with an average difference of 639 cGy. Obviously this is because part of the GTVH2 was outside of the high-dose region designed based on GTVH1. The difference in Dmean for GTVH1 and GTVH2 ranged from 19 to 825 cGy, with an average difference of 344 cGy.
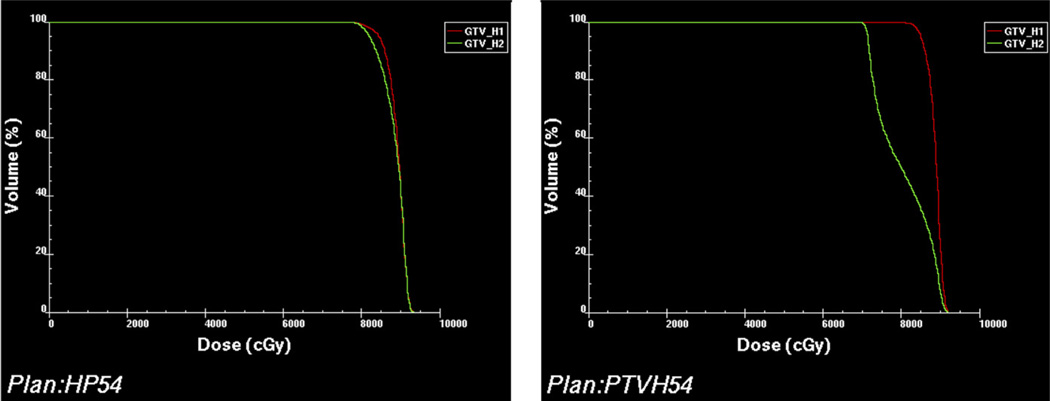
The D95 of GTVH1 ranged from 83 to 85 Gy and averaged 84 Gy. The D95 of GTVH2 varied from 71 to 82 Gy and averaged 77 Gy. The difference between D95 of GTVH1 and GTVH2 ranged from 247 (Patient 6) to 1359 cGy (Patient 1). Figure 7 shows the respective dose–volume histograms (DVHs) of these 2 patients. The degree of loss of coverage varied among the patients (e.g., the decrease in D95 was approximately 3% for Patient 6 and approximately 16.0% for Patients 1 and 7). Accordingly, the EUD of GTVH2 dropped by a range of 121 to 1313 cGy when compared with GTVH1. The range of EUD decrease is similar, ranging from 1.4% in Patient 6 to 15% in Patients 1 and 7.
Fig. 7.
Comparison of the dose–volume histograms (DVHs) of VH1 (red) and VH2 (green) in Patient 6 (left) and Patient 1 (right). In Patient 6 the two DVHs are similar. In Patient 1, however, the DVH of VH2 is significantly worse than that of VH1.
The three lowest values of D95 for GTVH2 are for Patients 1 (71 Gy), 4 (74 Gy), and 7 (71 Gy). Referring to Table 1, it can be seen that these 3 patients have the smallest Vol(GTVH1∩GTVH2)/Vol(GTVH2), the fractional overlap between GTVH1 and GTVH2 (29%, 35%, and 36%, respectively). The lower limit of D95 for Scan 2 should be 70 Gy, and it is borne out by the data because the portion of the hypoxic volume receiving the boost was defined as being enclosed by the physician-drawn GTV, which was receiving 70 Gy.
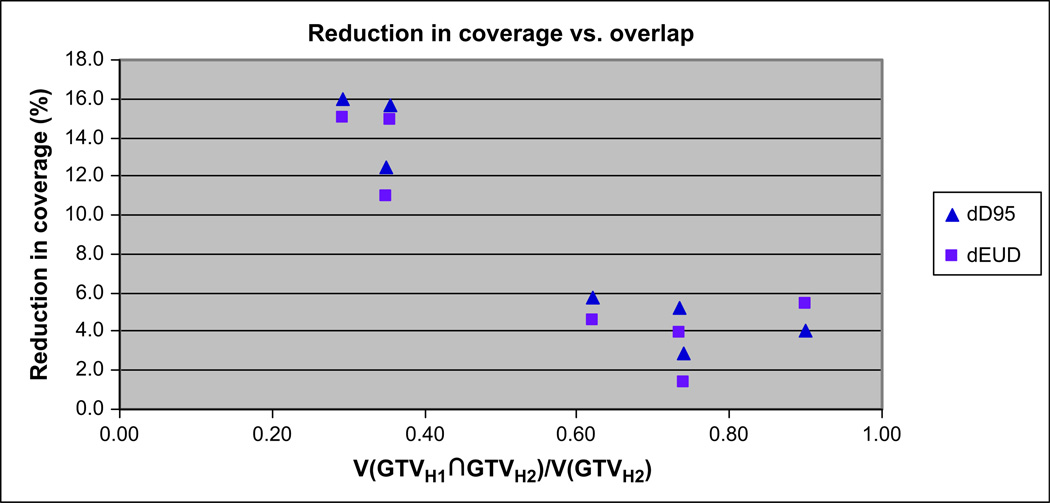
Figure 8 depicts the change in coverage between GTVH1 and GTVH2, shown as ΔD95 and ΔEUD plotted against V(GTVH1∩GTVH2)/V(GTVH2). It is clearly shown that as the overlap between the two FMISO scans increases, the loss of coverage decreases. A strong correlation is seen for both ΔD95 (R2 = 0.89) and ΔEUD95 (R2 = 0.76). In our initial analysis, Patient 2 (right-most point on Fig. 8) was observed to have a significant loss of coverage, much more than would have been expected on the basis of a visual comparison of GTVH1 and GTVH2. Upon further investigation, it was determined that the head rotation was slightly different for the two FMISO scans, causing an error in image registration. Subsequently, image registration was performed that corrected for the rotational error and produced the results as shown in Fig. 8. This illustrates the importance of careful image registration in data processing and analysis.
Fig. 8.
Reduction of coverage of VH2 relative to that of VH1, expressed as ΔD95 and ΔEUD, and plotted against V(GTVH1∩GTVH2)/V(GTVH2).
DISCUSSION
A number of investigators have studied the potential use of hypoxia image-guided dose painting as an approach to circumvent hypoxia-induced radioresistance (19, 20, 29). Most of these were treatment-planning studies based on pre-treatment PET images taken in a single imaging session; we performed a similar study and showed that boosting the hypoxic region to 84 Gy is possible in patients with head-and-neck cancers (24). To investigate the time invariance of hypoxia images, our group has acquired serial FMISO PET images for a group of patients with head-and-neck cancer. As reported in a previous article, changes were observed in the images (24, 25). This was a follow-up study to evaluate the effect of such changes on dose-painting treatment planning (i.e., to assess whether the dose-painting treatment plan derived using the boost volume GTVH1 can be efficaciously applied to GTVH2). (We note that changes in tumor hypoxia resulting from radiotherapy have been previously reported but are beyond the scope of this study.)
Of the 7 patients included in this study (Table 1), similar VH was observed in both scans for 3 patients (Patients 2, 3, and 5), but very different VH was observed for the other 4 patients. (The small number of patients in the study precluded consideration of the significance of the observed frequencies and the underlying reasons. The study of Nehmeh et al. [25] included a larger data set, as discussed below.) For patients with similar VH, the (VH1∩VH2)/VH1 and (VH1∩VH2)/VH2 were similar and high (>0.6), indicating a high degree of colocalization of the regions of uptake in the two scans. For patients with different VH, the (VH1∩VH2)/VH1 and (VH1∩VH2)/VH2 were very different, being high for the scan with the lower VH (e.g., (VH1∩VH2)/VH1 would be high if VH1 were lower than VH2).
The above is consistent with the findings of Lee et al. (24) and Nehmeh et al. (25), who analyzed the data of 13 patients (of which the patient data of this study is a subset) and reported that sequential FMISO scans were well correlated for only a fraction of the patients. A number of reasons were offered for the lack of correlation between the two scans in some of the patients (24, 25). Among them were uncertainties due to statistical noise, the difference in the time after injection when imaging began, variation in anatomic position between the two scans, and error in geometric registration of the two image data sets. The use of a single tumor/blood ratio to define tumor hypoxia, in the presence of these uncertainties, is likely to contribute in part to the observed differences in VH between the two scans. Because small changes in the threshold value could lead to a significant change in VH value, and because the uncertainties from the aforementioned factors may be different for the two scans, we believe some of the observed differences between VH1 and VH2 are introduced by experimental errors, which could be reduced by improved methods.
However, the extent of the experimental uncertainties cannot fully explain the differences between the two data sets observed in some patients. Another factor that could lead to “real” difference in images of tumor hypoxia is the contribution of acute hypoxia, relative to that of chronic hypoxia. Chronic hypoxia, as originally identified by Thomlinson and Gray (7), is presumably caused by the consumption and depletion of oxygen by tumor cells located between the vasculatures and the hypoxic region. Acute hypoxia is known to exist in animal models, but data from human tumors are scanty (30, 31). Transient or acute hypoxia could be due either to a temporary shutdown of vessels or to fluctuation in red-cell flux. If acute hypoxia exists and is significant relative to chronic hypoxia, then their differential contribution and spatial variation in the two FMISO scans will lead to “real” differences in the two sets of images. In fact, we believe that the variation between the sequential hypoxia images observed in our investigations (the present study and that of Lee et al. [24] and Nemeh et al. [25]) can be viewed as findings that support the existence of acute hypoxia.
The goal of this study was to ascertain the efficacy of applying the dose-painting treatment plan derived from the FMISO scan to the situation of the second FMISO scan (i.e., does the 84-Gy boost dose designed using the first scan adequately cover the hypoxic regions of the second scan?). The parameters used in this evaluation include DVH, Dmin, Dmean, D95, and EUD for both GTVH1 and GTVH2 (Table 2). As expected, there is some deterioration in the coverage of GTVH2 relative to that of GTVH1. For example, the average EUD was 87 Gy for GTVH1 and 80 Gy for GTVH2 (Table 2). The decrease in EUD was larger if GTVH2 is significantly larger than GTVH1. Specifically, the average EUD decrease was approximately 12 Gy for Patients 1, 4, and 7 (whose GTVH2 increased significantly relative to GTVH1) and 4 Gy for Patients 2, 3, and 5 (each of whom had similar GTVH2 and GTVH1). In Patient 6, the hypoxic volumes were small and decreased from 2.5 to 1.3 cm3, and the EUD remained almost the same. In this cohort of patients, we did not observe a decrease in VH in the two FMISO scans. Extrapolating from the above observation, if there were a decrease in VH, the coverage should remain adequate, provided that the two VH were geometrically colocalized.
Using a Monte Carlo method, Popple et al. (29) studied the effect of dose-boosting hypoxic volumes on tumor control probability (TCP). They separated the tumor into three compartments: well-oxygenated, acutely hypoxic, or chronically hypoxic. Reoxygenation of chronic hypoxia, and variation in time and location of acute hypoxia, were incorporated in the calculations. They reported that a modest dose increase of 20–50% could increase TCP if a significant portion of chronic hypoxia were targeted. However, the presence of acute hypoxia the location of which changes with time would compromise the efficacy of the boost dose.
Taken in the context of the study by Popple et al. (29), the average EUD of 87 Gy to GTVH1, and of 80 Gy to GTVH2, represent an increase of approximately 24% and approximately 14% relative to an EUD of 70 Gy without the boost dose. Thus, if both GTVH1 and GTVH2 represent chronic hypoxia, the potential increase in TCP could be significant for some patients. Another parameter in the Popple study that affected the calculated results was the hypoxic fraction. The average hypoxic fraction observed in this study (VH/GTV in Table 1) was 20% (range, 3.0–48%). Assuming all the VH consist of chronic hypoxia, different boost doses would be required to achieve a certain increase in TCP.
In summary, we have evaluated the effect of changes in tumor hypoxia distribution on the efficacy of IMRT dose painting as a method to circumvent hypoxia-induced radioresistance. Our analysis showed that even when changes did occur, dose painting can still meaningfully increase the EUD to the hypoxic volume, although the increase was less than that in the absence of changes. As to the possibility of combining hypoxic volumes from serial scans, the importance of transient hypoxia vis-à-vis chronic hypoxia must be recognized.
Acknowledgement
Supported in part by PO1 CA115675 from the National Cancer Institute/National Institutes of Health.
The authors thank Mr. Kelvin Chan and Dr. Kelin Wang for their assistance.
Footnotes
Conflict of interest: none.
REFERENCES
- 1.Brizel DM, Albers ME, Fisher SR, et al. Hyperfractionated irradiation with or without concurrent chemotherapy for locally advanced head and neck cancer. N Engl J Med. 1998;338:1798–1804. doi: 10.1056/NEJM199806183382503. [DOI] [PubMed] [Google Scholar]
- 2.Budach V, Stuschke M, Budach W, et al. Hyperfractionated accelerated chemoradiation with concurrent fluorouracil-mitomycin is more effective than dose-escalated hyperfractionated accelerated radiation therapy alone in locally advanced head and neck cancer: Final results of the radiotherapy cooperative clinical trials group of the German Cancer Society 95-06 Prospective Randomized Trial. J Clin Oncol. 2005;23:1125–1135. doi: 10.1200/JCO.2005.07.010. [DOI] [PubMed] [Google Scholar]
- 3.Chao KSC, Deasy JO, Markman J, et al. A prospective study of salivary function sparing in patients with head-and-neck cancers receiving intensity-modulated or three-dimensional radiation therapy: Initial results. Int J Radiat Oncol Biol Phys. 2001;49:907–916. doi: 10.1016/s0360-3016(00)01441-3. [DOI] [PubMed] [Google Scholar]
- 4.Lee N, Xia P, Quivey JM, et al. Intensity-modulated radiotherapy in the treatment of nasopharyngeal carcinoma: An update of the UCSF experience. Int J Radiat Oncol Biol Phys. 2002;53:12–22. doi: 10.1016/s0360-3016(02)02724-4. [DOI] [PubMed] [Google Scholar]
- 5.Lee N, Xia P, Fischbein NJ, et al. Intensity-modulated radiation therapy for head-and-neck cancer: The UCSF experience focusing on target volume delineation. Int J Radiat Oncol Biol Phys. 2003;57:49–60. doi: 10.1016/s0360-3016(03)00405-x. [DOI] [PubMed] [Google Scholar]
- 6.Chao KSC, Ozyigit G, Tran BN, et al. Patterns of failure in patients receiving definitive and postoperative IMRT for head-and-neck cancer. Int J Radiat Oncol Biol Phys. 2003;55:312–321. doi: 10.1016/s0360-3016(02)03940-8. [DOI] [PubMed] [Google Scholar]
- 7.Thomlinson R, Gray L. The histological structure of some human lung cancers and the possible implications for radiotherapy. Br J Cancer. 1955;9:539–549. doi: 10.1038/bjc.1955.55. [DOI] [PMC free article] [PubMed] [Google Scholar]
- 8.Hockel M, Knoop C, Schlenger K, et al. Intratumoral pO2 histography as predictive assay in advanced cancer of the uterine cervix. Adv Exp Med Biol. 1994;345:445–450. doi: 10.1007/978-1-4615-2468-7_59. [DOI] [PubMed] [Google Scholar]
- 9.Hockel M, Schlenger K, Aral B, et al. Association between tumor hypoxia and malignant progression in advanced cancer of the uterine cervix. Cancer Res. 1996;56:4509–4515. [PubMed] [Google Scholar]
- 10.Brizel DM, Sibley GS, Prosnitz LR, et al. Tumor hypoxia adversely affects the prognosis of carcinoma of the head and neck. Int J Radiat Oncol Biol Phys. 1997;38:285–289. doi: 10.1016/s0360-3016(97)00101-6. [DOI] [PubMed] [Google Scholar]
- 11.Nordsmark M, Overgaard M, Overgaard J. Pretreatment oxygenation predicts radiation response in advanced squamous cell carcinoma of the head and neck. Radiother Oncol. 1996;41:31–39. doi: 10.1016/s0167-8140(96)91811-3. [DOI] [PubMed] [Google Scholar]
- 12.Graeber TG, Osmanian C, Jacks T, et al. Hypoxia-mediated selection of cells with diminished apoptotic potential in solid tumours [see comments] Nature. 1996;379:88–91. doi: 10.1038/379088a0. [DOI] [PubMed] [Google Scholar]
- 13.Brizel DM, Scully SP, Harrelson JM, et al. Tumor oxygenation predicts for the likelihood of distant metastases in human soft tissue sarcoma. Cancer Res. 1996;56:941–943. [PubMed] [Google Scholar]
- 14.Rofstad EK. Microenvironment-induced cancer metastasis. Int J Radiat Biol. 2000;76:589–605. doi: 10.1080/095530000138259. [DOI] [PubMed] [Google Scholar]
- 15.De Jaeger K, Kavanagh MC, Hill RP. Relationship of hypoxia to metastatic ability in rodent tumours. Br J Cancer. 2001;84:1280–1285. doi: 10.1054/bjoc.2001.1743. [DOI] [PMC free article] [PubMed] [Google Scholar]
- 16.Brown JM. Exploiting tumour hypoxia and overcoming mutant p53 with tirapazamine. Br J Cancer. 1998;77(Suppl. 4):12–14. doi: 10.1038/bjc.1998.430. [DOI] [PMC free article] [PubMed] [Google Scholar]
- 17.Rischin D, Peters L, Fisher R, et al. Tirapazamine, cisplatin, and radiation versus fluorouracil, cisplatin, and radiation in patients with locally advanced head and neck cancer: A randomized phase II trial of the Trans-Tasman Radiation Oncology Group (TROG 98.02) J Clin Oncol. 2005;23:79–87. doi: 10.1200/JCO.2005.01.072. [DOI] [PubMed] [Google Scholar]
- 18.Kaanders JHAM, Pop LAM, Marres HAM, et al. ARCON: Experience in 215 patients with advanced head-and-neck cancer. Int J Radiat Oncol Biol Phys. 2002;52:769–778. doi: 10.1016/s0360-3016(01)02678-5. [DOI] [PubMed] [Google Scholar]
- 19.Ling CC, Humm J, Larson S, et al. Towards multidimensional radiotherapy (MD-CRT): Biological imaging and biological conformality. Int J Radiat Oncol Biol Phys. 2000;47:551–560. doi: 10.1016/s0360-3016(00)00467-3. [DOI] [PubMed] [Google Scholar]
- 20.Chao KS, Bosch WR, Mutic S, et al. A novel approach to overcome hypoxic tumor resistance: Cu-ATSM-guided intensity-modulated radiation therapy. Int J Radiat Oncol Biol Phys. 2001;49:1171–1182. doi: 10.1016/s0360-3016(00)01433-4. [DOI] [PubMed] [Google Scholar]
- 21.Gronroos T, Eskola O, Lehtio K, et al. Pharmacokinetics of [18F]FETNIM: A potential marker for PET. J Nucl Med. 2001;42:1397–1404. [PubMed] [Google Scholar]
- 22.Dolbier WR, Jr, Li AR, Koch CJ, et al. [18F]-EF5, a marker for PET detection of hypoxia: Synthesis of precursor and a new fluorination procedure. Appl Radiat Isot. 2001;54:73–80. doi: 10.1016/s0969-8043(00)00102-0. [DOI] [PubMed] [Google Scholar]
- 23.Dehdashti F, Mintun M, Lewis J, et al. In vivo assessment of tumor hypoxia in lung cancer with 60Cu-ATSM. Eur J Nucl Med Mol Imaging. 2003;30:844–850. doi: 10.1007/s00259-003-1130-4. [DOI] [PubMed] [Google Scholar]
- 24.Lee NY, Mechalakos JG, Nehmeh S, et al. Fluorine-18-labeled fluoromisonidazole positron emission and computed tomography-guided intensity-modulated radiotherapy for head and neck cancer: A feasibility study. Int J Radiat Oncol Biol Phys. 2008;70:2–13. doi: 10.1016/j.ijrobp.2007.06.039. [DOI] [PMC free article] [PubMed] [Google Scholar]
- 25.Nehmeh SA, Schoder H, Lee NY, et al. Reproducibility of the intra-tumoral distribution of 18F-flouromisonidazole (18F-MISO) in head and neck cancer. Int J Radiat Oncol Biol Phys. 2008;70:235–242. doi: 10.1016/j.ijrobp.2007.08.036. [DOI] [PMC free article] [PubMed] [Google Scholar]
- 26.Rasey JS, Koh WJ, Evans ML, et al. Quantifying regional hypoxia in human tumors with positron emission tomography of [18F]fluoromisonidazole: A pretherapy study of 37 patients. Int J Radiat Oncol Biol Phys. 1996;36:417–428. doi: 10.1016/s0360-3016(96)00325-2. [DOI] [PubMed] [Google Scholar]
- 27.Rajendran JG, Schwartz DL, O’Sullivan J, et al. Tumor hypoxia imaging with [F-18] fluoromisonidazole positron emission tomography in head and neck cancer. Clin Cancer Res. 2006;12:5435–5441. doi: 10.1158/1078-0432.CCR-05-1773. [DOI] [PMC free article] [PubMed] [Google Scholar]
- 28.Niemierko A. Reporting and analyzing dose distributions: A concept of equivalent uniform dose. Med Phys. 1997;24:103–110. doi: 10.1118/1.598063. [DOI] [PubMed] [Google Scholar]
- 29.Popple RA, Ove R, Shen S. Tumor control probability for selective boosting of hypoxic subvolumes, including the effect of reoxygenation. Int J Radiat Oncol Biol Phys. 2002;54:921–927. doi: 10.1016/s0360-3016(02)03007-9. [DOI] [PubMed] [Google Scholar]
- 30.Chaplin DJ, Olive PL, Durand RE. Intermittent blood flow in a murine tumor: Radiobiological effects. Cancer Res. 1987;47:597–601. [PubMed] [Google Scholar]
- 31.Dewhirst MW, Braun RD, Lanzen JL. Temporal changes in pO2 of R3230Ac tumors in fischer-344 rats. Int J Radiat Oncol Biol Phys. 1998;42:723–726. doi: 10.1016/s0360-3016(98)00304-6. [DOI] [PubMed] [Google Scholar]


