

Abstract
This study examined whether time of day and repeated exposure to intermittent hypoxia have an impact on the hypoxic ventilatory response (HVR) and ventilatory long-term facilitation (vLTF). Thirteen participants with sleep apnea were exposed to twelve 4-min episodes of isocapnic hypoxia followed by a 30-min recovery period each day for 10 days. On days 1 (initial day) and 10 (final day) participants completed the protocol in the evening (PM); on the remaining days the protocol was completed in the morning (AM). The HVR was increased in the morning compared with evening on the initial (AM 0.83 ± 0.08 vs. PM 0.64 ± 0.11 l·min−1·%SaO2−1; P ≤ 0.01) and final days (AM 1.0 ± 0.08 vs. PM 0.81 ± 0.09 l·min−1·%SaO2−1; P ≤ 0.01, where %SaO2 refers to percent arterial oxygen saturation). Moreover, the magnitude of the HVR was enhanced following daily exposure to intermittent hypoxia in the morning (initial day 0.83 ± 0.08 vs. final day 1.0 ± 0.08 l·min−1·%SaO2−1; P ≤ 0.03) and evening (initial day 0.64 ± 0.11 vs. final day 0.81 ± 0.09 l·min−1·%SaO2−1; P ≤ 0.03). vLTF was reduced in the morning compared with the evening on the initial (AM 19.03 ± 0.35 vs. PM 22.30 ± 0.49 l/min; P ≤ 0.001) and final (AM 20.54 ± 0.32 vs. PM 23.11 ± 0.54 l/min; P ≤ 0.01) days. Following daily exposure to intermittent hypoxia, vLTF was enhanced in the morning (initial day 19.03 ± 0.35 vs. final day 20.54 ± 0.32 l/min; P ≤ 0.01). We conclude that the HVR is increased while vLTF is decreased in the morning compared with the evening in individuals with sleep apnea and that the magnitudes of these phenomena are enhanced following daily exposure to intermittent hypoxia.
Keywords: acute intermittent hypoxia, chronic intermittent hypoxia, diurnal rhythms
the hypoxic ventilatory response (HVR) is characterized by an abrupt increase in minute ventilation during exposure to hypoxia for a short duration (e.g., 5 min) (33, 44). Exposure to several short episodes of hypoxia (i.e., acute intermittent hypoxia) augments the HVR (12, 16, 56, 63) and this amplified response is sustained long after removal of the stimulus (12, 32). Likewise, long-term facilitation of ventilation (vLTF), which is characterized by a sustained increased in minute ventilation above baseline values, is evident both during and following exposure to acute intermittent hypoxia (30, 33). These phenomena have been observed in a wide variety of species (30, 33) including healthy humans (16, 24) and humans suffering from sleep apnea (24). Although exposure to a single episode of hypoxia and intermittent episodes of hypoxia is important for initiating the HVR and vLTF, respectively, the magnitude of these phenomena is dependent on a number of factors, such as age and sex (30, 33). Diurnal rhythms could also influence the magnitude of these phenomena. This suggestion is supported by the work of Seifert and Mortola (52) who reported that the HVR is greater in the light compared with the dark phase in adult rats, even after taking into consideration differences in activity levels between phases. Likewise, a number of investigators have reported that the HVR (46, 59) and the hypercapnic ventilatory response (HCVR) (5, 46, 57) differed in the evening compared with the morning in healthy humans.
The potential impact of intermittent hypoxia and diurnal rhythms on the HVR and vLTF is intriguing to us because it gives rise to the possibility that humans with sleep apnea may experience evening-to-morning variations in these phenomena because of exposure to nocturnal intermittent hypoxia, a hallmark of the disorder, and/or diurnal rhythms. However, only two studies to date have addressed whether diurnal variations in the HVR exist in individuals with sleep apnea (13, 28). The findings were equivocal with one study (13) reporting a decrease in the HVR in the morning compared with the evening and the other study (28) reporting that daily variations did not exist, although the vast majority of the participants displayed an increase in the HVR in the morning compared with the evening in the latter investigation (28). Moreover, no studies to our knowledge have explored if the magnitude of vLTF displays a diurnal rhythmicity in humans, healthy or otherwise. Despite the paucity of published data it is possible that vLTF may follow a diurnal pattern because serotonin, which is required for the initiation of vLTF (36), peaks in the evening and reaches a nadir in the morning hours throughout the day in rats (1, 34, 60).
Evening-to-morning variations in HVR and vLTF might be important because of the potential link between these phenomena and breathing stability or lack thereof in humans. More specifically, an increase in the HVR has been linked to breathing instability in individuals residing at high altitude (6) and in individuals suffering from sleep apnea (6). In contrast, it has been hypothesized that initiation of vLTF might promote breathing stability (29), although this hypothesis has not been tested adequately. Therefore, the first aim of the present investigation was to determine whether the HVR and vLTF differ in the evening compared with the morning in individuals with sleep apnea. Based on clinical findings (3, 9, 54), which have indicated that breathing instability is augmented from the beginning to the end of the night, we hypothesized that the HVR would be greater and vLTF would be less in the morning compared with the evening.
Repeated daily exposure to intermittent hypoxia enhances the magnitude of the hypoxic response (25, 37, 41, 48) and LTF of ventilation or phrenic nerve activity in nonhuman animals (25, 37, 48). Given this finding, it is possible that repeated daily exposure to intermittent hypoxia might enhance the HVR and vLTF in humans. Although a few studies have examined the impact of 1–2 wk of daily exposure to intermittent hypoxia on the HVR in healthy humans (10, 15, 23, 26, 53), no studies have directly addressed the impact of daily intermittent hypoxia on the HVR and vLTF in humans with sleep apnea. Although it has been implied previously that repeated exposure to intermittent hypoxia enhances the HVR in individuals with sleep apnea, results from studies comparing the HVR in individuals with sleep apnea compared with healthy humans have been equivocal, with studies reporting that the HVR is higher (38), not significantly higher (45), or lower (40, 61) compared with control. Likewise, a causal link between repeated exposure to intermittent hypoxia and the magnitude of vLTF has not been firmly established in healthy humans or humans with sleep apnea. However, the potential impact of chronic intermittent hypoxia (CIH) on vLTF is supported indirectly by our recently published findings, which showed that the magnitude of vLTF following a one-time exposure to intermittent hypoxia is greater in individuals with sleep apnea (24). In that study, the enhanced vLTF that we measured may have been due to repeated daily exposure to nocturnal intermittent hypoxia normally experienced by individuals with sleep apnea. Thus the second aim of the present study was to determine whether exposure to intermittent hypoxia each day over a 10-day period enhances the magnitude of the HVR and vLTF in humans with sleep apnea. We hypothesized that the magnitude of the HVR and vLTF would be enhanced following repeated daily exposure to intermittent hypoxia and that this enhancement would be independent of time of day.
METHODS
Protocol
The Human Investigation Committees of Wayne State University School of Medicine and John D. Dingell Veterans Affairs Medical Center approved the experimental protocol. Twenty-one participants visited our laboratory on 12 occasions. During the first visit to the laboratory written informed consent was obtained and thereafter a physical examination, health, and lifestyle questionnaires, blood pressure measurements, and a 12-lead EKG were completed. After ensuring that all inclusion criteria were met, participants were exposed to two 4-min episodes of hypoxia to ensure familiarization with the experimental protocol and apparatus. During the second visit to the laboratory, participants completed a nocturnal polysomnogram to confirm the presence of obstructive sleep apnea (OSA). On verification of the presence of sleep apnea, participants were enrolled into the protocol. Thirteen of the 21 participants were exposed to intermittent hypoxia during visits 3–12 to the laboratory. From here on, these visits will be referred to as days 1–10 of the protocol. The remaining eight participants were exposed to a sham protocol that was identical to the actual protocol with the exception that participants were not exposed to intermittent hypoxia. The participants that completed the sham protocol were matched to participants that were exposed to intermittent hypoxia on the basis of age, race, body mass index, and apnea/hypopnea index. In addition to the 21 participants that completed the protocol, 4 additional participants (2 participants enrolled in the intermittent hypoxia protocol and 2 participants enrolled in the sham protocol) did not complete the protocol as required because of unforeseen time constraints. Consequently, the data from these participants were not included in the analysis.
The intermittent hypoxia and sham protocol were conducted during wakefulness on all visits. Participants assumed a supine position throughout the study, and the required monitoring equipment was attached (see Instrumentation for details). At the beginning of both the intermittent hypoxia and sham protocols, participants breathed room air for 10 min to establish baseline values of minute ventilation, end-tidal partial pressure of oxygen (PetO2), and end-tidal partial pressure of carbon dioxide (PetCO2). From this point forward this initial baseline period will be referred to as baseline 1 (B1). Thereafter, PetCO2 was raised 3 mmHg above B1 values and the variables outlined above were recorded for an additional 15 min. From this point forward this period will be referred to as baseline 2 (B2). The PetCO2 was sustained at B2 levels throughout the remainder of both the intermittent hypoxia and sham protocols. Following B2, participants that completed the intermittent hypoxia protocol were exposed to twelve 4-min episodes of hypoxia, wherein PetO2 was maintained at 50 mmHg. Each hypoxic episode was terminated with a single breath of 100% O2 to rapidly bring the PetO2 to the normoxic range. Each episode, with the exception of the 12th episode, was followed by a 4-min recovery period during which time participants breathed room air. The final recovery period following the 12th hypoxic episode lasted for 30 min. Participants that completed the sham protocol inspired compressed air in place of the hypoxic gas mixture during twelve 4-min episodes. At the end of each sham episode participants were exposed to a single breath of 100% oxygen followed by 4 min of breathing room air with the exception of the last episode, which was followed by a 30-min recovery period.
On days 1 and 10 of the intermittent hypoxia or sham protocol, participants came to the laboratory during evening hours (i.e., 6–7 PM). Conversely, on days 2–9 participants arrived at the laboratory at 7–8 AM in the morning. Before each visit participants were instructed to avoid food and caffeinated beverages 4–6 h before the study. All studies were completed in a quiet environment to eliminate the impact of environmental noise (e.g., talking, phone calls) on measures of ventilation.
Instrumentation
Nocturnal polysomnography.
During completion of the sleep study, the sleep monitoring montage included an electroencephalogram (C3/A2, C4/A1 O1/A2, O2/A1), electrooculogram, submental electromyogram, and an electrocardiogram. Abdominal and chest wall movements were monitored using a piezoelectric band, and esophageal pressure was measured using a pressure transducer (model MPC-500, Millar Instruments, Houston, TX). Airflow, breathing frequency, and inspiratory/expiratory volume were recorded via a pneumotachograph (model RSS-100HR, Hans Rudolph, Kansas City, MO) that was attached to a face mask. Measures of end-tidal oxygen (model 17515, Vacumed, Ventura, CA) and end-tidal carbon dioxide (model 17518, Vacumed) were obtained from air expired into sampling tubes that were attached to ports on the face mask. Oxygen saturation was measured via pulse oximetry (model 3900P, Datex-Ohmeda, Boulder, CO). During sleep all physiological variables were analog to digitally converted at a sampling frequency of 100 Hz/channel and input into a microcomputer using a commercially available software package (Gamma Version 4.0, Astro-Med, West Warwick, RI).
Intermittent hypoxia and sham protocol.
During the intermittent hypoxia protocol, subjects breathed through a face mask. End-tidal oxygen (model no. 17518; Vacumed) and carbon dioxide (model no. 17515, Vacumed) were sampled from two separate mask ports. The face mask was connected to a pneumotachograph (model RSS100-HR, Hans Rudolph), which monitored breath-by-breath changes in minute ventilation. The pneumotachograph was attached to a two-way valve. The inspiratory port of the valve was connected to a five-way stopcock. Participants inspired either room air or the contents from one of two bags attached to the stopcock that contained either 8% oxygen/balance nitrogen, or 100% oxygen. Additionally, the output from a flowmeter was attached to the inspiratory port of the valve. Gas from two cylinders containing 100% oxygen and 100% carbon dioxide were connected to the flowmeter. Thus supplemental oxygen and carbon dioxide could be added to the 8% oxygen/balance nitrogen that was inspired during a given 4-min hypoxic episode to maintain desired levels of PetO2 (50 mmHg) and PetCO2 (3 mmHg above baseline), respectively. Participants breathed from the bag containing 8% oxygen/balance nitrogen during each 4-min hypoxic episode, while hypoxia was abruptly terminated with a single breath from the bag containing 100% oxygen. An ECG was continuously monitored and oxygen saturation was measured with a pulse oximeter (Biox 3700; Ohmeda). A 16-bit analog-to-digital converter (AT-MIO-16XE-50; National Instruments, Austin, TX) digitized the analog signals for online computer analysis using software specifically designed for this purpose. The software calculated minute ventilation, PetO2, and PetCO2 on a breath-by-breath basis.
Data Analysis
Nocturnal polysomnography.
Sleep was staged in 30-s epochs according to standard criteria (47). Total sleep period time, as well as the percentage of total sleep time spent in a given sleep stage, was calculated. The total number of obstructive, mixed, and central apneas, as well as the total number of hypopneas, was determined. In addition, the lowest and the average oxygen saturation and esophageal pressure recorded during apneas were ascertained, as was the average duration of the events. An apnea was defined as the absence of inspiratory airflow for a minimum of 10 s. A hypopnea was defined by a 50% reduction in airflow accompanied by a 3% decrease in oxygen saturation. The apnea/hypopnea indexes were defined as the total number of events per hour of sleep.
Intermittent hypoxia protocol.
For the initial (days 1–3) and final three visits (days 8–10) of the protocol the following measures were obtained. Average values of minute ventilation, PetCO2, PetO2, and SaO2, henceforth referred to as the physiological variables, were determined for the last 5 min of B1. Average values for the measured physiological variables were also obtained for the last 5 min of B2 and for the last 2 min of the twelve hypoxic episodes that followed. To quantify the HVR on each day, the increase in minute ventilation from B2 to the last 2 min of the initial hypoxic episode (H1) was divided by the change in oxygen saturation from B2 to the last 2 min of the episode.
In addition to the average values calculated for the baseline periods and hypoxic episodes, average values were also calculated for the last 2 min of each recovery period except the end-recovery period. For presentation purposes the 30-min end-recovery period was divided into six 5-min segments and the physiological variables were averaged for each of these segments. For the purposes of statistical analysis a single average for the 30-min recovery period was obtained, since no obvious differences in each of the measured variables were evident between segments. For the initial and final three visits of the protocol minute ventilation recorded during the recovery periods was expressed in both absolute values and as a fraction of baseline. Data from days 2 and 3 were averaged as were the data from days 8 and 9 (i.e., data collected in the morning). These days were averaged to strengthen the contention that differences observed between the initial and final days of the protocol were not simply due to variability in the data.
We also calculated a single average value using the data recorded during the baseline periods, each hypoxic episode, and each recovery period on the initial (days 1–3) and final days (days 8–10) of the protocol. This latter analysis was completed to compare the results to the data obtained from the sham protocol.
Sham protocol.
The sham protocol was completed primarily to compare the magnitude of minute ventilation during the recovery periods to measures obtained during the intermittent hypoxia protocol. This comparison was made to ensure that vLTF was a consequence of exposure to intermittent hypoxia and not other potentially confounding variables. The data collected during the sham protocol were analyzed at identical time points to that outlined for the intermittent hypoxia protocol. For the initial and final three visits of the protocol minute ventilation recorded during the recovery periods was expressed in both absolute values and as a fraction of baseline. The average values determined for B2, the sham episodes, and recovery periods on each of the initial and final days of the protocol were averaged subsequently, since no differences in the magnitude of minute ventilation existed between trials completed before and after 10 days of exposure to compressed air in the morning or evening. Consequently, a single representative value for the baseline periods, each sham episode, and each recovery period for the initial and final days of the protocol was determined.
Statistical Analysis
An unpaired t-test was used to determine whether age, height, weight, body mass index, apnea index, blood pressure, and scores derived from the Epworth and Stanford sleepiness scales were different between the groups. A two-way ANOVA with repeated measures in conjunction with Student-Newman-Keuls post hoc test was used to compare 1) minute ventilation, PetCO2, and PetO2 during B1 in the morning and evening (i.e., time of day) on the initial and final days (i.e., length of exposure) of the intermittent hypoxia or sham protocol; 2) the HVR and vLTF, expressed as a fraction of baseline, in the morning and evening on the initial and final days of the intermittent hypoxia protocol; 3) and minute ventilation (expressed either in absolute terms or as a fraction of baseline), PetCO2, and PetO2 during B2 and the recovery periods of the sham and intermittent hypoxia protocols. The two factors in the design were protocol (sham vs. intermittent hypoxia) and period (B2 vs. recovery).
A three-way ANOVA with repeated measures in conjunction with Student-Newman-Keuls post hoc test was used to compare minute ventilation, PetCO2, and PetO2 measured during B2 and H1 in the morning and evening, on the initial and final days of the intermittent hypoxia protocol. The three factors in the design were period (B2 vs. hypoxia), time of day (AM vs. PM), and length of exposure (initial vs. final day of protocol). A similar analysis was used to determine whether minute ventilation, tidal volume, breathing frequency, PetCO2, and PetO2 measured during B2 and end recovery were different in the morning and evening on the initial and final days of the intermittent hypoxia protocol. The three factors in the design were period (B2 vs. end recovery), time of day (AM vs. PM), and length of exposure (initial vs. final day of protocol).
A Pearson product-moment correlation was used to correlate minute ventilation measured during B2 with the magnitude of vLTF and HVR measured during the morning and evening studies on the initial and final days of the protocol. Consequently, four data points per participant were plotted for a total n = 52 (13 participants × 4 = 52). All results are presented as means ± standard error of the mean (SE). A value of P ≤ 0.05 was considered significant.
RESULTS
Anthropometric Measures
The participants in our study were newly diagnosed with sleep apnea and as a result were not treated previously for the disorder. They were relatively young and had a body mass index indicating the absence of morbid obesity (Table 1). Systolic and diastolic blood pressure measures were within normal limits. Completion of the Epworth sleepiness scale indicated a history of mild sleepiness, although scores from the Stanford sleepiness scale indicated otherwise on the day of the screening visit (Table 1). The apnea/hypopnea index and average oxygen level during breathing events were characteristic of mild to moderate OSA. The anthropometric and sleep measures obtained from the participants that completed the intermittent hypoxia and sham protocols were similar (Table 1).
Table 1.
Anthropometric and sleep measures
| OSA (Actual; n = 13) | OSA (Sham; n = 8) | |
|---|---|---|
| Age, yr | 27.1 ± 1.7 | 28.5 ± 2.5 |
| Height, cm | 181.9 ± 2.2 | 176.0 ± 2.6 |
| Weight, kg | 88.5 ± 3.2 | 80.2 ± 3.9 |
| Body mass index, kg/m2 | 26.2 ± 0.7 | 25.8 ± 1.0 |
| Systolic pressure, mmHg | 119.0 ± 2.4 | 122.5 ± 1.0 |
| Diastolic pressure, mmHg | 72.6 ± 2.2 | 77.4 ± 2.4 |
| Epworth sleepiness scale | 11.2 ± 0.9 | 10.3 ± 2.0 |
| Stanford sleepiness scale | 2.8 ± 0.3 | 2.3 ± 0.5 |
| AHI, events/h | 28.7 ± 3.9 | 33.2 ± 5.5 |
| SaO2 during apnea | 92.3 ± 0.7 | 93.1 ± 0.3 |
| SaO2 > 90%, %TST | 98.0 ± 0.01 | 98.0 ± 0.01 |
| Race | 8 African-American; 4 Caucasian; 1 Hispanic | 7 African-American; 1 Caucasian |
Values are means ± SE. OSA, obstructive sleep apnea; SaO2, arterial oxygen saturation; AHI, apnea/hypopnea index; TST, total sleep time.
Intermittent Hypoxia Protocol: Baseline 1
Figure 1 shows that minute ventilation during B1 of the intermittent hypoxia protocol was significantly greater in the evening compared with the morning studies [Fig. 1, PM vs. AM (§), P ≤ 0.001]. Likewise, minute ventilation during B1 on the final days of the intermittent hypoxia protocol tended to be greater compared with the initial days (P ≤ 0.08), although this difference did not reach statistical significance (Fig. 1). The PetCO2 was similar during the evening and morning studies, and during the studies completed on the final compared with the initial days (Fig. 1). Likewise, the PetO2 was similar during the evening and morning studies; however, the PetO2 on the final days was greater compared with the initial days of the intermittent hypoxia protocol [Fig. 1, final AM vs. initial AM (*), and final PM vs. initial PM (*): P ≤ 0.02].
Fig. 1.
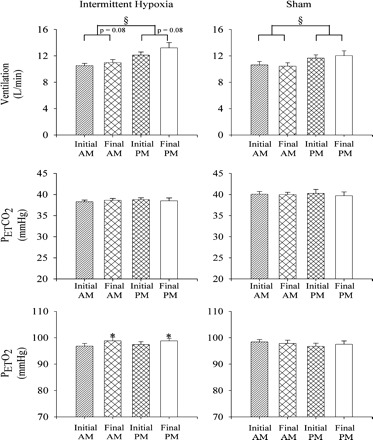
Measures of minute ventilation during baseline 1 on the initial and final days of the intermittent hypoxia (left) and sham protocol (right). Average values for minute ventilation, partial pressure of end-tidal carbon dioxide (PetCO2), and partial pressure of end-tidal oxygen (PetO2) recorded from the last 5 min of baseline 1 on the initial (i.e., days 1–3) and final days (i.e., days 8–10) of the intermittent hypoxia and sham protocol during the morning (AM) and evening studies (PM). Note that baseline minute ventilation values were greater in the evening compared with the morning during the intermittent hypoxia and sham protocols. Moreover, minute ventilation during baseline on the final days of the intermittent hypoxia protocol tended to be greater (P = 0.08) than values measured during the initial days of the protocol both in the morning and evening. Likewise, note that the increase in minute ventilation was accompanied by a significant increase in PetO2 on the final days compared with the initial days of the protocol. *Significantly different from initial days of the intermittent hypoxia protocol. §Significantly different from AM trials.
Intermittent Hypoxia Protocol: Baseline 2
Morning (AM) vs. evening (PM).
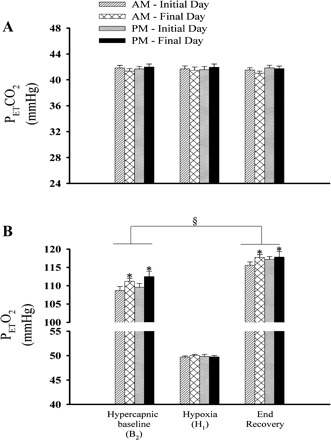
Figure 2 shows a raw record obtained from one participant that completed the intermittent hypoxia on days 2 (initial morning study) and 9 (final morning study), and a raw record from one participant that completed the sham protocol on the same days. Histograms of the average values recorded during B2 for studies completed on the initial and final days of the study in the morning and evening are shown in Fig. 3. These values are also displayed in Fig. 7, along with average values calculated for the remaining hypoxic episodes and recovery periods (see Intermittent Hypoxia Protocol: Ventilatory Long-term Facilitation). Minute ventilation during B2 was significantly greater in the evening compared with the morning [Fig. 3, baseline, AM vs. PM (§): P ≤ 0.002]. This increase was evident on both the initial and final days of the intermittent hypoxia protocol. Although differences in minute ventilation were evident, measures of PetCO2 and PetO2 during B2 were similar in the evening and morning (Fig. 4).
Fig. 2.
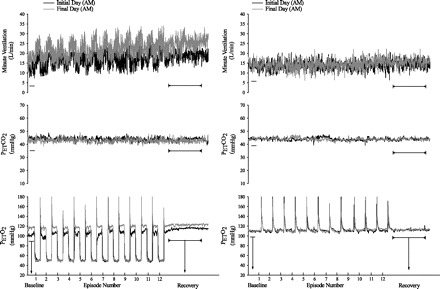
Measures of minute ventilation during completion of the intermittent hypoxia or sham protocol on the initial and final day. A raw record of breath-by-breath minute ventilation recorded from one participant exposed to intermittent hypoxia (left panels) and from one participant exposed to compressed air (sham; right panels) on the initial and final days of the protocol. Note that minute ventilation during baseline (i.e., B2) and end recovery were greater on the final compared with the initial day of the intermittent hypoxia protocol, while measures of minute ventilation were similar on the initial and final days of the sham protocol.
Fig. 3.
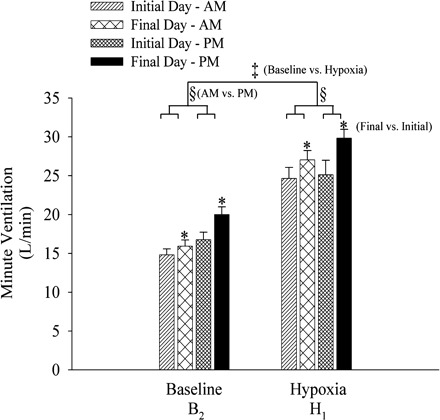
Measures of minute ventilation during baseline (B2) and the first hypoxic episode (H1) on the initial and final days of the intermittent hypoxia protocol. Average values for minute ventilation recorded during the last 5 min of baseline 2 and during the last 2 min of the first hypoxic episode of the intermittent hypoxia protocol presented on the initial and final days in the morning and evening. Note that minute ventilation under baseline conditions and during exposure to hypoxia was greater in the evening compared with the morning. Similarly, minute ventilation was greater on the final days compared with the initial days of the protocol. ‡Significantly different from baseline of the intermittent hypoxia protocol. §Significantly different from AM trials. *Significantly different from initial days.
Fig. 7.
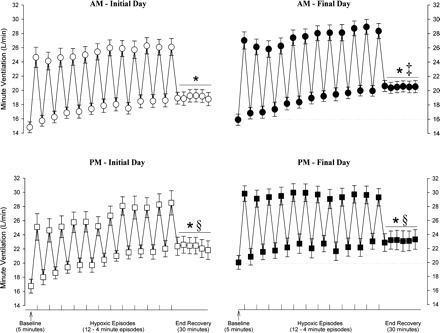
Average values of minute ventilation recorded before, during, and following exposure to intermittent hypoxia on the initial and final days of the protocol. Average values for minute ventilation recorded from the last 5 min of baseline, the last 2 min of each episode of hypoxia (indicated by vertical tick mark on x-axis), the last 2 min of each normoxic period that separated the hypoxic episodes, and the 30-min poststimuli recovery period which is divided into six 5-min segments. The data were collected during and following administration of the intermittent hypoxia protocol on the initial days of the protocol in the morning (days 2 and 3: ○) and evening (day 1: □) and on the final days of the protocol in the morning (days 8 and 9: ●) and in the evening (day 10: ■). Notice that minute ventilation during each trial was significantly greater during end recovery compared with baseline. In addition, note that minute ventilation during end recovery was greater in the evening compared with the morning on the initial and final days of the protocol. Also note that minute ventilation was greater on the final days compared with the initial days of the protocol during the morning studies. *Significantly different from baseline. ‡Significantly different from AM initial day. §Significantly different from AM initial day and AM final day.
Fig. 4.
Measures of the partial pressure of end-tidal carbon dioxide and oxygen during baseline (B2), the first hypoxic episode (H1), and end recovery on the initial and final days of the intermittent hypoxia protocol. Average values for the partial pressure of end-tidal carbon dioxide (PetCO2; A) and partial pressure of end-tidal oxygen (PetO2; B) recorded from the last 5 min of baseline 2, the last 2 min of each hypoxic episode (a cumulative average for all episodes is shown), and from the 30-min end-recovery period. Note that PetCO2 was similar on each day of the protocol during baseline, hypoxia, and end recovery following exposure to intermittent hypoxia. In contrast, note that PetO2 was significantly greater on the final compared with the initial days of the protocol during both baseline and end recovery. Moreover, note that PetO2 during end recovery was greater compared with baseline for the trials completed in the morning and evening on the initials and final days of the protocol. *Significantly different from initial days of the intermittent hypoxia protocol. §Significantly different from baseline.
Initial vs. final days of intermittent hypoxia.
Minute ventilation during B2 was significantly greater on the final compared with the initial days of the protocol (Figs. 2 and 3). This increase was evident during both the morning and evening trials [see Fig. 3, baseline, final vs. initial (*), P ≤ 0.01]. The increase in minute ventilation observed during B2 on the final days was accompanied by an increase in PetO2. This increase was evident during both the morning and evening trials (Fig. 4, final AM vs. initial AM, and final PM vs. initial PM, baseline: P ≤ 0.03). In contrast, measures of PetCO2 were similar during B2 on the initial and final days of the protocol (Fig. 4).
To summarize, the results indicate that minute ventilation during B2 was greater in the evening compared with the morning and was greater on the final days compared with the initial days of the protocol.
Intermittent Hypoxia Protocol: Initial Hypoxic Episode
Morning (AM) vs. evening (PM).
Values for H1 are also shown in Figs. 2, 3, and 7. Minute ventilation during H1 was significantly greater than measures recorded during B2 during the morning and evening trials on the initial and final days of the protocol, as expected [Fig. 3, baseline vs. hypoxia (‡), P ≤ 0.0001]. Moreover, minute ventilation during H1 was greater in the evening compared with the morning [Fig. 3, hypoxia, AM vs. PM (§), P ≤ 0.002], although the difference was most evident when the evening and morning trials on the final days of the protocol were compared. The observed differences during H1 existed even though PetCO2 and PetO2 during the evening and morning trials were similar (Fig. 4).
Initial vs. final days of intermittent hypoxia.
Minute ventilation during H1 was significantly greater on the final compared with the initial days of the protocol (Figs. 2 and 3). This increase was evident during both the morning and evening trials [see Fig. 3, hypoxia, final vs. initial (*), P ≤ 0.01]. In contrast, PetCO2 and PetO2 were similar during H1 on the initial and final days of the protocol (Fig. 4).
To summarize, the results indicate that minute ventilation during H1 tended to be greater in the evening compared with the morning and was greater on the final days compared with the initial days of the protocol. However, the magnitude of minute ventilation values during H1 could be influenced by baseline values preceding this episode and oxygen saturation levels achieved during H1. To account for the impact of these variables we calculated the hypoxic ventilatory response.
Intermittent Hypoxia Protocol: HVR
The HVR was significantly greater in the morning compared with the evening during both the initial and final days of the protocol [Fig. 5, initial and final AM vs. initial and final PM (§), P ≤ 0.01]. Moreover, the HVR was significantly greater during the final day of the protocol compared with the initial day during both the morning and evening trials [Fig. 5, final AM vs. initial AM, and final PM vs. initial PM (*), P ≤ 0.03]. The HVR recorded in the morning and evening on the initial and final days of the protocol was not correlated to the baseline level of minute ventilation (i.e., B2) during each study (Fig. 6A, r = −0.1, P ≥ 0.47). To summarize, the HVR was greater on the final compared with the initial days of the protocol and during the morning compared with the evening trials.
Fig. 5.
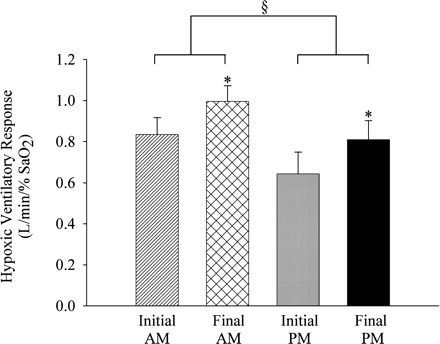
Measures of the hypoxic ventilatory response on the initial and final days of the intermittent hypoxia protocol. Average values for the hypoxic ventilatory response determined from the first episode of the intermittent hypoxia protocol administered on the initial and final days of the protocol in the morning and evening. Note that the hypoxic ventilatory response was greater on the final compared with the initial days of the protocol in the morning and evening. Moreover, note that the hypoxic ventilatory response measured in the evening trials was less compared with the morning trials on the initial and final days of the protocol. *Significantly different from initial days of the intermittent hypoxia protocol. §Significantly different from AM trials. %SaO2, percent arterial oxygen saturation.
Fig. 6.
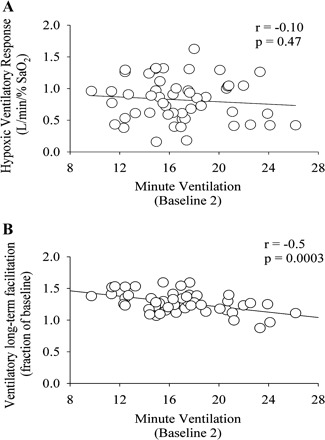
Correlations between baseline (B2) measures of minute ventilation and the hypoxic ventilatory response (A) and ventilatory long-term facilitation (B). Correlations between minute ventilation values measured during B2 and the hypoxic ventilatory response and the magnitude of ventilatory long-term facilitation expressed as a fraction of baseline. Note that the magnitude of the hypoxic ventilatory response was not correlated to the level of minute ventilation measured during baseline 2. Conversely, the magnitude of ventilatory long-term facilitation was correlated to baseline 2 values of minute ventilation.
Intermittent Hypoxia Protocol: Ventilatory Long-Term Facilitation
Baseline vs. end recovery.
During the initial days of the protocol minute ventilation following exposure to intermittent hypoxia was significantly greater compared with B2 during the morning [Figs. 2 and Fig. 7, AM initial day, end recovery vs. baseline (*), P ≤ 0.001] and evening studies [Fig. 7, PM initial day, end recovery vs. baseline (*), P ≤ 0.001]. A similar relationship existed on the final days of the protocol during the morning [Figs. 2 and 7, AM final day, end recovery vs. baseline (*), P ≤ 0.001] and evening studies [Fig. 7, PM final day, end recovery vs. baseline (*), P ≤ 0.03]. The increases in minute ventilation during end recovery were the consequence of an enhanced tidal volume and breathing frequency (Table 2). Moreover, the increases in minute ventilation observed during end recovery were accompanied by increases in PetO2 relative to measures obtained during B2 [Fig. 4, end recovery vs. baseline (§), P ≤ 0.001]. In contrast, measures of PetCO2 during end recovery and B2 were similar (Fig. 4, end recovery vs. baseline, P ≤ 0.47).
Table 2.
Tidal volume and breathing frequency measures during baseline 2 and end recovery in the morning and evening studies on the initial and final days of the protocol
| Initial AM | Final AM | Initial PM | Final PM | |
|---|---|---|---|---|
| Tidal volume, ml | ||||
| B2 | 1,045.5 ± 71.3 | 1,091.5 ± 79.0 | 1,107.9 ± 102.3§ | 1,266.1 ± 103.8§* |
| End recovery | 1,251.9 ± 94.3‡ | 1,305.3 ± 97.0‡ | 1,321.9 ± 114.4‡§ | 1,343.9 ± 107.8‡§ |
| Breathing frequency, breaths/min | ||||
| B2 | 14.9 ± 0.8 | 15.2 ± 0.9 | 16.4 ± 1.2§ | 16.9 ± 1.1§ |
| End recovery | 16.1 ± 0.9‡ | 16.5 ± 1.1‡ | 18.3 ± 1.3‡§ | 18.3 ± 1.2‡§ |
Values are means ± SE. B2, baseline 2. Tidal volume:
greater than baseline, P ≤ 0.0001;
greater than AM, P ≤ 0.05;
greater than initial days of the protocol, P ≤ 0.05. Breathing frequency:
greater than baseline, P ≤ 0.002;
greater than AM, P ≤ 0.0005.
Morning (AM) vs. evening (PM).
In addition to the differences in minute ventilation observed during B2 of the morning and evening studies, which were outlined above (see Fig. 3 and Intermittent Hypoxia Protocol: Baseline 2), minute ventilation following exposure to intermittent hypoxia was significantly greater in the evening compared with the morning [see Fig. 7: PM initial day (end recovery) vs. AM initial day (end recovery) (§), P ≤ 0.001; and PM final day (end recovery) vs. AM final day (end recovery) (§), P ≤ 0.01]. The increases in minute ventilation observed during the evening were the consequence of an enhanced tidal volume and breathing frequency (Table 2). The differences in end-recovery measures observed between the morning and evening were not due to the intensity of exposure to intermittent hypoxia, which was similar in the morning and evening studies (see Fig. 4, hypoxia, AM vs. PM, P = 0.22). Likewise, differences in end-recovery measures were not due to differences in measures of carbon dioxide, which were similar in the morning and evening studies (see Fig. 4, end recovery, AM vs. PM, P = 0.29).
Initial vs. final days of intermittent hypoxia.
In addition to the differences in minute ventilation observed during B2 of the studies completed on the initial and final days of the protocol (see Fig. 3 and Intermittent Hypoxia Protocol: Baseline 2), minute ventilation during end recovery was significantly greater on the final compared with the initial days of the protocol during the morning studies [see Figs. 2 and 7, AM final day (end recovery) vs. AM initial day (end recovery) (‡), P ≤ 0.01]. In the majority of participants (n = 9) this increase was a consequence of an enhanced tidal volume; however, in some participants the increase was a consequence of increases in breathing frequency (Table 2). In contrast, minute ventilation during end recovery was similar during the evening studies completed on the final day vs. the initial day [see Fig. 7, PM final day (end recovery) vs. PM initial day (end recovery), P = 0.38]. The increases in minute ventilation observed during end recovery on the final days compared with the initial days of the protocol were accompanied by increases in PetO2 (see Fig. 4, final AM vs. initial AM, and final PM vs. initial PM: end recovery, P ≤ 0.03). Conversely, measures of PetCO2 during end recovery and B2 were similar for all the completed comparisons (see Fig. 4, final AM vs. initial AM, and final PM vs. initial PM, baseline and end recovery, P = 0.31).
The magnitude of vLTF standardized as a fraction of baseline did not reflect the absolute data since the vLTF magnitude was less in the evening compared with the morning on the final days of the protocol (1.16 ± 0.04 vs. 1.30 ± 0.03 fraction of baseline, P ≤ 0.01). Likewise, the magnitude was less than the values measured during the initial days of the protocol (final PM vs. initial PM, 1.16 ± 0.04 vs. 1.34 0.05, P ≤ 0.002; final PM vs. initial AM, 1.16 ± 0.04 vs. 1.30 ± 0.04, P ≤ 0.001). The reduction in the vLTF magnitude after it was expressed as a fraction of baseline was likely a consequence of the augmented baseline minute ventilation, since the decrease in the magnitude of vLTF was inversely correlated to B2 values (Fig. 6B; r = −0.5; P ≤ 0.0003).
To summarize, absolute values of minute ventilation following exposure to intermittent hypoxia (i.e., end recovery) were significantly greater than B2 on each day of the protocol. In addition, minute ventilation during B2 and end recovery was greater in the evening compared with the morning studies. Moreover, minute ventilation was greater during B2 on the final days of the protocol compared with the initial days independent of the time of day. Last, minute ventilation during end recovery was greater on the final days of the protocol compared with the initial days.
Intermittent Hypoxia Protocol vs. Sham Protocol
Minute ventilation, PetCO2, and PetO2 values recorded during B1 of the sham protocol are shown in Fig. 1, right. Minute ventilation during B1 of the evening studies was greater compared with the morning studies on the initial and final days of the protocol (P ≤ 0.01). The PetCO2 and PetO2 on the initial and final days of the sham protocol were similar during the morning and evening studies (Fig. 1). A composite average of the four trials completed in the morning and evening on the initial and final days of the sham (n = 8) and intermittent hypoxia (n = 13) protocols is shown in Fig. 8 (for details regarding the rationale for this composite see Data Analysis, Sham protocol). Minute ventilation during B2 was significantly greater during the intermittent hypoxia compared with the sham protocol (Fig. 8). This increase reflects the increase in minute ventilation that was evident during baseline on the final days compared with the initial days of the intermittent hypoxia protocol (see Fig. 8). Likewise, minute ventilation during the end-recovery period was greater in the participants exposed to intermittent hypoxia compared with compressed air when both absolute (Fig. 8, P ≤ 0.01) and standardized values (1.26 ± 0.03 vs. 1.18 ± 0.03, P ≤ 0.01) were compared. The increase in minute ventilation during end recovery of the intermittent hypoxia protocol was accompanied by increases in PetO2 that were greater than the values measured during end recovery of the sham protocol (117.0 ± 0.8 vs. 114.5 ± 0.6 mmHg; P ≤ 0.01). In contrast, PetCO2 values were similar throughout the intermittent hypoxia and sham protocols (intermittent hypoxia vs. sham: baseline 41.7 ± 0.4 vs. 42.5 ± 0.6; end recovery 41.4 ± 0.3 vs. 42.3 ± 0.6; P ≥ 0.20). Minute ventilation during the end-recovery period of the sham protocol was also greater relative to baseline measures (P ≤ 0.01), although the magnitude was much less compared with the intermittent hypoxia protocol. Moreover, the profile of the increase in minute ventilation was dissimilar to that observed during the intermittent hypoxia protocol, which was progressive in nature.
Fig. 8.
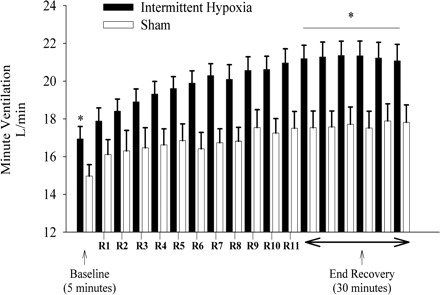
Average values of minute ventilation during baseline (B2) and each of the recovery periods during the intermittent hypoxia and sham protocols. A composite average of minute ventilation values recorded during the last 5 min of baseline 2, the last 2 min of each recovery period, and the end-recovery period of each intermittent hypoxia (solid bars) or sham protocol (open bars) completed in the morning and evening on the initial and final days of the study. Note that baseline levels of minute ventilation were greater during the intermittent hypoxia compared with the sham protocol. Also note that the minute ventilation during end recovery was greater during the intermittent hypoxia compared with the sham protocol. *Significantly different from sham protocol.
DISCUSSION
We showed that the HVR was greater in the morning compared with the evening in individuals with sleep apnea. Moreover, the response was augmented by repeated daily exposure to intermittent hypoxia independent of the time of day. We also showed that the magnitude of vLTF was greater in the evening compared with the morning and that the magnitude was enhanced by repeated daily exposure to hypoxia.
Methodological Considerations
Early on, investigators recognized that carbon dioxide levels may have a confounding influence on the expression of LTF in animals. Consequently, carbon dioxide levels were often elevated above the apneic threshold during and after intermittent hypoxia to promote the expression of LTF (2, 11, 17, 31). The possible impact of carbon dioxide levels on the expression of vLTF was confirmed by a study completed in rats during wakefulness, which showed that LTF is not fully expressed if accompanied by hypocapnia, likely because ventilation is constrained by reducing carbon dioxide chemoreceptor feedback (39). The association between carbon dioxide and the expression of vLTF was subsequently established in awake humans, since vLTF was not evident when normocapnia was sustained during and following intermittent hypoxia (20, 32, 35), but was evident when carbon dioxide levels were sustained above baseline levels (16, 24, 64). Unlike sleep, ventilation during wakefulness can be sustained by arousal and/or behavioral stimuli when carbon dioxide levels are below the central and peripheral chemoreflex thresholds (7, 55). Thus maintenance of ventilation during wakefulness is not a strong indicator that concomitant carbon dioxide levels are sufficiently above the thresholds to eliminate constraint from the chemoreflexes. On the basis of this possibility, we increased carbon dioxide levels 3 mmHg above resting values during and following exposure to intermittent hypoxia in the present study. The rationale for selecting this level of carbon dioxide was based on the results from previous studies (16, 32, 64). However, whether vLTF manifests itself when levels of carbon dioxide are 1–2 mmHg above resting values remains to be determined. In maintaining carbon dioxide 3 mmHg above resting values we recognize that our paradigm does not accurately reflect carbon dioxide fluctuations that are typically experienced by an individual with sleep apnea. However, it is also important to recognize that our findings might have implications for treatment of sleep disorder breathing since vLTF, which might contribute to breathing stability, may only exert its effects in the presence of elevated levels of carbon dioxide.
We also recognize that the number and duration of each episode used in our protocol do not replicate the pattern of exposure to intermittent hypoxia/hypercapnia experienced by an individual suffering from sleep apnea. The number and duration of episodes were initially selected because the total duration of the planned exposure (i.e., 48 min) was similar to that experienced by an individual with moderate sleep apnea (30 episodes/h) that experienced short periods of apnea (e.g., 15 s). However, whether the magnitude of vLTF initiated in our study is similar to the magnitude initiated with a paradigm that more accurately reflects sleep apnea (short episodes of hypoxia/hypercapnia in conjunction with an occluded airway often followed by an arousal) remains to be determined. We also selected this paradigm to demonstrate that a relatively short exposure to intermittent hypoxia may prove to have utility for inducing respiratory plasticity that is potentially beneficial for promoting breathing stability or inducing motor recovery following injury.
Hypoxic Ventilatory Response
AM vs. PM.
Diurnal variations in minute ventilation during 4 days of continuous exposure to hypoxia have been previously reported in adult rats (52), suggesting that the HVR might vary throughout the day. In addition to these findings, a few studies have examined the impact of diurnal rhythms on the HVR in healthy humans (5, 13, 28, 46, 59). Overall the findings have been equivocal with some studies reporting that the HVR was reduced in the morning compared with the evening, primarily as a consequence of a shift in the chemoreflex threshold (46, 59). The remaining published studies reported that the HVR remained unchanged from the morning to the evening (5, 13, 28). The reason for the different findings between studies has not been firmly established. However, different methods were used to measure the HVR [i.e., modified rebreathing (27, 58) vs. progressive isocapnic or poikilocapnic hypoxia (5, 13, 46)]. Moreover, the experimental design differed between studies with the majority of studies obtaining measures before and after sleep (5, 13, 27) while two studies obtained measures every 2 h over a 24-h period (46, 59). Participant populations also differed [i.e., the control population for one study comprised individuals recruited from a sleep clinic (28) while other populations were recruited from the general population] and the composition of each population varied in relation to a number of anthropometric measures (e.g., age, male/female ratio). Nevertheless, despite the stated differences between studies, the published literature collectively indicates that the HVR does not increase from the morning to the evening in healthy individuals, since it either remained the same or decreased from the evening to the morning. Two published studies have examined alterations in the HVR from the evening to the morning in individuals with sleep apnea. Fuse and colleagues (13) reported that the HVR decreased from the morning to the evening, while Mahamed and colleagues (28) did not observe a diurnal variation. However, in the latter study the response to hypoxia increased from the evening to the morning in 9 of 12 participants, indicating the possibility of a type II error (28). We also found that the HVR increased from the evening to the morning in our participants. This variation was evident on both the initial and final days of the protocol.
Measurement of the HVR in the present investigation would have been optimal if baseline measures of minute ventilation were similar in the evening and morning. This similarity would have indicated the presence of an analogous central respiratory drive, the most favorable condition for measuring the HVR (8, 43). However, increases in baseline minute ventilation were unavoidable in our study because of the impact of time of day and repeated exposure to hypoxia. Thus we were concerned that the enhanced HVR observed in the morning was a function of the daily variation in baseline minute ventilation. If this were the case, a similar sensitivity to hypoxia could result in a reduced HVR in the evening compared with the morning, since the change in minute ventilation measured between baseline and the H1 would be less in the evening because of the elevation in baseline measures. However, this scenario likely does not account for the evening to morning differences observed, since the magnitude of the HVR was not correlated to baseline measures. Likewise, the HVR was elevated in the evening on the final compared with the initial day despite an increase in baseline minute ventilation (see Ventilatory long-term facilitation, Repeated daily exposure to intermittent hypoxia for additional discussion regarding this issue). Last, preliminary findings in our laboratory using a modified rebreathing method in three participants with sleep apnea showed that the HVR was greater in the morning compared with the evening even though basal levels of minute ventilation were similar. Thus we are confident that our findings reflect a diurnal variation in the HVR in individuals with sleep apnea.
Given that diurnal variations in metabolic rate have been reported in humans and other animals it is possible that the daily variation in the HVR observed was linked to a diurnal rhythm in metabolic rate. This suggestion is supported indirectly by the findings of Seifert and Mortola (52) who convincingly showed in adult rats that minute ventilation and oxygen consumption are well matched throughout the day under normoxic and sustained hypoxic conditions. However, direct evidence is not available in rats since prolonged sustained exposure to hypoxia does not allow for an assessment of whether the HVR varies with a diurnal rhythm, as initially suggested by Stephenson (58). Indeed, studies in humans suggest that diurnal variations in the HCVR and/or the HVR are independent of a diurnal rhythm in metabolic rate. Stephenson and colleagues (59) observed a daily rhythm in the HVR in the absence of a daily rhythm in metabolic rate. Likewise, Mahamed and colleagues (28) reported an increase in the HCVR and HVR (i.e., in 9 of 12 participants) even though the daily rhythm of the metabolic rate, which was measured indirectly by monitoring the rate of rise carbon dioxide during rebreathing, was reduced. Moreover, other studies that were not designed to detect diurnal variations in the HVR but did examine variability in the HVR within a given day or across days did not find a relationship between variability in the HVR and metabolic rate (51, 68). Last, Spengler and Shea (57) reported that no correlation existed between metabolic rate and the sensitivity of the HCVR, although this finding is not directly applicable because they did not measure the HVR. Collectively, the results in the literature suggest that variations in the HVR in humans are independent of alterations in metabolic rate.
The increase in the HVR that we observed could reflect alterations in peripheral chemoreflex responsiveness: either an increase in sensitivity and/or a leftward shift in the chemoreflex threshold. Although we are only able to speculate on the mechanisms at the present time, it is possible that a neuromodulator of peripheral chemoreflex responsiveness was responsible for the observed diurnal variation in the HVR. The most attractive possibility is melatonin, because it has been shown to enhance the response of the carotid bodies to hypoxia in rats (4, 62) and to vary in a diurnal fashion. If our speculation is correct than a similar diurnal variation in the HVR might be expected in both healthy humans and those suffering from sleep apnea. However, studies have reported a decline in the HVR from evening to morning in healthy individuals (46, 58) and we observed an increase in the HVR over this period in individuals with OSA. This different profile could be indicative of a disruption in the normal diurnal variation in melatonin. This suggestion is supported by the work of Hernandez and colleagues (18) who showed that melatonin peaked in the evening and declined thereafter in healthy individuals, while melatonin was found to gradually increase in individuals with OSA, so that peak levels were recorded in the morning compared with the evening (18). This finding supports our hypothesis that the increase in the HVR observed in the morning compared with the evening might be mediated by melatonin. It is also possible that enhancement of peripheral chemoreflex responsiveness was due wholly or in part to exposure to nocturnal intermittent hypoxia, since we established previously that acute exposure to intermittent hypoxia enhances the HVR in humans (22, 24, 32). However, our participants experienced a very mild form of nocturnal intermittent hypoxia (i.e., oxygen saturation only decreased by 3–4% typically) and it remains to be determined whether this degree of exposure is capable of inducing changes in the HVR that we observed.
Repeated daily exposure to intermittent hypoxia.
We also demonstrated that the HVR was enhanced following repeated daily exposure to intermittent hypoxia. Our findings are similar to previous results that showed that repeated daily exposure to intermittent hypoxia enhances the HVR or the phrenic nerve response to acute hypoxia in cats and rats (25, 37, 41, 48). There are also unequivocal data that exposure to a small or large number of hypoxic episodes of short duration, each day for 1 or 2 wk, leads to enhancement of the HVR in healthy humans (10, 15, 23, 26, 53). The results obtained from healthy humans exposed to CIH suggest that comparable findings might be observed in individuals with OSA, since exposure to CIH (i.e., weeks, months, or years) is a hallmark of this disorder. However, until now evidence for this adaptation has been equivocal. Previous investigations have reported that the HVR is increased (38), not significantly different (45), or decreased (40, 61) in individuals with OSA compared with healthy controls. Dissimilar experimental designs might have contributed in part to the divergent findings (for details, see Ref. 33). However, we have hypothesized previously that the different responses may be a reflection of the duration and intensity of exposure to intermittent hypoxia in individuals suffering from sleep apnea (33). More specifically, we proposed that the HVR might be enhanced in those individuals with mild apnea while the response was depressed in those individuals with a more severe form of apnea (33). If this is the case, enhancement of the HVR might be particularly evident in young individuals that experience mild to moderate forms of apnea. Conversely, the facilitatory impact of CIH may be least evident in individuals that are older and experience severe hypoxemia throughout a given night. The possibility that the duration and intensity of exposure to intermittent hypoxia might impact on the HVR is supported indirectly by studies that have examined the ventilatory response to hypoxia at high altitude (65, 66). These studies showed that although exposure to continuous hypoxia initially leads to enhancement of the ventilatory response eventually a reduction is observed (i.e., hypoxic desensitization). More applicably, the results of the present study support our hypothesis in that repeated daily exposure to an intermittent hypoxia protocol of short duration resulted in an enhanced HVR in a group of relatively young participants with OSA that were exposed to mild levels of nocturnal hypoxia.
Ventilatory Long-Term Facilitation
AM vs. PM.
In the present study exposure to intermittent hypoxia led to the manifestation of LTF; this is in agreement with our recent published findings (24). We believe that vLTF observed on each day of the protocol was the consequence of exposure to intermittent hypoxia, since the magnitude of minute ventilation during the recovery periods that interspersed the hypoxic episodes and during the end-recovery period was greater than the values recorded from the participants that completed the sham episodes. This finding is also in accordance with our previous results (16). It is also important to note that minute ventilation during end recovery of the sham protocol was greater than baseline measures; however, the increase was much less than that observed during the intermittent hypoxia protocol. The reason for the increase observed in the sham study remains to be determined. It may have occurred as a result of the sustained increase in carbon dioxide as previously reported by others (14, 21, 50). However, we are not convinced that this is the case, since we did not observe this increase previously (16), although it should be noted that the populations differed [i.e., OSA vs. healthy humans (16)] and the duration of the sham protocol was shorter in the previous study (16). Likewise, in other studies progressive increases in ventilation were not universally observed in all participants (14, 21), which typically led to statistically nonsignificant findings. Moreover, the profile of the increase during the sham protocol on each of the initial and final days of our protocol was dissimilar to the gradual drift that was previously observed in some participants (50). The increases in our study were not progressive in nature but rather were abrupt at the start and midway through the protocol as evident in the raw record and the average data presented (see Figs. 2 and 8). Moreover, as discussed below (see Ventilatory Long-Term Facilitation, Repeated daily exposure to intermittent hypoxia), if exposure to sustained carbon dioxide was responsible for the small increase observed on a given day, one might anticipate that repeated exposure to sustained carbon dioxide might lead to the enhancement of minute ventilation on the final compared with the initial days, which was not the case.
We also found that the magnitude of vLTF was greater in the evening compared with the morning on both the initial and final days of the protocol, when absolute values of minute ventilation were compared. To our knowledge this finding has not been previously reported in humans. It might be argued that this latter finding is incorrect because the magnitude of vLTF was reduced during the evening compared with the morning, particularly on the final days of the protocol, when minute ventilation during end recovery was standardized as a fraction of baseline measures. The reduction in standardized measures was principally a consequence of an increase in baseline activity that was evident in the evening compared with the morning (see Fig. 7). This suggestion is supported by the correlation analysis, which revealed a significant inverse correlation between baseline measures of minute ventilation and standardized measures of vLTF. Our interpretation of the finding is that the reduced standardized value does not represent a reduction in the magnitude of vLTF. Instead, we suggest that the reduction in the standardized value reflects a greater impact of the LTF mechanism on baseline activity coupled with a gradual saturation of the mechanism responsible for the increase in minute ventilation during end recovery, which was enhanced the most on the final day of the protocol.
The mechanisms responsible for the diurnal variation in vLTF remain to be determined. However, one intriguing possibility is that evening to morning alterations in levels of serotonin are responsible for our observations. Serotonin is a neuromodulator required for the initiation of vLTF in rats (36). Moreover, variations in serotonergic levels have been observed between wakefulness and sleep, with levels being higher during the former state (19). More importantly, the synthesis and release of serotonin (1, 34, 60) via adrenergic signaling in rats (60) have been reported under constant lighting conditions, with peak levels occurring later in the day and decreased synthesis and release in the early morning.
Exposure to a single night of nocturnal intermittent hypoxia in our untreated participants could have influenced the magnitude of vLTF in the morning compared with the evening. Studies in a variety of species have shown that prior exposure to intermittent hypoxia enhances the magnitude of LTF to subsequent exposures (25, 37, 41) (for discussion on this point see Ventilatory Long-Term Facilitation, Repeated daily exposure to intermittent hypoxia). However, these findings likely do not explain the evening to morning differences observed, since a reduction rather than an increase in the magnitude of vLTF was evident. It is possible that repeated exposure to nocturnal intermittent hypoxia might depress the magnitude of vLTF following an acute one-time exposure. However, there is no evidence in the literature to suggest that the mild nocturnal hypoxemia experienced by our relatively young participants would lead to the diurnal variations that we observed. Indeed if this were the case one would anticipate that the magnitude of vLTF would decrease from the initial to the final days of the present protocol, which was not the case as discussed immediately below.
Repeated daily exposure to intermittent hypoxia.
A number of studies in a variety of species, including rats (25, 37, 67), mice (42), and cats (49), have reported that repeated exposure to intermittent hypoxia increases the magnitude of phrenic nerve (25, 67), carotid sensory nerve (42, 48), hypoglossal (67), and ventilatory LTF (37). As demonstrated in other animals the magnitude of vLTF might be greater in humans exposed previously to intermittent hypoxia. However, there is a paucity of data in the human literature to support this contention. Foster and colleagues (10) did provide some indirect evidence by demonstrating that repeated daily exposure to six 5-minute episodes of hypoxia interspersed with 5-min normoxic recovery periods each day for 12 consecutive days in healthy humans resulted in an increase in breathing frequency on the final days of the protocol (i.e., days 8 and 10) compared with day 1, although minute ventilation and tidal volume were not. The increase in baseline breathing frequency could be an indicator of LTF. However, the greatest magnitude of the phenomenon was likely not determined given that measurements were obtained 24 h following each hypoxic exposure. More convincingly, in the present study we showed that the magnitude of vLTF increases in humans following repeated exposure to intermittent hypoxia. To our knowledge this finding has not been previously reported. The increase in magnitude manifested itself both during B1 and more convincingly during B2 and the end-recovery periods, such that the magnitude of minute ventilation during B2 and end recovery was significantly greater on the final compared with the initial days in the morning and evening. Likewise, the increase in minute ventilation observed during B1, B2, and end recovery was accompanied by increases in PetO2 on the final days compared with the initial days. Support for our suggestion that the increase in minute ventilation during B2 on the final days was a consequence of repeated exposure to hypoxia comes from our results, which showed that baseline values during the intermittent hypoxia protocol was higher compared with the baseline measures obtained during the sham protocol. Likewise, no difference in the magnitude of vLTF between the initial and final days was evident during the sham protocol, which was contrary to the increase in the magnitude of vLTF observed on the final days of the intermittent hypoxia protocol compared with the initial days. Our finding provides a reasonable explanation for our published results (24), which showed that minute ventilation following a one-time exposure to intermittent hypoxia was greater in participants with sleep apnea compared with control. Based on our present findings, it is possible that the enhanced vLTF observed previously was due in part to repeated nocturnal exposure to intermittent hypoxia. Given this possibility, the magnitude of the response observed in the present investigation could be less in healthy individuals (i.e., not exposed to nocturnal hypoxemia) undergoing a similar protocol. Moreover, although repeated nocturnal exposure to intermittent hypoxia may enhance vLTF, the present results indicate the mechanism responsible for vLTF was not saturated in our participants with mild to moderate OSA since increases in vLTF were evident from the initial to final days of our protocol.
Although our findings are similar to the results obtained in other animals the manner in which we achieved our results differ in that the repeated exposure to intermittent hypoxia was presented over a much shorter time frame (i.e., 12 episodes/day for 10 days vs. exposure to intermittent hypoxia for 8–12 h over 4–10 days) compared with studies completed in rats, cats, or mice (25, 37, 42, 48, 67). Thus exposure to intermittent hypoxia over a short time frame appears to induce respiratory plasticity in humans. This finding might have important implications once it has been firmly established that exposure to intermittent hypoxia can be used as an effective treatment for respiratory or other motor control disorders.
Conclusions
We found that the HVR was enhanced in the morning compared with the evening in human participants with sleep apnea. Moreover, we established that the magnitude of vLTF was reduced in the morning compared with the evening. Collectively our results indicate that a diurnal variation in both the HVR and vLTF exists in human participants with sleep apnea. We have put forth arguments that these evening to morning variations might in part be a function of an endogenous diurnal rhythm, although further studies are required to determine whether the variations observed are independent of exposure to nocturnal intermittent hypoxia. Likewise, we showed that repeated daily exposure to intermittent hypoxia enhances the magnitude of the HVR and vLTF during both the morning and evening hours. However, the diurnal variation in both measures was evident both before and after the repeated exposure.
Physiological Significance
Our findings may have important implications for the maintenance of breathing stability in those exposed to intermittent periods of hypoxia, including individuals traveling to high altitude, and more applicably, given the population we recruited, individuals suffering from sleep apnea. There is relatively strong evidence in the literature that enhancement of the HVR promotes breathing instability principally because the enhanced response leads to the induction of carbon dioxide levels that are below values that demarcate the apneic threshold (see Refs. 6, 33 for review). In contrast, it has been hypothesized that vLTF might serve to promote breathing stability by ensuring that breathing is sustained despite fluctuating levels of carbon dioxide (29, 33), although this latter hypothesis has not been sufficiently tested at the present time. Likewise, the existence of vLTF might serve to promote increases in oxygen levels, which might be particularly important in individuals experiencing intermittent hypoxia. Indeed, our results showed that increases in PetO2 compared with baseline were evident in the presence of vLTF.
If both hypotheses are correct, then diurnal variations in the HVR and vLTF that we observed might serve to promote breathing instability from the beginning to the end of the night particularly in individuals with sleep apnea, since the HVR increased and vLTF decreased from the evening to the morning, respectively. If this is the case, then minimizing the evening to morning variations in the HVR or vLTF that we observed might serve to promote breathing stability. Our findings, which showed that the HVR and vLTF are enhanced following repeated exposure to hypoxia, is physiologically significant as well, since enhancement of these mechanisms might increase their impact on breathing (in)stability. If so, the question remains as to how the HVR and vLTF interact to influence breathing stability, since one seemingly promotes breathing instability (i.e., HVR) while the other may promote stability (vLTF).
GRANTS
This work was supported by the National Heart, Lung, and Blood Institute (R01-HL-085537) and a Veterans Affairs Merit Award.
DISCLOSURES
No conflicts of interest, financial or otherwise, are declared by the author(s).
REFERENCES
- 1. Agren H, Koulu M, Saavedra JM, Potter WZ, Linnoila M. Circadian covariation of norepinephrine and serotonin in the locus coeruleus and dorsal raphe nucleus in the rat. Brain Res 397: 353–358, 1986 [DOI] [PubMed] [Google Scholar]
- 2. Bach KB, Mitchell GS. Hypoxia-induced long-term facilitation of respiratory activity is serotonin dependent. Respir Physiol 104: 251–260, 1996 [DOI] [PubMed] [Google Scholar]
- 3. Charbonneau M, Marin JM, Olha A, Kimoff RJ, Levy RD, Cosio MG. Changes in obstructive sleep apnea characteristics through the night. Chest 106: 1695–1701, 1994 [DOI] [PubMed] [Google Scholar]
- 4. Chen Y, Tjong YW, Ip SF, Tipoe GL, Fung ML. Melatonin enhances the hypoxic response of rat carotid body chemoreceptor. J Pineal Res 38: 157–163, 2005 [DOI] [PubMed] [Google Scholar]
- 5. Cummings KJ, Swart M, Ainslie PN. Morning attenuation in cerebrovascular CO2 reactivity in healthy humans is associated with a lowered cerebral oxygenation and an augmented ventilatory response to CO2. J Appl Physiol 102: 1891–1898, 2007 [DOI] [PubMed] [Google Scholar]
- 6. Dempsey JA, Veasey SC, Morgan BJ, O'Donnell CP. Pathophysiology of sleep apnea. Physiol Rev 90: 47–112, 2010 [DOI] [PMC free article] [PubMed] [Google Scholar]
- 7. Duffin J. Role of acid-base balance in the chemoreflex control of breathing. J Appl Physiol 99:2255–2265, 2005 [DOI] [PubMed] [Google Scholar]
- 8. Duffin J. Measuring the ventilatory response to hypoxia. J Physiol 584: 285–293, 2007 [DOI] [PMC free article] [PubMed] [Google Scholar]
- 9. Fanfulla F, Patruno V, Bruschi C, Rampulla C. Obstructive sleep apnoea syndrome: is the “half-night polysomnography” an adequate method for evaluating sleep profile and respiratory events? Eur Respir J 10: 1725–1729, 1997 [DOI] [PubMed] [Google Scholar]
- 10. Foster GE, McKenzie DC, Milsom WK, Sheel AW. Effects of two protocols of intermittent hypoxia on human ventilatory, cardiovascular and cerebral responses to hypoxia. J Physiol 567: 689–699, 2005 [DOI] [PMC free article] [PubMed] [Google Scholar]
- 11. Fregosi RF, Mitchell GS. Long-term facilitation of inspiratory intercostal nerve activity following carotid sinus nerve stimulation in cats. J Physiol 477: 469–479, 1994 [DOI] [PMC free article] [PubMed] [Google Scholar]
- 12. Fuller DD. Episodic hypoxia induces long-term facilitation of neural drive to tongue protrudor and retractor muscles. J Appl Physiol 98: 1761–1767, 2005 [DOI] [PubMed] [Google Scholar]
- 13. Fuse K, Satoh M, Yokota T, Ohdaira T, Muramatsu Y, Suzuki E, Arakawa M. Regulation of ventilation before and after sleep in patients with obstructive sleep apnoea. Respirology 4: 125–130, 1999 [DOI] [PubMed] [Google Scholar]
- 14. Georgopoulos D, Berezanski D, Anthonisen NR. Effects of CO2 breathing on ventilatory response to sustained hypoxia in normal adults. J Appl Physiol 66: 1071–1078, 1989 [DOI] [PubMed] [Google Scholar]
- 15. Gilmartin GS, Tamisier R, Curley M, Weiss JW. Ventilatory, hemodynamic, sympathetic nervous system, and vascular reactivity changes after recurrent nocturnal sustained hypoxia in humans. Am J Physiol Heart Circ Physiol 295: H778–H785, 2008 [DOI] [PMC free article] [PubMed] [Google Scholar]
- 16. Harris DP, Balasubramaniam A, Badr MS, Mateika JH. Long-term facilitation of ventilation and genioglossus muscle activity is evident in the presence of elevated levels of carbon dioxide in awake humans. Am J Physiol Regul Integr Comp Physiol 291: R1111–R1119, 2006 [DOI] [PubMed] [Google Scholar]
- 17. Hayashi F, Coles SK, Bach KB, Mitchell GS, McCrimmon DR. Time-dependent phrenic nerve responses to carotid afferent activation: intact vs. decerebellate rats. Am J Physiol Regul Integr Comp Physiol 265: R811–R819, 1993 [DOI] [PubMed] [Google Scholar]
- 18. Hernandez C, Abreu J, Abreu P, Castro A, Jimenez A. Nocturnal melatonin plasma levels in patients with OSAS: the effect of CPAP. Eur Respir J 30: 496–500, 2007 [DOI] [PubMed] [Google Scholar]
- 19. Jacobs BL, Fornal CA. Serotonin and motor activity. Curr Opin Neurobiol 7: 820–825, 1997 [DOI] [PubMed] [Google Scholar]
- 20. Jordan AS, Catcheside PG, O'Donoghue FJ, McEvoy RD. Long-term facilitation of ventilation is not present during wakefulness in healthy men or women. J Appl Physiol 93: 2129–2136, 2002 [DOI] [PubMed] [Google Scholar]
- 21. Khamnei S, Robbins PA. Hypoxic depression of ventilation in humans: alternative models for the chemoreflexes. Respir Physiol 81: 117–134, 1990 [DOI] [PubMed] [Google Scholar]
- 22. Khodadadeh B, Badr MS, Mateika JH. The ventilatory response to carbon dioxide and sustained hypoxia is enhanced after episodic hypoxia in OSA patients. Respir Physiol Neurobiol 150: 122–134, 2006 [DOI] [PubMed] [Google Scholar]
- 23. Koehle MS, Sheel AW, Milsom WK, McKenzie DC. Two patterns of daily hypoxic exposure and their effects on measures of chemosensitivity in humans. J Appl Physiol 103: 1973–1978, 2007 [DOI] [PubMed] [Google Scholar]
- 24. Lee DS, Badr MS, Mateika JH. Progressive augmentation and ventilatory long-term facilitation are enhanced in sleep apnoea patients and are mitigated by antioxidant administration. J Physiol 587: 5451–5467, 2009 [DOI] [PMC free article] [PubMed] [Google Scholar]
- 25. Ling L, Fuller DD, Bach KB, Kinkead R, Olson EB, Jr, Mitchell GS. Chronic intermittent hypoxia elicits serotonin-dependent plasticity in the central neural control of breathing. J Neurosci 21: 5381–5388, 2001 [DOI] [PMC free article] [PubMed] [Google Scholar]
- 26. Lusina SJ, Kennedy PM, Inglis JT, McKenzie DC, Ayas NT, Sheel AW. Long-term intermittent hypoxia increases sympathetic activity and chemosensitivity during acute hypoxia in humans. J Physiol 575: 961–970, 2006 [DOI] [PMC free article] [PubMed] [Google Scholar]
- 27. Mahamed S, Cunningham DA, Duffin J. Changes in respiratory control after three hours of isocapnic hypoxia in humans. J Physiol 547: 271–281, 2003 [DOI] [PMC free article] [PubMed] [Google Scholar]
- 28. Mahamed S, Hanly PJ, Gabor J, Beecroft J, Duffin J. Overnight changes of chemoreflex control in obstructive sleep apnoea patients. Respir Physiol Neurobiol 146: 279–290, 2005 [DOI] [PubMed] [Google Scholar]
- 29. Mahamed S, Mitchell GS. Respiratory long-term facilitation: too much or too little of a good thing? Adv Exp Med Biol 605: 224–227, 2008 [DOI] [PubMed] [Google Scholar]
- 30. Mahamed S, Mitchell GS. Is there a link between intermittent hypoxia-induced respiratory plasticity and obstructive sleep apnoea? Exp Physiol 92: 27–37, 2007 [DOI] [PubMed] [Google Scholar]
- 31. Mateika JH, Fregosi RF. Long-term facilitation of upper airway muscle activities in vagotomized and vagally intact cats. J Appl Physiol 82: 419–425, 1997 [DOI] [PubMed] [Google Scholar]
- 32. Mateika JH, Mendello C, Obeid D, Badr MS. Peripheral chemoreflex responsiveness is increased at elevated levels of carbon dioxide after episodic hypoxia in awake humans. J Appl Physiol 96: 1197–1205, 2004 [DOI] [PubMed] [Google Scholar]
- 33. Mateika JH, Narwani G. Intermittent hypoxia and respiratory plasticity in humans and other animals: does exposure to intermittent hypoxia promote or mitigate sleep apnoea? Exp Physiol 94: 279–296, 2009 [DOI] [PMC free article] [PubMed] [Google Scholar]
- 34. Mateos SS, Sanchez CL, Paredes SD, Barriga C, Rodriguez AB. Circadian levels of serotonin in plasma and brain after oral administration of tryptophan in rats. Basic Clin Pharmacol Toxicol 104: 52–59, 2009 [DOI] [PubMed] [Google Scholar]
- 35. McEvoy RD, Popovic RM, Saunders NA, White DP. Effects of sustained and repetitive isocapnic hypoxia on ventilation and genioglossal and diaphragmatic EMGs. J Appl Physiol 81: 866–875, 1996 [DOI] [PubMed] [Google Scholar]
- 36. McGuire M, Zhang Y, White DP, Ling L. Serotonin receptor subtypes required for ventilatory long-term facilitation and its enhancement after chronic intermittent hypoxia in awake rats. Am J Physiol Regul Integr Comp Physiol 286: R334–R341, 2004 [DOI] [PubMed] [Google Scholar]
- 37. McGuire M, Zhang Y, White DP, Ling L. Chronic intermittent hypoxia enhances ventilatory long-term facilitation in awake rats. J Appl Physiol 95: 1499–1508, 2003 [DOI] [PubMed] [Google Scholar]
- 38. Narkiewicz K, van de Borne PJ, Pesek CA, Dyken ME, Montano N, Somers VK. Selective potentiation of peripheral chemoreflex sensitivity in obstructive sleep apnea. Circulation 99: 1183–1189, 1999 [DOI] [PubMed] [Google Scholar]
- 39. Olson EB, Jr, Bohne CJ, Dwinell MR, Podolsky A, Vidruk EH, Fuller DD, Powell FL, Mitchell GS. Ventilatory long-term facilitation in unanesthetized rats. J Appl Physiol 91: 709–716, 2001 [DOI] [PubMed] [Google Scholar]
- 40. Osanai S, Akiba Y, Fujiuchi S, Nakano H, Matsumoto H, Ohsaki Y, Kikuchi K. Depression of peripheral chemosensitivity by a dopaminergic mechanism in patients with obstructive sleep apnoea syndrome. Eur Respir J 13: 418–423, 1999 [DOI] [PubMed] [Google Scholar]
- 41. Pawar A, Peng YJ, Jacono FJ, Prabhakar NR. Comparative analysis of neonatal and adult rat carotid body responses to chronic intermittent hypoxia. J Appl Physiol 104: 1287–1294, 2008 [DOI] [PMC free article] [PubMed] [Google Scholar]
- 42. Peng YJ, Yuan G, Ramakrishnan D, Sharma SD, Bosch-Marce M, Kumar GK, Semenza GL, Prabhakar NR. Heterozygous HIF-1alpha deficiency impairs carotid body-mediated systemic responses and reactive oxygen species generation in mice exposed to intermittent hypoxia. J Physiol 577: 705–716, 2006 [DOI] [PMC free article] [PubMed] [Google Scholar]
- 43. Powell FL. Lake Louise consensus methods for measuring the hypoxic ventilatory response. Adv Exp Med Biol 588: 271–276, 2006 [DOI] [PubMed] [Google Scholar]
- 44. Powell FL, Milsom WK, Mitchell GS. Time domains of the hypoxic ventilatory response. Respir Physiol 112: 123–134, 1998 [DOI] [PubMed] [Google Scholar]
- 45. Radwan L, Maszczyk Z, Koziej M, Franczuk M, Koziorowski A, Kowalski J, Zielinski J. Respiratory responses to chemical stimulation in patients with obstructive sleep apnoea. Monaldi Arch Chest Dis 55: 96–100, 2000 [PubMed] [Google Scholar]
- 46. Raschke F, Moller KH. [The diurnal rhythm of chemosensitivity and its contribution to nocturnal disorders of respiratory control]. Pneumologie 43, Suppl 1: 568–571, 1989 [PubMed] [Google Scholar]
- 47. Rechtschaffen A, Kales AA. In: A Manual of Standardized Terminology, Techniques, and Scoring System for Sleep Stages of Human Subjects. Washington, DC: National Institutes of Health, 1968 [Google Scholar]
- 48. Rey S, Del RR, Alcayaga J, Iturriaga R. Chronic intermittent hypoxia enhances cat chemosensory and ventilatory responses to hypoxia. J Physiol 560: 577–586, 2004 [DOI] [PMC free article] [PubMed] [Google Scholar]
- 49. Rey S, Del RR, Iturriaga R. Contribution of endothelin-1 to the enhanced carotid body chemosensory responses induced by chronic intermittent hypoxia. Brain Res 1086: 152–159, 2006 [DOI] [PubMed] [Google Scholar]
- 50. Reynolds WJ, Milhorn HT, Jr, Holloman GH., Jr Transient ventilatory response to graded hypercapnia in man. J Appl Physiol 33: 47–54, 1972 [DOI] [PubMed] [Google Scholar]
- 51. Sahn SA, Zwillich CW, Dick N, McCullough RE, Lakshminarayan S, Weil JV. Variability of ventilatory responses to hypoxia and hypercapnia. J Appl Physiol 43: 1019–1025, 1977 [DOI] [PubMed] [Google Scholar]
- 52. Seifert EL, Mortola JP. Circadian pattern of ventilation during prolonged hypoxia in conscious rats. Respir Physiol Neurobiol 133: 23–34, 2002 [DOI] [PubMed] [Google Scholar]
- 53. Serebrovskaya TV, Swanson RJ, Karaban IN, Serebrovskaya ZA, Kolesnikova EE. Intermittent hypoxia alters hypoxic ventilatory responses. Fiziol Zh 45: 9–18, 1999 [PubMed] [Google Scholar]
- 54. Sforza E, Krieger J, Petiau C. Nocturnal evolution of respiratory effort in obstructive sleep apnoea syndrome: influence on arousal threshold. Eur Respir J 12: 1257–1263, 1998 [DOI] [PubMed] [Google Scholar]
- 55. Shea SA. Behavioural and arousal-related influences on breathing in humans. Exp Physiol 81: 1–26, 1996 [DOI] [PubMed] [Google Scholar]
- 56. Sokolowska B, Pokorski M. Ventilatory augmentation by acute intermittent hypoxia in the rabbit. J Physiol Pharmacol 57, Suppl 4: 341–347, 2006 [PubMed] [Google Scholar]
- 57. Spengler CM, Czeisler CA, Shea SA. An endogenous circadian rhythm of respiratory control in humans. J Physiol 526: 683–694, 2000 [DOI] [PMC free article] [PubMed] [Google Scholar]
- 58. Stephenson R. Circadian rhythms and sleep-related breathing disorders. Sleep Med 8: 681–687, 2007 [DOI] [PubMed] [Google Scholar]
- 59. Stephenson R, Mohan RM, Duffin J, Jarsky TM. Circadian rhythms in the chemoreflex control of breathing. Am J Physiol Regul Integr Comp Physiol 278: R282–R286, 2000 [DOI] [PubMed] [Google Scholar]
- 60. Sun X, Deng J, Liu T, Borjigin J. Circadian 5-HT production regulated by adrenergic signaling. Proc Natl Acad Sci USA 99: 4686–4691, 2002 [DOI] [PMC free article] [PubMed] [Google Scholar]
- 61. Tafil-Klawe M, Thiele AE, Raschke F, Mayer J, Peter JH, von Wichert W. Peripheral chemoreceptor reflex in obstructive sleep apnea patients; a relationship between ventilatory response to hypoxia and nocturnal bradycardia during apnea events. Pneumologie 45, Suppl 1: 309–311, 1991 [PubMed] [Google Scholar]
- 62. Tjong YW, Chen Y, Liong EC, Tipoe GL, Fung ML. Chronic hypoxia modulates the function and expression of melatonin receptors in the rat carotid body. J Pineal Res 40: 125–134, 2006 [DOI] [PubMed] [Google Scholar]
- 63. Turner DL, Mitchell GS. Long-term facilitation of ventilation following repeated hypoxic episodes in awake goats. J Physiol 499: 543–550, 1997 [DOI] [PMC free article] [PubMed] [Google Scholar]
- 64. Wadhwa H, Gradinaru C, Gates GJ, Badr MS, Mateika JH. Impact of intermittent hypoxia on long-term facilitation of minute ventilation and heart rate variability in men and women: do sex differences exist? J Appl Physiol 104: 1625–1633, 2008 [DOI] [PMC free article] [PubMed] [Google Scholar]
- 65. Weil JV. Ventilatory control at high altitude. In: Handbook of Physiology. The Respiratory System. Control of Breathing. Bethesda, MD: Am. Physiol. Soc., 1986, sect. 3, vol. II, pt. 2, chapt. 21, p. 703–728 [Google Scholar]
- 66. Weil JV. Ventilatory responses to CO2 and hypoxia after sustained hypoxia in awake cats. J Appl Physiol 76: 2251–2252, 1994 [DOI] [PubMed] [Google Scholar]
- 67. Zabka AG, Mitchell GS, Olson EB, Jr, Behan M. Selected contribution: chronic intermittent hypoxia enhances respiratory long-term facilitation in geriatric female rats. J Appl Physiol 95: 2614–2623, 2003 [DOI] [PubMed] [Google Scholar]
- 68. Zhang S, Robbins PA. Methodological and physiological variability within the ventilatory response to hypoxia in humans. J Appl Physiol 88: 1924–1932, 2000 [DOI] [PubMed] [Google Scholar]