

Abstract
Erythropoietin (Epo) is produced primarily in the kidneys upon low blood oxygen availability and stimulates erythropoiesis in the bone marrow. Recombinant human Epo (rHuEpo), a drug developed to increase arterial oxygen content in patients, is also illicitly used by athletes to improve their endurance performance. Therefore, a robust and sensitive test to detect its abuse is needed. The aim of the present study was to investigate potential human serum biomarkers of Epo abuse employing a proteomic approach. Eight healthy male subjects were injected subcutaneously with rHuEpo (5,000 IU) every second day for a 16-day period. Serum was collected before starting the treatment regime and again at days 8 and 16 during the treatment period. Samples were homogenized and proteins separated by two-dimensional gel electrophoresis (2DE). Spots that changed significantly in response to rHuEpo treatment were identified by mass spectrometry. Both the number of reticulocytes and erythrocytes increased throughout the study, leading to a significant increase in hematocrit and hemoglobin content. In addition, transferrin levels increased but the percentage of iron bound to transferrin and ferritin levels decreased. Out of 97 serum proteins, seven were found to decrease significantly at day 16 compared with pre-Epo administration, and were identified as four isoforms of haptoglobin, two isoforms of transferrin, and a mixture of hemopexin and albumin. In support, total serum haptoglobin levels were found to be significantly decreased at both days 8 and 16. Thus a 2DE proteomic approach for discovery of novel markers of Epo action appears feasible.
Keywords: proteomics, protein isoforms, haptoglobin, transferrin, hemopexin
erythropoietin (Epo) is known to affect the oxygen carrying capacity of the blood by increasing the number of erythrocytes and by simultaneously decreasing plasma volume, resulting in an increase in blood hemoglobin content and hematocrit (23). Epo is secreted primarily from the kidneys when blood oxygen availability decreases. Epo interacts with Epo receptors (Epo-R) predominantly on bone marrow colony-forming erythroid precursor-cells and has anti-apoptotic and proliferative effects, leading to an increase in mature erythrocytes (11, 12).
The gene encoding Epo was first cloned in 1985 (17) and recombinant human Epo (rHuEpo) was approved for clinical use in 1989 for the treatment of chronic anemia in patients with end-stage renal disease (ESRD). Additional FDA-approved clinical indications include HIV, cancer, myelodysplastic syndromes, bone marrow transplantation, hepatitis C, and the prevention of anemia in premature newborns (3). Since Epo stimulates the production of red blood cells and rHuEpo injections over prolonged periods increase submaximal exercise performance by more than 50% (35), it has been and continues to be abused by athletes (3, 5, 25). In 1990, rHuEpo was banned by the American Medical Association and the International Olympic Committee (IOC). However, the abuse continues and a sensitive and robust detection test for Epo is therefore needed. The current method directly measures urinary rHuEpo and is based on differences in glycosylation between rHuEpo and endogenous Epo (5, 25). However, this method is expensive and has low sensitivity (13, 25). Also, whether this test will be effective against new Epo derivates that are produced in human cell lines and thereby express the same glycosylation pattern as endogenous Epo is unknown (13). In addition to the abuse of rHuEpo injections, gene therapy is emerging as a futuristic doping practice. Stable long-term expression of Epo genes in experimental animals has been reported (15). Therefore, IOC and The World Anti Doping Agency (WADA) included “gene doping” on their list of “prohibited substances and methods in sport” in 2003 (25). Thus future doping tests should focus not only on detecting rHuEpo and related protein analogs, but also on biological markers that are altered by Epo exposure. Such markers are presently being investigated and include the assessment of total hemoglobin mass and reticulocyte percentage (OFFhr-score) monitored over time and recorded in a program called “blood passport” (13). Unfortunately, this approach is not able to reliably identify Epo use. The cut-off limits for the OFFhr-score are based on average population levels of total hemoglobin mass and reticulocyte percentage. Given the large interpersonal variability, the cut-off values (upper and lower levels) for this model are set very wide to prevent false-positive results. This ultimately leads to low detection levels (4, 22).
Thus there is a need for developing more robust and sensitive anti-doping tests that can detect different generations of rHuEpo derivates with a longer window for detection. Protein profiling provides a powerful method for characterizing the complete set of proteins expressed in a biological system (19), as well as detecting individual isoforms of each protein, thus improving the specificity and possibly improving the “time window” for detection. A major advantage of proteomic profiling is that, in addition to detection of rHuEpo use and abuse, these biomarkers also will be useful for the detection of Epo gene doping and rHuEpo derivates from human cell lines. A combination of protein profiling and the current WADA test, with a shorter detection window, may actually be the most optimal anti-doping regime. In the current study, we set out to determine whether proteomics could be used to detect novel serum biomarkers for rHuEpo abuse. It was found that the levels of several human serum proteins changed following 16 days of rHuEpo treatment. Thus these proteins have the potential to be new biomarkers for rHuEpo abuse.
METHODS
Subjects
Eight healthy male volunteers (25 ± 4 yr, 183 ± 6 cm, 79 ± 7 kg, mean ± SE) were included in the present study. They did not take any medication and did not participate in competitive sports or training during the study period. All subjects gave written informed consent before participating in the study, which was approved by the local human ethical committee of Copenhagen and Frederiksberg, Denmark (KF 01 269 637) in adherence to the Declaration of Helsinki.
Study Design
rHuEpo (epoetin β; NeoRecormon, Roche, Mannheim, Germany) was injected every second day (days 0, 2, 4, 6, 8, 10, 12, 14) subcutaneously at a dose of 5,000 IU. Serum was collected ∼1 wk before the first Epo injection, and at days 8 and 16 (before the injections) during the injection period. After clotting for 15 min at room temperature, serum was stored at −80°C for subsequent analysis. Also, blood pressure was monitored every second day throughout the study.
Measurements of Basic Hematological Parameters
Venous blood samples were analyzed for hemoglobin, erythrocytes, iron, transferrin, ferritin, reticulocytes, creatinine, sodium, and potassium using a Sysmex R-3000 (Sysmex Europe, Norderstedt, Germany). Furthermore, total albumin, ALAT, basic phosphatase, LDH, bilirubin, and haptoglobin were measured by Cobas c-systems (Roche Diagnostics, Mannheim, Germany).
Measurements of IL-1β and IL-6
IL-1β and IL-6 was measured by the Human Ultrasensitive Cytokine 10-plex panel (Invitrogen, LHC6004) on a Luminex 100 Bio-Plex system (BioRad Laboratories, Hercules, CA). The interassay variation coefficients given by the manufacturer were 7.2% (IL-1β) and 4.4% (IL-6) with a sensitivity <1.0 pg/ml.
Proteomic Analysis
The procedures used for the proteomic analysis have been described previously (9, 21, 28, 32) and are briefly reviewed below.
Sample preparation.
Before 2DE, the serum samples were depleted of albumin and IgG using the ProteoPrep Blue Albumin & IgG Depletion kit (Sigma, St. Lewis, MO). Next, serum samples containing 300 μg of protein were diluted in sample buffer [7 M urea, 2 M thiourea, 1% wt/vol SB 3–10, 3% wt/vol CHAPS, 0.25% vol/vol Bio-Lyte 3/10 ampholytes (BioRad)] containing 1.5% vol/vol protease inhibitor cocktail (Sigma). Disulfide bonds were reduced by addition of tributylphosphine, and sulfhydryl groups were alkylated with iodoacetamide.
Two-dimensional gel electrophoresis.
For the first dimension, diluted and treated samples were loaded onto IPG strips (17 cm, pH 3–10 linear, BioRad) and passively rehydrated for 2 h at room temperature. Then, strips were placed into a PROTEAN IEF cell (BioRad) for isoelectric focusing consisting of 12 h of active rehydration at 50 V and separated by linear voltage increase to 10,000 V for 3 h followed by rapid voltage increase up to 60,000 V·h. The strips were then equilibrated for 45 min in equilibration buffer (0.375 M Tris·HCl pH 8.8, 6 M urea, 2% wt/vol SDS, 20% vol/vol glycerol, and bromophenol blue). After cutting 4.5 cm from both sides of each strip, the middle 8-cm segment (pH 5 to 8) was loaded on a 15% polyacrylamide gel with 4% stacking. SDS-PAGE was run in a Mini-PROTEIN 3 cell (BioRad) at 25 mA/gel and 270 V·h. Gels were fixed (40% ethanol, 2% acetic acid, 0.005% wt/vol SDS), washed three times (2% acetic acid, 0.005% wt/vol SDS), stained using SYPRO Orange (Molecular Probes, Eugene, OR), and scanned. Images were captured using a PharosFX Plus Molecular Imager (BioRad) with an excitation wavelength of 488 nm and emission detected at 605 nm.
Image analysis.
Protein spots in the gels were matched using the image analysis software PDQuest Advanced v. 8.0 (BioRad) and all matches were confirmed manually. Protein spot intensities were normalized to the total image density in each gel, which depended on the total protein content of the sample.
Mass spectrometry.
Protein spots displaying significant (P < 0.05) intensity changes at the time points studied were manually excised from the gels and sent to Protea Biosciences, Morgantown, WV, for analysis by mass spectrometry (MS) and tandem-MS (MS/MS) using matrix assisted laser desorption/ionization-time of flight (MALDI-TOF) and MALDI-TOF-TOF.
In-gel digestion and sample preparation protocol (performed by Protea Biosciences).
Gel spots were diced into small pieces, which were dehydrated and then rehydrated with acetonitrile and 50 mM ammonium bicarbonate, respectively. Proteins in the gel pieces were reduced and alkylated with 250 mM DTT (60 min/55°C) and 650 mM iodoacetamide (60 min/room temperature/in the dark), respectively. Digestion was performed with 500 ng trypsin in 50 mM ammonium bicarbonate buffer overnight. Extraction of peptides was performed using 5% formic acid in 50% acetonitrile (dehydration), followed by rehydration with 50 mM ammonium bicarbonate. For each extraction step, the solution was aspirated, collected, and collated. A total of three extraction cycles (dehydration and rehydration) were performed per sample. The recovered peptides were lyophilized, reconstituted in 10 mM acetic acid, and relyophilized to yield a purified protein digest extract.
MALDI target spotting protocol (performed by Protea Bbiosciences).
A C18 ProteaTip was washed and then equilibrated using a 0.1% TFA/50% acetonitrile solution and a 0.1% TFA/2% acetonitrile solution, respectively. The remaining reconstituted protein digest solution in an autosampler vial (∼65% of sample) was loaded onto the C18 ProteaTip by aspirating and expelling the sample 5–10 times within the sample vial. The bound sample was washed twice with the 0.1% TFA/2% acetonitrile solution by aspirating and expelling 20 μl of the wash solution 5–10 times. The sample was spotted directly onto a MALDI target that was prespotted with 0.6 μl MALDI matrix (CHCA) using 1 μl of an elution solution (0.1% TFA/90% acetonitrile).
MALDI mass spectrometer parameters (performed by Protea Biosciences).
Instrument: ABI 4800 MALDI TOF/TOF analyzer. Data acquisition and processing program: 4000 Series Explorer software; MS acquisition in reflector mode positive ion mode; mass range: m/z = 850 - 4,000; 400 laser shots per spectrum; minimum S/N = 5 for MS acquisition; 15 strongest precursors chosen for MS/MS; minimum S/N = 30 for MS/MS precursors; MALDI spot interrogated until at least four peaks in the MS/MS spectra achieved a S/N = 70.
Database correlation analysis search parameters (performed by Protea Biosciences).
Protein identification from MS and MS/MS data: Program for MS/MS data processing: ProteinPilot 3.0; Search Engine: Mascot (Matrix Science); Sample Type: gel samples; Digestion Enzyme: Trypsin; Species: Human; Database: NCBInr; Search Engine: Type of Search: Combined MS and MS/MS; Mass Values: monoisotopic; Protein Mass: unrestricted; Peptide Mass Tolerance: ±0.3–1 Da; Maximum Missed Cleavages: 1; Variable Modifications: carbamidomethyl (C); Exclusion mass list: 1151.8, 1358.9, 1795.1, 2211.4, 2225.4, 2283.
Protein identification.
Protein identities obtained by Protea Biosciences (see above) were verified or revised using the MS and MS/MS data and the online software Mascot. Search parameters included the following: MS: database: NCBInr; taxonomy: Homo sapiens; enzyme: trypsin; missed cleavages allowed: 1; fixed modifications: none or carbamidomethyl (C); protein mass: none; peptide tolerance: ±0.1 to 1.2 Da; mass values: MH+; monoisotopic/average: monoisotopic. Tandem MS: database: NCBInr; taxonomy: Homo sapiens; enzyme: trypsin; missed cleavages allowed: 1; fixed modifications: none or carbamidomethyl (C); Quantitation: none; peptide tolerance: ±0.1 to 1.2 Da; MS/MS tolerance: ±0.1 to 0.6 Da; Peptide charge: 1+; monoisotopic/average: monoisotopic; Precursor m/z: none; Instrument: MALDI-TOF-TOF.
Statistical Analysis
The level of significance was set at P < 0.05. Data were tested using a parametric repeated-measures one-way ANOVA if data passed a normality test (Shapiro-Wilk). If non-normally distributed, a repeated-measures ANOVA on ranks was used. Normally distributed data were also tested for sphericity (Mauchly's test), and a Greenhouse-Geisser's correction factor was applied to non-spherical data. Tukey's HSD test was used for post hoc comparisons. All spot intensity data were log-transformed before analysis. SPSS v. 14.0 and SigmaPlot v. 11.0 were used for statistical analysis and graphical presentation.
RESULTS
Hematological Measurements
At baseline, all measured hematological parameters of the individuals were within normal ranges (Table 1). At day 8 both the total number of reticulocytes and the number of reticulocytes per 1,000 erythrocytes were upregulated compared with baseline. The numbers did not change between days 8 and 16 and remained elevated at day 16. However, erythrocyte counts did not change at day 8 but increased significantly at day 16, resulting in a significantly increased hematocrit. Furthermore, hemoglobin also increased at day 16. The levels of iron and sodium decreased significantly after Epo treatment. Transferrin levels were significantly increased at day 16, but the percentage of iron bound to transferrin was decreased at days 8 and 16. Also ferritin levels were significantly decreased at days 8 and 16. Haptoglobin levels were significantly decreased at days 8 and 16 compared with baseline. Total albumin, basic phosphatase, bilirubin, and LDH did not change throughout the study (Table 1). Furthermore, almost all serum samples had ALAT concentrations below the detection limit (<9 U/l), the remaining being in the lower part of the reference interval (data not shown).
Table 1.
Clinical hematological values
| Baseline | Day 8 | Day 16 | P Value | |
|---|---|---|---|---|
| B-hemoglobin (fe), mM | 9.24 ± 0.17 | 9.29 ± 0.16 | 9.68 ± 0.18 | *0.008, ‡0.017 |
| B-erythrocytes, billion/l | 4.94 ± 0.08 | 4.97 ± 0.08 | 5.17 ± 0.06 | *0.003, ‡0.008 |
| B-erythrocytes, vol.fr. % | 0.44 ± 0.01 | 0.45 ± 0.01 | 0.46 ± 0.01 | *0.01 |
| Erythrocyte, MCV, fl | 89.1 ± 0.8 | 89.6 ± 1.1 | 89.0 ± 1.2 | NS |
| Erythrocyte, MCHC, mM | 21.0 ± 0.1 | 20.9 ± 0.1 | 21.0 ± 0.1 | NS |
| P-iron, μM | 19.9 ± 2.5 | 10.6 ± 1.6 | 9.5 ± 1.6 | *<0.001, †<0.001 |
| P-transferrin, μM | 32.8 ± 1.0 | 34.8 ± 0.8 | 37.4 ± 1.1 | *<0.01 |
| P-transferrin, % iron binding | 0.30 ± 0.04 | 0.15 ± 0.02 | 0.13 ± 0.02 | *<0.001, †<0.001 |
| P-ferritin, μg/l | 114.6 ± 29.0 | 38.6 ± 10.7 | 24.2 ± 6.0 | *<0.001, †0.002 |
| Reticulocytes, 1/1000 erythrocytes | 9.3 ± 0.6 | 20.6 ± 2.0 | 18.0 ± 2.3 | *<0.001,†<0.001 |
| Reticulocytes, billion/l | 46.1 ± 3.6 | 102.0 ± 10.0 | 91.9 ± 13.2 | *<0.001, †<0.001 |
| S-haptoglobin g/l | 1.12 ± 0.18 | 0.96 ± 0.15 | 0.85 ± 0.14 | *<0.001, †0.022 |
| S-albumin g/l | 47.8 ± 1.0 | 48.3 ± 0.5 | 48.6 ± 1.2 | NS |
| P-creatininum, mM | 0.088 ± 0.002 | 0.089 ± 0.002 | 0.090 ± 0.003 | NS |
| P-sodium, mM | 144.6 ± 1.1 | 142.3 ± 0.4 | 141.8 ± 0.6 | *0.03 |
| P-potassium, mM | 3.98 ± 0.07 | 3.8 ± 0.08 | 4.0 ± 0.08 | NS |
| S-basic phosphatase U/l | 62.0 ± 9.5§ | 52.6 ± 3.9 | 56.3 ± 2.8 | NS |
| S-bilirubin μM | 5.0 ± 0.6§ | 5.6 ± 0.7 | 6.6 ± 1.2 | NS |
| S-LDH U/l | 77.3 ± 16.7§ | 98.3 ± 8.4 | 115.7 ± 9.3 | NS |
Values shown as mean ± SE. B, blood; P, plasma; S, serum; MCV, mean corpuscular volume; MCHC, mean corpuscular hemoglobin; LDH, lactate dehydrogenase.
Baseline vs. day 16;
baseline vs. day 8; ‡day 8 vs. day 16,
n = 3.
IL-1β and IL-6 Measurements
All measurements of IL-1β and IL-6 were below the standard with the lowest concentration (Il-1β: 0.38 pg/ml, IL-6: 0.56 pg/ml) and, thus, outside the range of the standard curve. No significant difference was found in the IL-1β levels throughout the study (baseline: 0.32 ± 0.08, day 8: 0.27 ± 0.07, day 16: 0.34 ± 0.08 pg/ml, P = 0.44). Il-6 levels were below the detection limit in all samples.
Serum Proteome Patterns
The serum protein patterns observed for all subjects were homogeneous. Furthermore, the protein patterns were consistent in each subject before and after treatment with rHuEpo. Figure 1 shows a representative 2D gel. The high molecular weight region of the gel (>80 kDa) revealed low resolution of proteins, therefore, changes in proteins in this region were not analyzed.
Fig. 1.
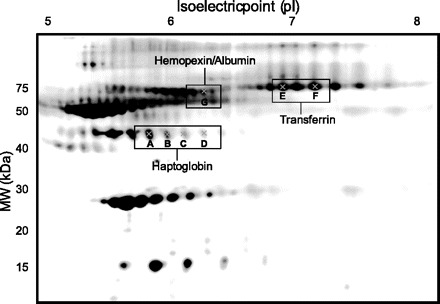
Representative 2-dimensional (2D) gel of human serum. Protein spots that changed significantly (P < 0.05) after 16 days of treatment with recombinant human erythropoietin (rHuEpo) are marked and their identity shown.
Serum Proteome Changes After Treatment with rHuEpo
A total of 97 proteins were analyzed in the serum 2D gels; among them, 92 were observed in all subjects. No protein intensities were altered after 8 days of rHuEpo treatment compared with baseline. But the intensities of seven of the 92 spots were significantly downregulated at day 16 (Figs. 1 and 2). Six of these proteins were located in two different protein spot “trains,” i.e., proteins with nearly the same molecular mass and varying isoelectric points (pIs). Protein identities were determined by MS and MS/MS. Identity matches, scores, and sequence coverage values are shown in Table 2. The four proteins located in the ∼45-kDa “train” [A (P = 0.014), B (P = 0.006), C (P = 0.013), and D (P = 0.047)] were identified as haptoglobin, and displayed varying pIs (A: ∼5.8, B: ∼6.0, C: ∼6.1, and D: ∼6.3). Additionally, the two proteins in the ∼75-kDa train [E (P = 0.018) and F (P = 0.047)] were identified as transferrin. The pIs for spot E and F were ∼6.9 and ∼7.2, respectively. Different versions of the same protein are referred to as “protein isoforms.” Thus we have detected four haptoglobin isoforms and two transferrin isoforms. Another protein spot that changed [G (P = 0.050)] on rHuEpo treatment was found to be a mixture of hemopexin and serum albumin (MW ∼ 70 kDa and pI ∼6.3; Table 2).
Fig. 2.
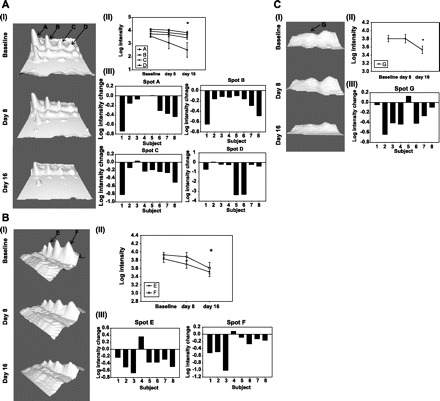
Serum protein changes for haptoglobin isoforms (A), transferrin (B), and hemopexin/albumin (C). I; Representative 3D image of protein spots showing changes in intensity at baseline, days 8 and 16. Images were obtained using the 3D viewer tool from PDQuest, which converts spot intensity to topographical peaks. All spot images shown belong to the same subject. II; Mean changes in intensity for each of the spots. Spot intensity changes at day 16 were significantly different from baseline. III; Spot intensity changes between baseline and day 16 in individual subjects.
Table 2.
Mass spectrometry identity matches (significant spots)
| MS Results |
MS/MS Results |
|||||||
|---|---|---|---|---|---|---|---|---|
| Spot # | Protein | Uniprot # | Matched fragments | Sequence coverage (%) | Score (Mascot) | Matched fragments | Sequence coverage (%) | Score (Mascot) |
| A | Haptoglobin | P00738 | 7/24 | 31 | 91 | 7/39 | 25 | 418 |
| B | Haptoglobin | P00738 | 8/32 | 35 | 93 | 5/45 | 15 | 269 |
| C | Haptoglobin | P00738 | 8/33 | 35 | 88 | 5/46 | 17 | 217 |
| D | Haptoglobin | P00738 | 7/35 | 30 | 67 | 3/47 | 7 | 154 |
| E | Transferrin | P02787 | 17/41 | 31 | 186 | 10/56 | 21 | 707 |
| F | Transferrin | P02787 | 19/38 | 36 | 202 | 10/53 | 21 | 643 |
| G | Hemopexin | P02790 | 12/39 | 36 | 120 | 7/53 | 25 | 651 |
| Serum albumin | P02768 | 10/39 | 22 | 68 | 3/53 | 7 | 50 | |
Matched fragments; the number of peptides matched with the protein/the total amount of peptides in the sample. Sequence coverage; the percentage of the total protein that the matched peptides cover. Score; the score given by MASCOT, for MS results score above 66 was considered significant (P = 0.05), for MS/MS the significance level was a score of 35–37 (protein dependent). Mascot: http://www.matrixscience.com. Uniprot: http://www.uniprot.org.
DISCUSSION
The current study investigated the changes in serum protein profiles from healthy young men after rHuEpo treatment. Several isoforms of three different proteins changed significantly after 16 days of treatment.
Circulating levels of reticulocytes (immature erythrocytes) and erythrocytes increased significantly throughout the study, leading to increased levels of both hemoglobin and hematocrit as expected. The levels of transferrin increased but the percentage of iron bound to transferrin decreased. This was in line with the decreased levels of iron and ferritin also found in the current study. The fact that the levels of hemoglobin and erythrocytes increased significantly throughout the study indicates that the iron levels did not reach critically low levels inhibiting erythropoiesis. However, iron supplementation should be used in future studies to mimic the doping setting. A small but significant fall (∼2%) in sodium levels was found at day 16; the levels were at all time within normal physiological levels and probably have little clinical relevance. Thus, as expected and in agreement with previous studies (18, 23), our results show that 16 days of treatment with rHuEpo leads to a robust stimulation and production of red blood cells and use of iron.
The proteomic data obtained in the current study showed no significant changes in serum protein intensities at day 8. However, at day 16, the levels of four isoforms of haptoglobin, one isoform of hemopexin/albumin, and two isoforms of transferrin were significantly decreased. To our knowledge haptoglobin, transferrin, or hemopexin levels have not previously been implicated in rHuEpo action in healthy human subjects. Thus their physiological role in terms of Epo activity must be further investigated.
The finding that total haptoglobin levels were decreased supported the decrease in the four isoforms that we found. Thus the change in haptoglobin, both total and isoforms levels, makes the finding even more robust. Haptoglobin binds free plasma hemoglobin and thereby prevents hemoglobin related oxidative damage. The haptoglobin-hemoglobin complex is removed from the circulation by endocytosis into monocytes and tissue macrophages and finally degraded in the liver and spleen; in that way also iron loss through the kidneys is prevented (29).
The protein spot that was identified as hemopexin also contained a small amount of albumin. Hemopexin is a protein that binds heme and transports it to the liver for breakdown/recovery and prevents heme-mediated oxidative damage and heme-bound iron loss (36). Although the serum samples were albumin-depleted before resolution by 2D gel electrophoresis, the procedure used for albumin-depletion is only ∼85% effective; thus some albumin may still be present in the samples. Unfortunately, it is not possible to determine which of the two proteins (hemopexin or albumin) is responsible for the decrease in the intensity of this spot. Given that circulating albumin levels are positively correlated to total hemoglobin (1, 31) and that hemoglobin increased in the current study, it would have been expected that total albumin levels would increase. However, albumin levels were found to be stable throughout the study. As clearly shown for two transferrin isoforms, although the total levels of a protein may vary in one direction, some of its isoforms might change in the opposite direction (or remain constant). Therefore, we cannot make conclusions about the levels of hemopexin and albumin in this particular spot.
Both hemopexin and haptoglobin are class I acute-phase proteins that are produced primarily in the liver in relation to inflammation and hypoxia. Furthermore, IL-6 and IL-1 also induce these proteins (29, 36, 37). Recently, increased levels of Epo were shown to repress the expression of IL-1β that accompanies traumatic brain injury and repress IL-6 levels in an experimental autoimmune encephalomyelitis rat model (2, 7). Hypoxia, leading to increased Epo secretion, has also been shown to induce the expression of a number of acute phase proteins, among them haptoglobin. However, the increase in these acute phase proteins in response to hypoxia could not simply be attributed to autocrine IL-6 activation (37). Thus there may be a link between the levels of hemopexin/haptoglobin with those of Epo that are mediated by IL-1 and IL-6. In the current study, IL-1β and IL-6 levels were found to be very low and not affected by the rHuEpo treatment. In agreement with our data, it has previously been shown that an acute bolus of rHuEpo does not lead to changed IL-6 levels in healthy human subjects (16). Thus rHuEpo might only lower cytokine levels when IL-1β and IL-6 are elevated above normal levels.
Other possible explanations for a decrease in haptoglobin and hemopexin could be a decreased production in the liver due to decreased liver function or intravascular hemolysis. Liver function was evaluated by measurements of ALAT and basic phosphatase, both of which would be increased on liver dysfunction. In the current study, almost all samples had ALAT concentrations below the detection level and the remaining in the lower part of the reference interval. Basic phosphatase levels were within normal range and did not change throughout the study. Thus the decrease in haptoglobin and hemopexin are not due to altered liver function. LDH and bilirubin were measured to evaluate intravascular hemolysis. Both markers were within normal range and did not change throughout the study; thus, intravascular hemolysis is not the reason for the decreased levels of haptoglobin and hemopexin either. Together, these results suggest that the decrease in haptoglobin and hemopexin is most likely a result of the treatment with rHuEpo; however, the underlying mechanism is unknown and merits further investigation.
In contradiction to the total levels of transferrin measured in the blood, we found that two isoforms of transferrin were significantly decreased at day 16. Transferrin is the major transporter of iron from its storage sites to the bone marrow (6, 14). We currently do not have an explanation as to why these two isoforms of transferrin decrease while the other isoforms (>8) remain unchanged. However, this is also the strength of the current method—the ability to identify isoforms of proteins that respond specifically to the treatment given. Changes in the total amounts of a particular protein do not necessarily reflect changes in individual isoforms of the particular protein, as was seen here for transferrin. Different isoforms of a protein usually display mass and/or charge shifts generated primarily by posttranslational modifications (PTM), such as protein cleavage, side-chain residue modifications (e.g., phosphorylation, sulfonation, oxidation), and glycosylation among others (24), that may induce a change in activity in the modified protein. Thus the next step is to identify the chemical nature of the PTM that is specific for the isoforms of transferrin that changed significantly in the current study. These results would then start to reveal the physiological significance of the finding.
The changes found for haptoglobin are the most robust, with four isoforms and the total serum levels both being significantly decreased. However, at this early time point in the discovery of new biomarkers for Epo, it is still worth noting the changes in transferrin. It could be that a combination of changes for haptoglobin and transferrin will turn out to be the most specific biomarker.
New Biomarkers for a Future Doping Test?
The seven protein spots identified in our study show clear intensity variations in response to rHuEpo treatment (Fig. 2). To use these protein isoforms as biomarkers in future Epo doping studies, the effects of physical activity and environmental exposure, such as altitude, will need to be evaluated on these biomarkers. No such data have been published from human studies, but the effects of exercise on serum proteomes of mice have been investigated (38). It was found that different isoforms of kallikreins were increased after exercise, but that different isoforms of haptoglobin were unchanged (38). Thus, at least in mice, it seems that haptoglobin does not respond to exercise in the same manner as it does to rHuEpo treatment in humans. A resolution of the changes in haptoglobin isoforms as a function of exercise and/or rHuEpo treatment in humans must be determined.
In addition, total serum levels of different proteins and iron have been quantified in relation to physical activity. Exercise-induced iron deficiency is a common phenomenon among endurance-trained athletes, due to hemolysis, hematuria, sweating, and gastrointestinal bleeding (26, 31, 34). Similar to the observed effects of exercise, our data show that treatment with rHuEpo decreased serum iron levels. The increased hemolysis related to endurance training also leads to an increase in free hemoglobin (8, 26). Exercise has been found to activate the synthesis of acute phase proteins in the circulation leading to increased levels of haptoglobin, transferrin, and, to a minor extent, hemopexin (20, 34). However, a single bout of endurance training results in decreased haptoglobin and hemopexin levels, most likely due to their increased clearance from the blood after binding to hemoglobin and heme, respectively, released by exercise-induced hemolysis (20, 31). As a consequence of the exercise-induced acute phase response and to cope with a new bout of exercise leading to hemolysis, a significant upregulation in these proteins takes place (20). The level of hemolysis during exercise depends on the type of exercise performed, with running being associated with higher levels of hemolysis due to heel strike than other types of exercise, for example, swimming, cycling, or rowing (27). Both total haptoglobin and four of its isoforms were found to decrease with rHuEpo treatment. Furthermore, two isoforms of transferrin and one isoform of hemopexin also decreased after treatment with rHuEpo. Thus some of the acute effects of training on hematological factors seem to be similar to those of rHuEpo treatment, whereas the long-term effects appear to differ. However, the strength of the proteomic approach is that all isoforms of a protein are evaluated, not only the total protein levels. Currently, it is not known which isoforms of haptoglobin, transferrin, and hemopexin change in response to exercise; it may very well be that other isoforms than the ones reported in the current study could change with exercise. This type of finding would be ideal in terms of differentiating the effects of Epo vs. exercise.
Hypoxia is another stimulus known to increase endogenous Epo production and thereby increase the oxygen carrying capacity (10, 30, 33); the reason for which athletes frequently exercise at high altitude to improve their aerobic capacity. Thus the effects of hypoxia on novel biomarkers for rHuEpo abuse should also be considered. Both in humans and a human hepatoma cell line exposed to hypoxia, total transferrin and haptoglobin expression have been found to be upregulated, while total hemopexin and ferritin expression remain unaltered (33, 37). Thus the effects of hypoxia on the total levels of haptoglobin, transferrin, and hemopexin are different from the results obtained in the current study, where isoforms of the three proteins were downregulated.
In the current study, the identified proteins did not change until 16 days into the treatment with rHuEpo. In the context of developing a future doping test, this might be a limitation since a minimum of 8–16 days of rHuEpo misuse is needed for detection of these markers. However, the current method used by WADA has a short detection window (<3 days); in that regard, it could be beneficial to combine the two test methods to expand the window of detection. Today, athletes stop abusing rHuEpo days before the competition to avoid positive in-competition testing. In future studies, the wash-out effect on these biomarkers must be evaluated. It could be hypothesized that the effects of rHuEpo on haptoglobin and transferrin would last for some time, since these are abundant proteins with a slower turnover than the rHuEpo itself. By increasing the window for detection, athletes would need to stop rHuEpo administration even earlier, thereby decreasing the possible positive effects of the drug during competition.
Furthermore, the dosage used in the current study (5,000 IU ∼ 60 IU/kg every 2nd day) resembles the starting dose recommended by NeoRecormon (Roche; 40–50 IU/kg 3 times a week) for treatment of anemia in patients, but the dose is probably slightly higher than the dose used in a doping setting. Thus it has to be further evaluated if a lower dose of rHuEpo will also lead to significant changes in the identified proteins. Moreover, future studies should also include a proper placebo-treated group to account for potential changes over time not related to Epo. Finally, since our study only included men, it remains to be replicated in women, who may well exhibit sex-specific changes in iron metabolism during the menstrual cycle.
Conclusion
We believe that the changes in specific isoforms of haptoglobin and transferrin could be potentially new biomarkers for erythropoietin abuse. The strength of this method is that individual isoforms of a protein can be evaluated, which increases the specificity of the test, especially compared with hematological measurements and the blood passport. Another advantage of the current method is that these biomarkers will be affected by increased Epo levels also in response to gene doping and rHuEpo derivates with a human glycosylation pattern, two settings where the current IEF method would fail. Furthermore, the identified proteins are abundant serum proteins, which could increase the window for detection compared with measurements of the rHuEpo itself. However, both the effects of exercise and hypoxia on these isoforms must be evaluated before they can be implemented in an anti-doping test, optimally in combination with already established methods.
GRANTS
This work was partly supported by Helga and Peter Korning's Fond, Anti Doping Denmark, and by The Danish Council for Independent Research in Medical Sciences (271–08-0647), Denmark. Furthermore, the work was supported by funds from National Institute on Aging (AG19899 and AG031736), National Institute of Diabetes and Digestive and Kidney Diseases (DK075436), the World Anti-Doping Agency (WADA), the State of Ohio's Eminent Scholar Program that includes a gift from Milton and Lawrence Goll, and by the Diabetes Research Initiative at Ohio University.
DISCLOSURES
No conflicts of interest, financial or otherwise, are declared by the authors.
REFERENCES
- 1. Agarwal R, Davis JL, Smith L. Serum albumin is strongly associated with erythropoietin sensitivity in hemodialysis patients. Clin J Am Soc Nephrol 3: 98–104, 2008 [DOI] [PMC free article] [PubMed] [Google Scholar]
- 2. Agnello D, Bigini P, Villa P, Mennini T, Cerami A, Brines ML, Ghezzi P. Erythropoietin exerts an anti-inflammatory effect on the CNS in a model of experimental autoimmune encephalomyelitis. Brain Res 952: 128–134, 2002 [DOI] [PubMed] [Google Scholar]
- 3. Barroso O, Mazzoni I, Rabin O. Hormone abuse in sports: the antidoping perspective. Asian J Androl 10: 391–402, 2008 [DOI] [PubMed] [Google Scholar]
- 4. Borno A, Aachmann-Andersen NJ, Munch-Andersen T, Hulston CJ, Lundby C. Screening for recombinant human erythropoietin using [Hb], reticulocytes, the OFF(hr score), OFF (z score) and Hb (z score): status of the Blood Passport. Eur J Appl Physiol 109: 1003–1005, 2010 [DOI] [PubMed] [Google Scholar]
- 5. Catlin DH, Fitch KD, Ljungqvist A. Medicine and science in the fight against doping in sport. J Intern Med 264: 99–114, 2008 [DOI] [PubMed] [Google Scholar]
- 6. Cavill I. Erythropoiesis and iron. Best Pract Res Clin Haematol 15: 399–409, 2002 [DOI] [PubMed] [Google Scholar]
- 7. Chen G, Shi JX, Hang CH, Xie W, Liu J, Liu X. Inhibitory effect on cerebral inflammatory agents that accompany traumatic brain injury in a rat model: a potential neuroprotective mechanism of recombinant human erythropoietin (rhEPO). Neurosci Lett 425: 177–182, 2007 [DOI] [PubMed] [Google Scholar]
- 8. Cordova MA, Escanero JF. Iron, transferrin, and haptoglobin levels after a single bout of exercise in men. Physiol Behav 51: 719–722, 1992 [DOI] [PubMed] [Google Scholar]
- 9. Ding J, List EO, Okada S, Kopchick JJ. Perspective: proteomic approach to detect biomarkers of human growth hormone. Growth Horm IGF Res 19: 399–407, 2009 [DOI] [PMC free article] [PubMed] [Google Scholar]
- 10. Eckardt KU, Boutellier U, Kurtz A, Schopen M, Koller EA, Bauer C. Rate of erythropoietin formation in humans in response to acute hypobaric hypoxia. J Appl Physiol 66: 1785–1788, 1989 [DOI] [PubMed] [Google Scholar]
- 11. Foley RN. Erythropoietin: physiology and molecular mechanisms. Heart Fail Rev 13: 405–414, 2008 [DOI] [PubMed] [Google Scholar]
- 12. Fried W. Erythropoietin and erythropoiesis. Exp Hematol 37: 1007–1015, 2009 [DOI] [PubMed] [Google Scholar]
- 13. Gore CJ, Parisotto R, Ashenden MJ, Stray-Gundersen J, Sharpe K, Hopkins W, Emslie KR, Howe C, Trout GJ, Kazlauskas R, Hahn AG. Second-generation blood tests to detect erythropoietin abuse by athletes. Haematologica 88: 333–344, 2003 [PubMed] [Google Scholar]
- 14. Handelman GJ, Levin NW. Iron and anemia in human biology: a review of mechanisms. Heart Fail Rev 13: 393–404, 2008 [DOI] [PubMed] [Google Scholar]
- 15. Hojman P, Gissel H, Gehl J. Sensitive and precise regulation of haemoglobin after gene transfer of erythropoietin to muscle tissue using electroporation. Gene Ther 14: 950–959, 2007 [DOI] [PubMed] [Google Scholar]
- 16. Hojman P, Taudorf S, Lundby C, Pedersen BK. Erythropoietin augments the cytokine response to acute endotoxin-induced inflammation in humans. Cytokine 45: 154–157, 2009 [DOI] [PubMed] [Google Scholar]
- 17. Jacobs K, Shoemaker C, Rudersdorf R, Neill SD, Kaufman RJ, Mufson A, Seehra J, Jones SS, Hewick R, Fritsch EF. Isolation and characterization of genomic and cDNA clones of human erythropoietin. Nature 313: 806–810, 1985 [DOI] [PubMed] [Google Scholar]
- 18. Juel C, Thomsen JJ, Rentsch RL, Lundby C. Effects of prolonged recombinant human erythropoietin administration on muscle membrane transport systems and metabolic marker enzymes. Eur J Appl Physiol 102: 41–44, 2007 [DOI] [PubMed] [Google Scholar]
- 19. Kohn EC, Azad N, Annunziata C, Dhamoon AS, Whiteley G. Proteomics as a tool for biomarker discovery. Dis Markers 23: 411–417, 2007 [DOI] [PMC free article] [PubMed] [Google Scholar]
- 20. Liesen H, Dufaux B, Hollmann W. Modifications of serum glycoproteins the days following a prolonged physical exercise and the influence of physical training. Eur J Appl Physiol Occup Physiol 37: 243–254, 1977 [DOI] [PubMed] [Google Scholar]
- 21. List EO, Berryman DE, Palmer AJ, Qiu L, Sankaran S, Kohn DT, Kelder B, Okada S, Kopchick JJ. Analysis of mouse skin reveals proteins that are altered in a diet-induced diabetic state: a new method for detection of type 2 diabetes. Proteomics 7: 1140–1149, 2007 [DOI] [PubMed] [Google Scholar]
- 22. Lundby C, Robach P. Assessment of total haemoglobin mass: can it detect erythropoietin-induced blood manipulations? Eur J Appl Physiol 108: 197–200, 2009 [DOI] [PubMed] [Google Scholar]
- 23. Lundby C, Thomsen JJ, Boushel R, Koskolou M, Warberg J, Calbet JA, Robach P. Erythropoietin treatment elevates haemoglobin concentration by increasing red cell volume and depressing plasma volume. J Physiol 578: 309–314, 2007 [DOI] [PMC free article] [PubMed] [Google Scholar]
- 24. Nedelkov D. Population proteomics: investigation of protein diversity in human populations. Proteomics 8: 779–786, 2008 [DOI] [PubMed] [Google Scholar]
- 25. Pascual JA, Belalcazar V, de BC, Gutierrez R, Llop E, Segura J. Recombinant erythropoietin and analogues: a challenge for doping control. Ther Drug Monit 26: 175–179, 2004 [DOI] [PubMed] [Google Scholar]
- 26. Peeling P, Dawson B, Goodman C, Landers G, Wiegerinck ET, Swinkels DW, Trinder D. Cumulative effects of consecutive running sessions on hemolysis, inflammation and hepcidin activity. Eur J Appl Physiol 106: 51–59, 2009 [DOI] [PubMed] [Google Scholar]
- 27. Peeling P, Dawson B, Goodman C, Landers G, Wiegerinck ET, Swinkels DW, Trinder D. Training surface and intensity: inflammation, hemolysis, and hepcidin expression. Med Sci Sports Exerc 41: 1138–1145, 2009 [DOI] [PubMed] [Google Scholar]
- 28. Qiu L, List EO, Kopchick JJ. Differentially expressed proteins in the pancreas of diet-induced diabetic mice. Mol Cell Proteomics 4: 1311–1318, 2005 [DOI] [PubMed] [Google Scholar]
- 29. Quaye IK. Haptoglobin, inflammation and disease. Trans R Soc Trop Med Hyg 102: 735–742, 2008 [DOI] [PubMed] [Google Scholar]
- 30. Richalet JP, Souberbielle JC, Antezana AM, Dechaux M, Le Trong JL, Bienvenu A, Daniel F, Blanchot C, Zittoun J. Control of erythropoiesis in humans during prolonged exposure to the altitude of 6,542 m. Am J Physiol Regul Integr Comp Physiol 266: R756–R764, 1994 [DOI] [PubMed] [Google Scholar]
- 31. Ross JH, Attwood EC. Severe repetitive exercise and haematological status. Postgrad Med J 60: 454–457, 1984 [DOI] [PMC free article] [PubMed] [Google Scholar]
- 32. Sackmann-Sala L, Ding J, Frohman LA, Kopchick JJ. Activation of the GH/IGF-1 axis by CJC-1295, a long-acting GHRH analog, results in serum protein profile changes in normal adult subjects. Growth Horm IGF Res 19: 471–477, 2009 [DOI] [PMC free article] [PubMed] [Google Scholar]
- 33. Savourey G, Launay JC, Besnard Y, Guinet A, Bourrilhon C, Cabane D, Martin S, Caravel JP, Pequignot JM, Cottet-Emard JM. Control of erythropoiesis after high altitude acclimatization. Eur J Appl Physiol 93: 47–56, 2004 [DOI] [PubMed] [Google Scholar]
- 34. Schumacher YO, Schmid A, Konig D, Berg A. Effects of exercise on soluble transferrin receptor and other variables of the iron status. Br J Sports Med 36: 195–199, 2002 [DOI] [PMC free article] [PubMed] [Google Scholar]
- 35. Thomsen JJ, Rentsch RL, Robach P, Calbet JA, Boushel R, Rasmussen P, Juel C, Lundby C. Prolonged administration of recombinant human erythropoietin increases submaximal performance more than maximal aerobic capacity. Eur J Appl Physiol 101: 481–486, 2007 [DOI] [PubMed] [Google Scholar]
- 36. Tolosano E, Altruda F. Hemopexin: structure, function, regulation. DNA Cell Biol 21: 297–306, 2002 [DOI] [PubMed] [Google Scholar]
- 37. Wenger RH, Rolfs A, Marti HH, Bauer C, Gassmann M. Hypoxia, a novel inducer of acute phase gene expression in a human hepatoma cell line. J Biol Chem 270: 27865–27870, 1995 [DOI] [PubMed] [Google Scholar]
- 38. Yuan Q, Fontenele-Neto JD, Fricker LD. Effect of voluntary exercise on genetically obese Cpefat/fat mice: quantitative proteomics of serum. Obes Res 12: 1179–1188, 2004 [DOI] [PubMed] [Google Scholar]