Abstract
Objectives:
To identify genomic regions associated with fasting plasma lipid profiles, insulin, glucose, and glycosylated hemoglobin in a Yup’ik study population, and to evaluate whether the observed associations between genetic factors and metabolic traits were modified by dietary intake of marine derived omega-3 polyunsaturated acids (n-3 PUFA).
Methods:
A genome-wide linkage scan was conducted among 982 participants of the Center for Alaska Native Health Research study. n-3 PUFA intake was estimated using the nitrogen stable isotope ratio (δ15N) of erythrocytes. All genotyped SNPs located within genomic regions with LOD scores > 2 were subsequently tested for individual SNP associations with metabolic traits using linear models that account for familial correlation as well as age, sex, community group and n-3 PUFA intake. Separate linear models were fit to evaluate interactions between the genotype of interest and n-3 PUFA intake.
Results:
We identified several chromosomal regions linked to serum apolipoprotein A2, high density lipoprotein-, low density lipoprotein-, and total cholesterol, insulin, and glycosylated hemoglobin. Genetic variants found to be associated with total cholesterol mapped to a region containing previously validated lipid loci on chromosome 19, and additional novel peaks of biological interest were identified at 11q12.2-11q13.2. We did not observe any significant interactions between n-3 PUFA intake, genotypes, and metabolic traits.
Conclusions:
We have completed a whole genome linkage scan for metabolic traits in Native Alaskans, confirming previously identified loci, and offering preliminary evidence of novel loci implicated in chronic disease pathogenesis in this population.
Keywords: Alaska Native, metabolism, multi-point linkage genome scan
The prevalence of type 2 diabetes (T2D) in Alaska Native communities has historically been lower than the general US population, although the specific genetic and environmental factors that underlie these statistics remain poorly characterized. Accumulating evidence suggests that elements of the traditional diet such as omega-3 polyunsaturated fatty acids (n-3 PUFA) and low carbohydrate content (Naylor et al., 2003) may contribute to the low T2D prevalence in these communities. More recently, Alaska Native people have experienced a more dramatic rise in T2D burden than other Native groups, with the age-adjusted prevalence increasing from 17.3/1,000 in 1985 to 47.6/1,000 (Narayanan et al., 2010). This increase may be attributed to increased awareness, improved access to healthcare, decreased overall mortality rates, a change in diagnostic criteria in 1997, as well as nutritional and lifestyle transitions (Naylor et al., 2003). Moreover, the effects of the changing diet on chronic metabolic disease risk may be mediated by genetic factors that are unique to isolated populations (Lemas et al., 2013).
Current understanding of the genetics of metabolic traits among circumpolar populations is limited in comparison to other ethnic groups, highlighting the need for comprehensive scans to identify the major susceptibility loci. Two recent candidate gene studies, conducted among the Canadian Inuit (Rudkowska et al., 2013) and Yup’ik people living in Southwest Alaska (Lemas et al., 2012) suggested that consumption of marine-derived n-3 PUFA may influence lipid traits through interactions with common genetic variants implicated in metabolic pathways. However, few studies have comprehensively examined the role of genes or gene-diet interactions in the etiology of metabolic traits in communities with a historically low prevalence of T2D, despite ample evidence of their etiologic relevance in other populations (Ntzani and Kawoura, 2012; Franks et al., 2007; Cole et al., 2005).
Rudkowska et al. showed that the minor allele frequency distribution of several metabolism-related genetic markers differs markedly between the Inuit and Caucasians, and other studies of complex traits (Hegele et al., 1997; Hegele et al., 1999) also suggest differences in susceptibility genes. To further elucidate these differences, the purpose of this study was to examine the genetic architecture of metabolic traits in a Yup’ik population using whole-genome linkage analysis, followed by targeted association testing for variants genotyped within the observed peaks. Additionally, this study investigated potential interactions of these loci with habitual intake of marine-derived n-3 PUFA.
MATERIALS AND METHODS
Participants
The Center for Alaska Native Health Research (CANHR) studies genetic, behavioral, and dietary risk factors underlying obesity and their relationship to diabetes and cardiovascular disease among the Yup’ik people (Mohatt et al., 2007). Recruitment of Yup’ik participants was initiated in 2003 and continues in 11 Southwest Alaska communities. All residents are invited to participate, with the study sample age distribution reflecting that of all eligible participants as summarized by the 2000 U.S. census. The analyses in this report were performed on 1136 non-pregnant Yup’ik people that were ≥14 years old at the time of enrollment.
Ethics
Participants provided written informed consent using protocols approved by the University of Alaska Institutional Review Board, the National and Alaska Area Indian Health Service Institutional Review Boards, and the Yukon Kuskokwim Human Studies Committee.
Measurements of metabolic traits
A radioimmunoassay kit was used to assay fasting insulin (FI) with an I125-iodinated insulin tracer, anti-human insulin specific antibody, and human insulin standards (Linco Research, St Charles, MO, USA), for which the intra- and inter-assay variations were respectively 5.8% and 10.2%. A Cholestech LDX analyzer was used to measure fasting glucose (FG), and glycosylated hemoglobin (HbA1c) was quantified with a DCA 2000+ analyzer (Bayer AG, Leverkusen, Germany). Lipid profiles, specifically low-density lipoprotein (LDL) cholesterol, high-density lipoprotein (HDL) cholesterol, very low-density lipoprotein (VLDL) cholesterol, total cholesterol, triglycerides (TG), and apolipoproteins A1 (ApoA1) and A2 (ApoA2) were measured as described in previous publications from our group (Lemas et al., 2012; Boyer et al., 2007).
Dietary n-3 PUFA intake measurements
The nitrogen stable isotope ratio (δ15N) of red blood cells (RBC) was used to assess n-3 PUFA intake as previously described (O’Brien et al., 2009). RBC aliquots were autoclaved for 20 minutes at 121° C to destroy blood-borne pathogens, and samples were weighed into 3.5 × 3.75 mm tin capsules and freeze dried to a final mass of 0.2 - 0.4 mg. Samples were analyzed at the Alaska Stable Isotope Facility by continuous-flow isotope ratio mass spectrometry, using a Costech ECS4010 Elemental Analyzer (Costech Analytical Technologies, Valencia, CA, USA) interfaced to a Finnigan Delta Plus XP isotope ratio mass spectrometer via the Conflo III interface (Thermo-Finnigan Inc., Bremen, Germany). The conventional method of expressing nitrogen isotope ratios at natural abundance is in “permil” (%0) abundance of 15N relative to atmospheric nitrogen (15N/14Natm = 0.0036765), as follows:
δ15N = [(15N/14Nsample – 15N/14Natm)/( 15N/14Natm)] · 1000%0. Laboratory reference materials (peptone, δ15N = 7.00) were concurrently prepared and run to assess analytical accuracy and precision; these were analyzed after every eighth sample and estimated δ15N at 7.0 ± 0.2%0 (mean ± SD). The range of isotopic variation in the data (9%0) was very large relative to analytical precision (0.2%0). To avoid undue influence of extreme values and allow for a non-linear relationship suggested by prior evidence, this variable was modeled as a categorical variable, defined by the quartiles of the δ15N measurements. We identified the quartiles of values of δ15N, and assigned values to three dichotomous variables as follows. Individuals with values below the first quartile were assigned (0,0,0) to the three variables. Those with values at least equal to the first quartile but below the second were given the values (1,0,0). Those with values at least equal to the second quartile but below the third were given the values (1,1,0). Finally, those with values at least equal to the third quartile were given the values (1,1,1).
Genotyping
Participants were genotyped for 6090 single nucleotide polymorphisms (SNPs) from the Illumina’s Linkage-IV panel (Illumina, San Diego, CA, USA) at the Center for Inherited Disease Research (CIDR). The Illumina Linkage-12 panel spans the entire genome with an average genetic distance of 0.58 cM and 441 kb physical map spacing.
Pedigree analysis
Pedigree data was extracted from the Progeny database (Progeny Software LLC, South Bend, IN, USA), and merged as appropriate into larger pedigrees using the program Pedmerge Pedmerge allows for accurate and efficient merger of separately ascertained pedigrees that belong to the same extended family (Plaetke and Balbi, 2010). The 1136 individuals included in this study were members of 63 independent pedigrees. Among these, 21 pedigrees contained at least two individuals and 42 individuals were singletons; both categories were subsequently excluded from the linkage analyses. The majority of the genotyped participants (n=1037) were members of the single largest pedigree, which was too large to analyze with standard frequentist methods. For this reason, that pedigree was cut using Pedstr into 113 smaller, independent sub-pedigrees each containing between 2 and 22 genotyped participants. Pedstr is an automatic algorithm that splits large pedigrees into fragments of specified size, which can subsequently be used in multi-point linkage analysis (Kirichenko et al., 2009). Of the total 938 genotyped participants in these cut pedigrees, 52 were repeated once or twice (e.g. as a founder in one pedigree and a child in another) to maintain close relationships; 883 of the original genotyped participants were retained. The remaining 154 genotyped individuals were not closely related to any of the retained participants. A summary of the relative pairs included in the analysis is given in Table 1.
Table 1.
Number of pairs of study participants by degree of relationship.
| Degree of Relation | Original Large | Resulting Cut | Remaining Small |
|---|---|---|---|
| Pedigree | Pedigrees | pedigrees | |
| First | 1149 | 1040 | 24 |
| Second | 1784 | 1011 | 13 |
| Third | 2363 | 777 | 2 |
| Fourth | 2489 | 399 | 2 |
| Fifth | 2236 | 121 | 1 |
| Sixth | 1533 | 31 | - |
| Seventh | 999 | 18 | - |
| Eighth | 447 | 4 | - |
| Ninth | 88 | 3 | - |
Quality control of phenotypic and genotypic data
Simple linear models were fitted to outcome variables using all available non-genetic covariates, and descriptive statistics of the residuals were examined using R software (v2.10.1, R Development Core, 2009). If necessary, traits were transformed using either logarithmic (for HDL and TG) or Box-Cox approaches (Box and Cox, 1964) (for ApoA1, ApoA2, FG, FI, HbA1C) to reduce the residual kurtosis of the traits and avoid artificially inflated evidence for linkage (Blangero et al., 2001). Estimates of heritability and residual kurtosis for raw or appropriately transformed traits are given in Table 2. All traits exhibited statistically significant heritability estimates. For the traits that still had residual kurtosis above 0.8 (ApoA2, FG, HbA1c, FI, and untransformed LDL), subsequent linkage analyses used the t-distribution option to control type I error.
Table 2.
Heritability estimates of metabolic trait measurements.1
| Residual Kurtosis | h2 | P | |
|---|---|---|---|
| ApoA1 | 0.03 | 0.59 | 2×10⁻²² |
| ApoA2 | 1.65 | 0.42 | 1×10⁻⁹ |
| Fasting glucose | 1.65 | 0.24 | 3×10⁻⁵ |
| HbA1C | 1.39 | 0.31 | 6×10⁻⁷ |
| HDL cholesterol | 0.13 | 0.44 | 7×10⁻¹⁴ |
| Fasting insulin | 2.49 | 0.15 | 0.006 |
| LDL cholesterol | 0.79 | 0.40 | 2×10⁻¹¹ |
| Total cholesterol | 0.63 | 0.32 | 7×10⁻⁹ |
| Triglycerides | 0.10 | 0.45 | 3×10⁻¹³ |
| VLDL cholesterol | 0.08 | 0.43 | 9×10⁻¹³ |
ApoA1, apolipoprotein A1; ApoA2, apolipoprotein A2; HbA1C, glycosylated hemoglobin; HDL, high density lipoprotein; LDL, low density lipoprotein; VLDL, very low density lipoprotein
The genotypic data was subject to several quality control measures prior to whole-genome linkage analysis. First, Pedcheck was used to exclude SNPs that were not consistent with Mendelian segregation. Pedcheck is a program designed to check pedigree files to identify genotype incompatibilities in linkage analysis (O’Connell and Weeks, 1998). Second, SNPs that deviated from Hardy-Weinberg equilibrium (HWE) proportions (p<0.0001) were identified using an algorithm that considers familial relationships (Bourgain et al., 2004) and excluded from the analysis. Finally, the program Hclust was used to select a subset of SNPs with low pairwise linkage disequilibrium (LD) to further reduce inflation of linkage evidence. Hclust performs hierarchical cluster analysis to identify the most parsimonious set of SNPs for further analysis based on linkage disequilibrium (Rinaldo et al., 2005)
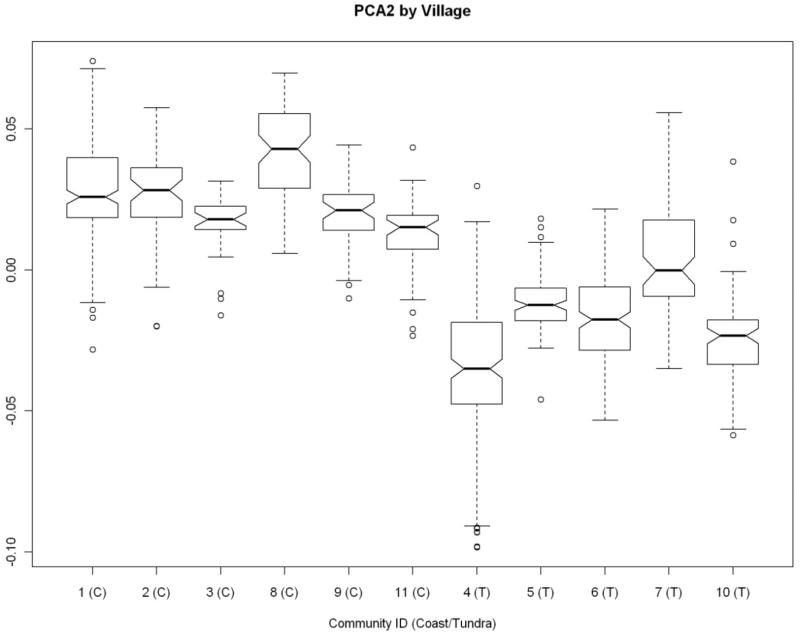
All genotypes that passed the above quality checks, including those excluded by the Hclust algorithm, were used to ascertain cryptic population substructure using the PCA (Principal Components of Analysis) program from the Eigenstrat package. Eigenstrat was developed to detect and correct for population stratification in genome-wide association studies (Price et al., 2006). The computed values of the each component were grouped according to the villages of residence. Although the first component had no obvious systematic structure, the second component naturally split the genotyped sample into two groups, consistent with proximity of the villages to the coast. This observation was used to define “community group” as a dichotomous covariate included in subsequent analyses. The distribution of the second principal component of ancestry is shown as a box plot in Figure 1. Communities 1, 2, 3, 8, 9, and 11 (group 1) are located closer to the coast, while the remaining communities (group 2) are considered upriver (tundra) communities.
Figure 1.
Distribution of second principal component of ancestry by village.
Linkage analysis
SOLAR (Sequential Oligogenic Linkage Analysis Routines) was used to estimate the heritability and to test for whole-genome linkage. SOLAR is an extensive software package for genetic variance components analysis, including linkage (Almasy and Blangero, 1998). The variance component approach implemented in SOLAR requires an estimate of locus specific allelic sharing identical by descent (IBD), which was computed using MERLIN (Multipoint Engine for Rapid Likelihood Inference). MERLIN uses the Lander-Green approach to perform multipoint linkage analysis(Abecasis et al., 2002). All models run in SOLAR included age, sex, community group, and n-3 PUFA intake. In order to allow for non-linear effects of continuous covariates (age and n-3 PUFA intake) without undue influence of extreme values, both of these covariates were included in the models as three dichotomous variables to indicate quartiles.
Association analysis
All genotyped SNPs under linkage peaks identified in the linkage analysis that exceeded a LOD score of 2 and satisfied HWE constraints were tested for association with the traits using genetic association program ASSOC based on methods developed in George and Elston (1987) and Elston et al. (1992), which models the full familial correlation structure of the pedigree. ASSOC is a part of the Statistical Analysis for Genetic Epidemiology (S.A.G.E) suite of software, and is used in pedigree studies to estimate associations between traits and covariates as well as familial correlations, or heritability. The ASSOC program is able to handle arbitrary pedigrees, so the original pedigree was used rather than the pedigree processed by Pedstr (Kirichenko et al., 2009). All association models fit using ASSOC included the same non-genetic covariates that were used for the linkage analysis: sex, age, community group, and δ15N quartiles. For each SNP, three models were run: a baseline model containing only non-genetic covariates; a model containing non-genetic covariates and the SNP genotype as an additive effect; and a model containing non-genetic covariates, SNP genotype as an additive effect, and interaction between SNP effect and δ15N quartiles. Likelihood ratio tests were used to compare the models.
To correct for multiple testing in the association analyses, the effective number of SNPs was determined using spectral decomposition of the correlation matrix (Li and Ji, 2005; Nyholt, 2004).
RESULTS
Clinical and demographic characteristics of the study population are presented by gender in Table 3. Of 982 individuals in the study, approximately 3% (n=29) had diagnosed T2D. Women represented slightly more than half of the overall study population, although that proportion was higher (57%) in the upriver communities. Consistent with a recent report, Yup’ik women had a higher intake of n-3 PUFAs as ascertained by δ15N (Nash et al., 2012), as well as higher average fasting glucose, HbA1c and insulin relative to Yup’ik men. While circulating triglycerides, LDL, and VLDL cholesterol did not vary by gender, Yup’ik women had higher levels of total and HDL cholesterol as well as ApoA1, and Yup’ik men had higher levels of ApoA2.
Table 3.
Descriptive characteristics of the study population (n=982).
| Men (n=454)1 | Women (n=528)1 | P | |
|---|---|---|---|
| Age, years | 36 (35−38) | 38 (37−40) | 0.072 |
| Community group, n | |||
| Coastal | 214 (51) | 204 (49) | 0.633 |
| Upriver | 240 (43) | 324 (57) | 0.00043 |
| δ15N, ‰ | 8.8 (8.7-8.9) | 9.2 (9.1-9.3) | 0.00012 |
| ApoA1, mg/dL | 167 (117-217) | 177 (128-225) | <0.00012 |
| ApoA2, mg/dL | 27 (18-37) | 26 (17-36) | 0.0012 |
| Fasting glucose, mg/dL | 97 (75-118) | 95 (74-115) | 0.0062 |
| HbA1C, mmol/mol | 37.7 (29.9-44.8) | 37.7 (28.5-46.1) | 0.042 |
| HDL cholesterol, mg/dL | 54 (33-89) | 62 (37-105) | <0.00012 |
| Fasting insulin, mU/L | 16 (4-28) | 19 (5-34) | <0.00012 |
| LDL cholesterol, mg/dL | 137 (58-216) | 136 (63-209) | 0.772 |
| Total cholesterol, mg/dL | 210 (115-304) | 217 (129-306) | 0.012 |
| Triglycerides, mg/dL | 121 (35-207) | 115 (38-192) | 0.432 |
| VLDL cholesterol, mg/dL | 24 (7-42) | 23 (8-39) | 0.572 |
| Body mass index, kg/m2 | 26 (18-36) | 28 (18-44) | <0.00012 |
| Body fat, % | 21 (6-36) | 35 (18-53) | <0.00013 |
| Abdominal skinfold thickness, mm | 15 (4-62) | 29 (12-72) | <0.00012 |
Mean (95% confidence interval) for continuous variables or n (% total) for categorical variables
P calculations are based on the 2-sample t-test, not accounting for the family structure.
P calculations are based on the binomial distribution, not accounting for the family structure.
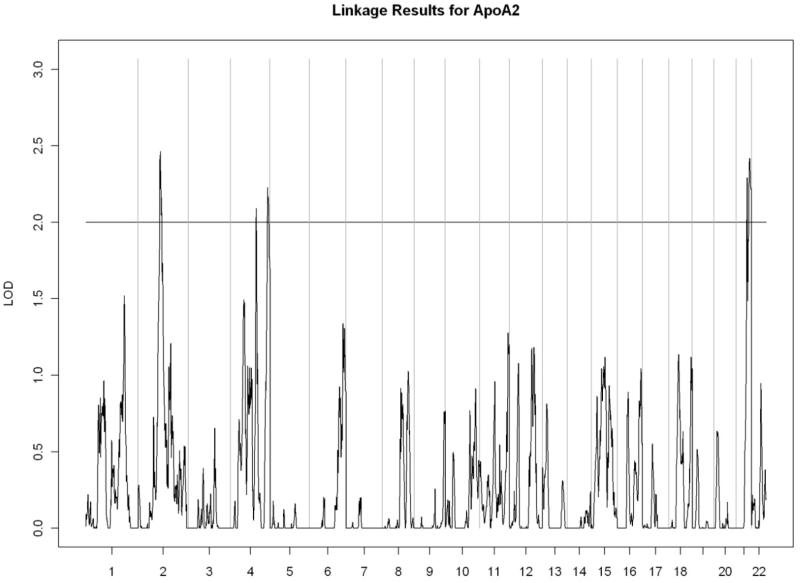
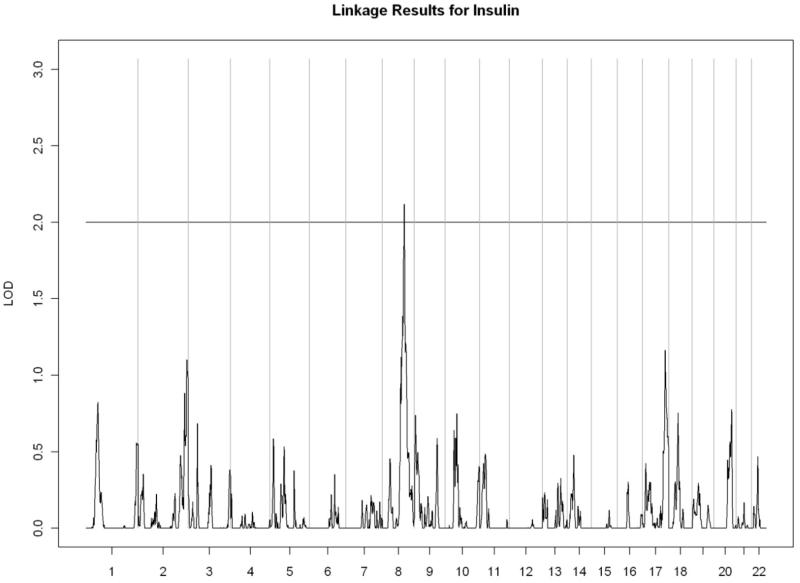
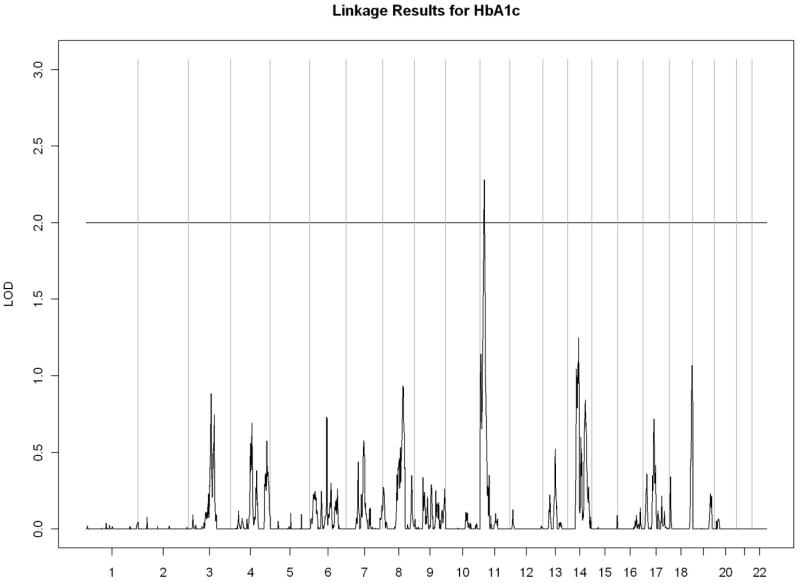
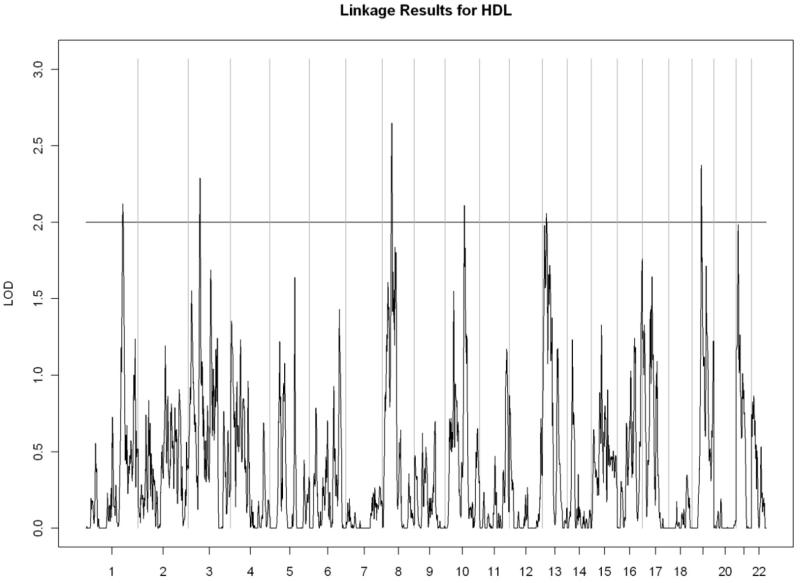
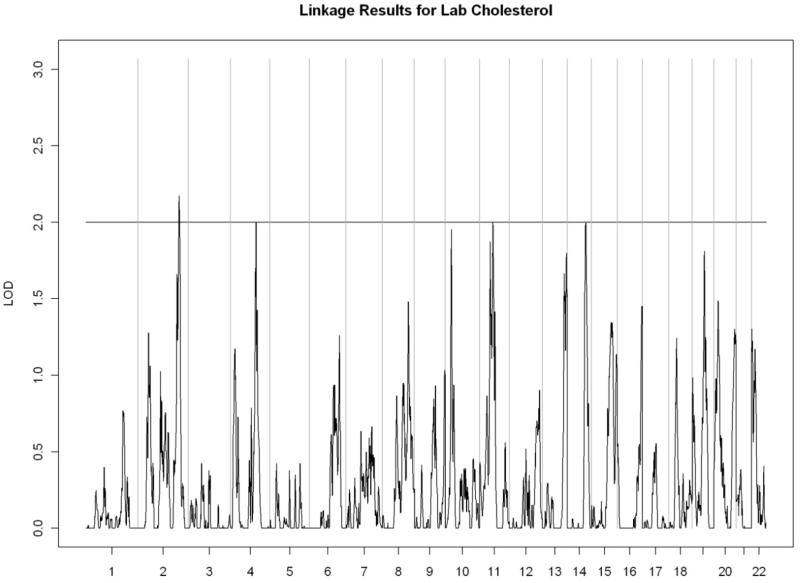
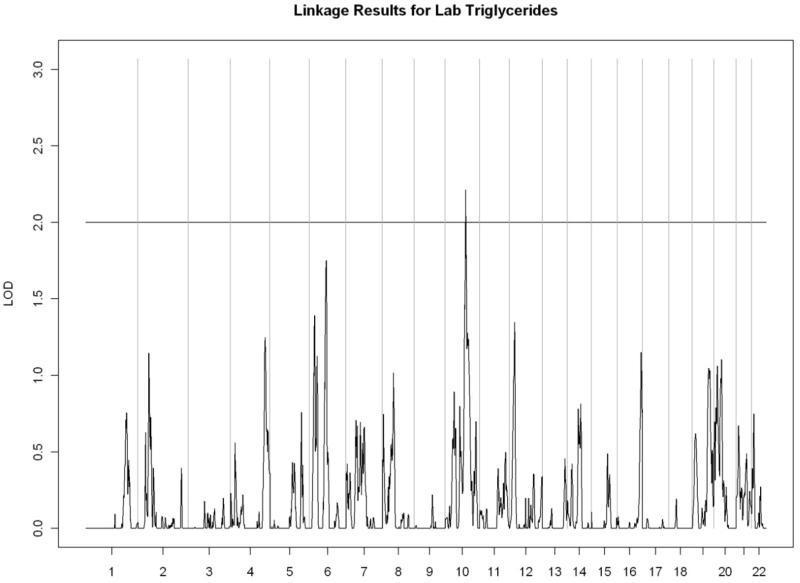
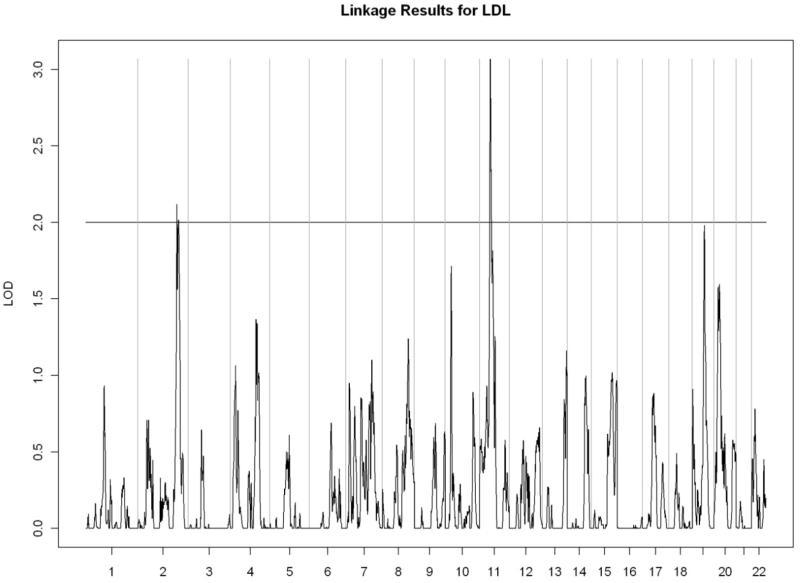
All linkage findings that exceeded the cutoff LOD score of 2 are presented as genome-wide plots in Figure 2 and the corresponding linkage peaks are summarized in Table 4. In general, our whole genome linkage analyses showed stronger evidence for genetic linkage with serum lipids relative to diabetes-related traits (FI, FG, or HbA1C). Specifically, we found a region on chromosome 11 (11p13-11q13.1) with the most robust evidence for linkage with LDL cholesterol (LOD score=3.02) that overlapped with the linkage peak for total cholesterol (LOD score= 2.00). Additionally, we observed a region of interest on chromosome 10 (10q23.1-10q24.1) which contained linkage peaks for HDL cholesterol (LOD score= 2.72) and triglycerides (LOD= 2.21). We did not detect chromosomal regions linked with ApoA1 or VLDL cholesterol.
Figure 2.
Genome-wide linkage scans for selected metabolic traits in Yup’ik people. The X-axis shows the chromosomal location, and the Y-axis displays the LOD score.
A) Apolipoprotein A2
B) Fasting insulin
C) Glycosylated hemoglobin
D) High-density lipoprotein cholesterol
E) Total cholesterol
F) Triglycerides
G) Low-density lipoprotein cholesterol
Table 4.
Linkage peaks exceeding LOD score of 2.
| Peak | ||||||
|---|---|---|---|---|---|---|
| Chromosome | Start | End | ||||
| LOD | Start SNP | End SNP | ||||
| Bands | Position1 | Position1 | ||||
| Score | ||||||
| ApoA2 | ||||||
| 2p11.2-2q14.2 | 2.46 | rs1015117 | 86,594,374 | rs280192 | 121,453,668 | |
| 4q28.3-4q31.21 | 2.09 | rs1992695 | 138,031,197 | rs336332 | 143,249,272 | |
| 4q35.1-4q35.2 | 2.23 | rs1158465 | 186,706,487 | rs1915852 | 191,026,530 | |
| 21q22.3 | 2.42 | rs4920106 | 42,748,803 | rs2256207 | 46,886,508 | |
| Fasting Insulin | ||||||
| 8q22.3-8q23.3 | 2.12 | rs718262 | 103,045,180 | rs1353277 | 116,148,616 | |
| HbA1C | ||||||
| 11p15.4-11p15.1 | 2.28 | rs1425151 | 10,644,793 | rs214101 | 17,245,930 | |
| HDL cholesterol | ||||||
| 1q31.3-1q32.1 | 2.12 | rs1538686 | 194,664,442 | rs4351714 | 201,027,281 | |
| 3p22.3-3p22.1 | 2.42 | rs4796 | 32,498,781 | rs1996562 | 40,110,750 | |
| 8p21.2-8p12 | 2.65 | rs310319 | 23,746,576 | rs8685 | 33,477,812 | |
| 10q23.1-10q23.2 | 2.72 | rs720262 | 82,462,543 | rs10887683 | 88,706,557 | |
| 13q12.13-13q12.3 | 2.06 | rs306395 | 25,348,564 | rs717651 | 30,070,594 | |
| 19p13.11-19q12 | 2.37 | rs7250192 | 18,584,325 | rs2194198 | 36,728,531 | |
| LDL cholesterol | ||||||
| 2q34-2q36.1 | 2.12 | rs1396828 | 210,753,727 | rs1463991 | 221,411,990 | |
| 11p13-11q13.1 | 3.02 | rs2045040 | 34,575,332 | rs633727 | 64,416,000 | |
| Total cholesterol | ||||||
| 2q35-2q36.1 | 2.27 | rs207928 | 216,744,686 | rs348971 | 222,626,435 | |
| 4q28.3-4q31.1 | 2.00 | rs13103412 | 136,871,469 | rs6840033 | 141,448,311 | |
| 11q12.2-11q13.2 | 2.00 | rs1530354 | 59,957,022 | rs1695 | 67,109,265 | |
| Triglycerides | ||||||
| 10q23.1-10q23.33 | 2.21 | rs489466 | 84,638,946 | rs2298037 | 96,736,068 | |
Position was determined using hg18 as the reference genome.
Table 5 presents the results of genetic association testing for individual SNPs located in regions identified by the genome-wide linkage scan. We identified four SNPs that were nominally (P<0.05) associated with HDL cholesterol (P-values ranging from 0.0003 to 0.002), two that were associated with total cholesterol (P-values <0.006), and one associated with ApoA2 (P=0.0009). However, the two markers on chromosome 11 that were significant hits for total cholesterol were determined to be in perfect LD (r2=1) by the SNAP algorithm (Broad Institute, Cambridge, MA). As shown in Table 5, we did not detect SNPs associations with metabolic traits that were modified by n-3 PUFA intake.
Table 5.
Significant associations between single nucleotide polymorphisms within linkage peaks and metabolic traits in the study population.
| Trait | SNP | Chromosome | Gene | P (Add)1 | P (Full)2 | P(Int) 3 |
|---|---|---|---|---|---|---|
| ApoA2 | ||||||
| rs1317423 | 4 | -- | 0.0009 | 0.009 | 0.48 | |
| HDL | ||||||
| rs713144 | 3 | -- | 0.002 | 0.01 | 0.38 | |
| rs2475793 | 10 | NRG3 | 0.0003 | 0.006 | 0.63 | |
| rs535534 | 13 | POLR1D | 0.001 | 0.005 | 0.24 | |
| rs2194198 | 19 | -- | 0.0009 | 0.001 | 0.50 | |
| Total cholesterol | ||||||
| rs728919 | 11 | NAA40 | 0.003 | 0.06 | 0.97 | |
| rs562865 | 11 | MACROD1 | 0.003 | 0.06 | 0.94 | |
Model included sex, age, n-3 PUFA intake, community group, and additive genetic term.
Model included all terms listed above plus an interaction between the additive genotype and n-3 PUFA intake.
P-value from the likelihood ratio test for interaction between the additive genotype and n-3 PUFA intake.
DISCUSSION
In this study, we conducted a whole-genome linkage analysis in a Yup’ik population with a historically low prevalence of T2D and identified chromosomal regions associated with meatbolic traits. In addition to observing genetic linkage to several known loci associated with plasma lipid/lipoprotein parameters on chromosome 19, these data demonstrate preliminary evidence of novel candidate genetic determinants of several lipid traits. Of particular biological interest is the high LD region on chromosome 11 containing MACROD1 and NAA40, which was found to be associated with measurements of total cholesterol in this sample of Yup’ik people.
MACROD1, also known as LRP16, is a gene with evidence of pleiotropic metabolic effects. A recent large-scale meta-analysis of genome-wide association studies (Winkler et al., 2012) has identified a locus in that gene as a sex-specific determinant of obesity-related traits like the waist-to-hip ratio, showing a robust association in women but not men. Given that women in Arctic communities have some of the highest visceral obesity rates in the world (Risica et al., 2000; Voruganti et al., 2006), MACROD1/LRP16 variation in this population may be an important contributor to health outcomes. Additionally, MACROD1/LRP16 has been shown to activate nuclear factor κB (Wu et al., 2011), a key inflammatory component of the pathogenesis of atherosclerosis (Kutuk and Basaga, 2003) that can be influenced by environmental factors such as dietary cholesterol or statin therapy (Jasinska et al., 2007). It is plausible that mutations in MACROD1/LRP1 that result in the decreased expression of these genes have protective cardiometabolic effects in this population.
The quantitative trait loci (QTL) for HDL cholesterol on chromosome 19 are important for the interpretation of the study results. First, they are confirmatory linkage results for this study, as the identified genomic regions contain several loci—located in CILP2 for HDL cholesterol and APOE/FLJ36070 for total cholesterol—that have been shown to be robustly associated with lipid levels in a variety of populations (Teslovich et al., 2010; Yan et al., 2011; Zhou et al., 2011). Additionally, they are consistent with data from another coastal Alaska Native study population, the Genetics of Coronary Artery Disease in Alaska Natives (GOCADAN) study (Cole et al., 2005), which identified a QTL for HDL levels (LOD=3.9) and suggestive evidence for linkage of LDL size (LOD=2.5) and HDL size (LOD=2.3) to the same genetic region. Cole et al. postulate that the LDL receptor gene (LDLR) represents a strong positional candidate for this QTL, as it is located 1.5 Mbp from the peak evidence of linkage. Second, the observed peaks are adjacent to the region containing QTL for several obesity-related anthropometric traits found the GOCADAN study (Voruganti et al., 2011). This observation is consistent with another set of data from the GOCADAN population (Voruganti et al., 2006) which suggests that cholesterol phenotypes and obesity-related factors have shared genetic determinants in Alaska Native people. Future studies of putative genetic associations with these phenotypes should account for such pleiotropic effects to improve estimate validity and precision (Park et al., 2011).
Dietary n-3 PUFA intake did not modify the effect of genetic polymorphisms in the regions of interest on phenotypes in this Yup’ik study population. Despite the biological plausibility of such interactions, the null results of the interaction models do not support the role of long-term PUFA in modifying the observed genotype-phenotype associations. However, a recent study from the same population established that n-3 PUFAs may mediate the effect of obesity-related SNPs on adiposity (Lemas et al., 2013).
These findings must be interpreted in light of several important considerations. First, metabolic traits are complex and heterogeneous phenotypes that are likely to be influenced by a combination of both rare and common genetic variants and multiple dietary and lifestyle effects. While linkage analysis can efficiently detect families enriched with rare biologically relevant polymorphisms, this method may not have sufficient power to detect common variants of small or moderate effect size (Risch and Merikangas, 1996). To address that limitation, we supplemented our whole genome linkage analysis by testing individual SNPs within the linkage panel for association with lipid and diabetes-related traits. Notably, several linkage peaks identified in our study were concordant with results from genome-wide association studies in other populations (Teslovich et al., 2010). Second, the genetic regions identified in this study represent preliminary evidence, which should be independently replicated and followed with with functional genomic analyses in other populations with low T2D prevalence. Finally, the specific SNPs that were found to be significantly associated with metabolic traits may not represent the true susceptibility variant but may be in LD with the functional polymorphism, precluding any causal interpretation of these findings.
In conclusion, this study presents preliminary evidence of linkage between several genomic regions and metabolic traits in a Yup’ik population with a historically low prevalence of T2D. These results support the previous findings of lipid loci on chromosome 19 and highlight the potential importance of MACROD1 to cardiometabolic health. Upon successful validation, these findings may serve to elucidate the heritable determinants of chronic disease in these genetically isolated, understudied communities and inform future research and clinical efforts.
ACKNOWLEDGMENTS
We thank the community field research assistants for helping with the study recruitment and data collection, and all study participants and their communities for welcoming and teaching our research team so much about the Yup'ik way of life. Genotyping services were provided by the Center for Inherited Disease Research (CIDR). CIDR is fully funded through a federal contract from the National Institutes of Health to The Johns Hopkins University, contract No. HHSN268200782096C.
Funding: NIH DK074842, RR016430, and K01DK080188
LITERATURE CITED
- Abecasis GR, Cherny SS, Cookson WO, Cardon LR. Merlin--rapid analysis of dense genetic maps using sparse gene flow trees. Nat Genet. 2002;30:97–101. doi: 10.1038/ng786. [DOI] [PubMed] [Google Scholar]
- Aerts S, Vilain S, Hu S, Tranchevent L-C, Barriot R, Yan J, Moreau Y, Hassan BA, Quan XJ. Integrating computational biology and forward genetics in Drosophila. PLoS Genet. 2009;5:e1000351. doi: 10.1371/journal.pgen.1000351. [DOI] [PMC free article] [PubMed] [Google Scholar]
- Almasy L, Blangero J. Multipoint quantitative-trait linkage analysis in general pedigrees. Am J Hum Genet. 1998;62:1198–1211. doi: 10.1086/301844. [DOI] [PMC free article] [PubMed] [Google Scholar]
- Blangero J, Williams JT, Almasy L. Variance component methods for detecting complex trait loci. Adv Genet. 2001;42:151–81. doi: 10.1016/s0065-2660(01)42021-9. [DOI] [PubMed] [Google Scholar]
- Bourgain C, Abney M, Schneider D, Ober C, McPeek MS. Testing for Hardy-Weinberg equilibrium in samples with related individuals. Genetics. 2004;168:2349–2361. doi: 10.1534/genetics.104.031617. [DOI] [PMC free article] [PubMed] [Google Scholar]
- Box GEP, Cox DR. An Analysis of Transformations. J Royal Stat Soc Ser B. 1964;26:211–243. [Google Scholar]
- Boyer BB, Mohatt GV, Plaetke R, Herron J, Stanhope KL, Stephensen C, Havel PJ, CANHR Project Team Metabolic syndrome in Yup’ik Eskimos: the Center for Alaska Native Health Research (CANHR) Study. Obesity (Silver Spring) 2007;15:2535–2540. doi: 10.1038/oby.2007.302. [DOI] [PubMed] [Google Scholar]
- Chen J, Bardes EE, Aronow BJ, Jegga AG. ToppGene Suite for gene list enrichment analysis and candidate gene prioritization. Nucleic Acids Res. 2009;37:W305–311. doi: 10.1093/nar/gkp427. [DOI] [PMC free article] [PubMed] [Google Scholar]
- Cole SA, Laston S, Göring HHH, Diego VP, Dyer TD, Blangero J, Ebbesson S, Howard BV, MacCluer JW, Comuzzie AG. Linkage of lipoprotein phenotypes to chromosome 19p in Alaska Natives from the GOCADAN Study. Obes Res. 2005;13:A100. [Google Scholar]
- Elston RC, George VT, Severtson F. The Elston-Stewart algorithm for continuous genotypes and environmental factors. Hum Hered. 1992;42:16–27. doi: 10.1159/000154043. [DOI] [PubMed] [Google Scholar]
- Franks PW, Mesa JL, Harding AH, Wareham NJ. Gene-lifestyle interaction on risk of type 2 diabetes. Nut Metab Cardiovasc Dis. 2007;17:104–124. doi: 10.1016/j.numecd.2006.04.001. [DOI] [PubMed] [Google Scholar]
- George VT, Elston RC. Testing the association between polymorphic markers and quantitative traits in pedigrees. Genet Epidemiol. 1987;4:193–201. doi: 10.1002/gepi.1370040304. [DOI] [PubMed] [Google Scholar]
- Guberman JM, Ai J, Arnaiz O, Baran J, Blake A, Baldock R, Chelala C, Croft D, Cros A, Cutts RJ, Di Genova A, Forbes S, Fujisawa T, Gadaleta E, Goodstein DM, Gundem G, Haggarty B, Haider S, Hall M, Harris T, Haw R, Hu S, Hubbard S, Hsu J, Iyer V, Jones P, Katayama T, Kinsella R, Kong L, Lawson D, Liang Y, Lopez-Bigas N, Luo J, Lush M, Mason J, Moreews F, Ndegwa N, Oakley D, Perez-Llamas C, Primig M, Rivkin E, Rosanoff S, Shepherd R, Simon R, Skarnes B, Smedley D, Sperling L, Spooner W, Stevenson P, Stone K, Teague J, Wang J, Wang J, Whitty B, Wong DT, Wong-Erasmus M, Yao L, Youens-Clark K, Yung C, Zhang J, Kasprzyk A. BioMart Central Portal: an open database network for the biological community. Database (Oxford) 2011:bar041. doi: 10.1093/database/bar041. [DOI] [PMC free article] [PubMed] [Google Scholar]
- Hegele RA, Busch CP, Young TK, Connelly PW, Cao H. Mannose-binding lectin gene variation and cardiovascular disease in Canadian Inuit. Clin Chem. 1999;54:1283–1285. [PubMed] [Google Scholar]
- Hegele RA, Young TK, Connelly PW. Are Canadian Inuit at increased risk for coronary heart disease? J Mol Med. 1997;74:364–370. doi: 10.1007/s001090050122. [DOI] [PubMed] [Google Scholar]
- Jasinska M, Owczarek J, Orszulak-Michalak D. Statins a new insight into their mechanisms of action and consequent pleiotropic effects. Pharmacol Rep. 2007;59:483–499. [PubMed] [Google Scholar]
- Kirichenko AV, Belonogova NM, Aulchenko YS, Axenovich TI. PedStr software for cutting large pedigrees for haplotyping, IBD computation and multipoint linkage analysis. Ann Hum Genet. 2009;73:527–531. doi: 10.1111/j.1469-1809.2009.00531.x. [DOI] [PubMed] [Google Scholar]
- Köhler S, Bauer S, Horn D, Robinson PN. Walking the interactome for prioritization of candidate disease genes. Am J Hum Genet. 2008;82:949–958. doi: 10.1016/j.ajhg.2008.02.013. [DOI] [PMC free article] [PubMed] [Google Scholar]
- Kutuk O, Basaga H. Inflammation meets oxidation: NF-kappaB as a mediator of initial lesion development in atherosclerosis. Trends Mol Med. 2003;9:549–557. doi: 10.1016/j.molmed.2003.10.007. [DOI] [PubMed] [Google Scholar]
- Lemas DJ, Klimentidis YC, Wiener HW, O’Brien DM, Hopkins S, Allison DB, Fernandez JR, Tiwari HK, Boyer BB. Obesity polymorphisms identified in genome-wide association studies interact with n-3 polyunsaturated fatty acid intake and modify the genetic associations with adiposity phenotypes in Yup’ik people. Genes Nut. 2013. in press. [DOI] [PMC free article] [PubMed]
- Lemas DJ, Wiener HW, O’Brien DM, Hopkins S, Stanhope KL, Havel PJ, Allison DB, Fernandez JR, Tiwari HK, Boyer BB. Genetic polymorphisms in carnitine palmitoyltransferase 1A gene are associated with variation in body composition and fasting lipid traits in Yup’ik Eskimos. J Lipid Res. 2012;53:175–184. doi: 10.1194/jlr.P018952. [DOI] [PMC free article] [PubMed] [Google Scholar]
- Li J, Ji L. Adjusting multiple testing in multilocus analyses using the eigenvalues of a correlation matrix. Heredity. 2005;95:221–227. doi: 10.1038/sj.hdy.6800717. [DOI] [PubMed] [Google Scholar]
- Mohatt GV, Plaetke R, Klejka J, Luick B, Lardon C, Bersamin A, Hopkins S, Dondanville M, Herron J, Boyer B, Center for Alaska Native Health Research The Center for Alaska Native Health Research Study: a community-based participatory research study of obesity and chronic disease-related protective and risk factors. Int J Circumpolar Health. 2007;66:8–18. doi: 10.3402/ijch.v66i1.18219. [DOI] [PubMed] [Google Scholar]
- Narayanan ML, Schraer CD, Bulkow LR, Koller KR, Asay E, Mayer AM, Raymer TW. Diabetes prevalence, incidence, complications and mortality among Alaska Native people 1985-2006. Int J Circumpolar Health. 2010;69:236–252. doi: 10.3402/ijch.v69i3.17618. [DOI] [PubMed] [Google Scholar]
- Nash SH, Bersamin A, Kristal AR, Hopkins SE, Church RS, Pasker RL, Luick BR, Mohatt GV, Boyer BB, O’Brien DM. Stable nitrogen and carbon isotope ratios indicate traditional and market food intake in an indigenous circumpolar population. J Nutr. 2012;142:84–90. doi: 10.3945/jn.111.147595. [DOI] [PMC free article] [PubMed] [Google Scholar]
- Naylor JL, Schraer CD, Mayer AM, Lanier AP, Treat CA, Murphy NJ. Diabetes among Alaska Natives: a review. Int J Circumpolar Health. 2003;62:363–387. doi: 10.3402/ijch.v62i4.17581. [DOI] [PubMed] [Google Scholar]
- Ntzani EE, Kawoura FK. Genetic risk factors for type 2 diabetes: insights from the emerging genomic evidence. Curr Vasc Pharmacol. 2012;10:147–155. doi: 10.2174/157016112799305030. [DOI] [PubMed] [Google Scholar]
- Nyholt DR. A simple correction for multiple testing for single-nucleotide polymorphisms in linkage disequilibrium with each other. Am J Hum Genet. 2004;74:765–769. doi: 10.1086/383251. [DOI] [PMC free article] [PubMed] [Google Scholar]
- O’Brien DM, Kristal AR, Jeannet MA, Wilkinson MJ, Bersamin A, Luick B. Red blood cell δ15N: a novel biomarker of dietary eicosapentaenoic acid and docosahexaenoic acid intake. Am J Clin Nutr. 2009;89:913–919. doi: 10.3945/ajcn.2008.27054. [DOI] [PMC free article] [PubMed] [Google Scholar]
- O’Connell JR, Weeks DE. PedCheck: a program for identification of genotype incompatibilities in linkage analysis. Am J Hum Genet. 1998;63:259–266. doi: 10.1086/301904. [DOI] [PMC free article] [PubMed] [Google Scholar]
- Park SH, Lee JY, Kim S. A methodology for multivariate phenotype-based genome-wide association studies to mine pleiotropic genes. BMC Syst Biol. 2011;5(Suppl 2):S13. doi: 10.1186/1752-0509-5-S2-S13. [DOI] [PMC free article] [PubMed] [Google Scholar]
- Plaetke R, Balbi F. PedMerge: merging pedigrees to facilitate family-based genetic statistical analyses. Bioinformatics. 2010;26:2790–2791. doi: 10.1093/bioinformatics/btq523. [DOI] [PMC free article] [PubMed] [Google Scholar]
- Price AL, Patterson NJ, Plenge RM, Weinblatt ME, Shadick NA, Reich D. Principal components analysis corrects for stratification in genome-wide association studies. Nat Genet. 2006;38:904–909. doi: 10.1038/ng1847. [DOI] [PubMed] [Google Scholar]
- Rinaldo A, Bacanu SA, Devlin B, Sonpar V, Wasserman L, Roeder K. Characterization of multilocus linkage disequilibrium. Genet Epidemiol. 2005;28:193–206. doi: 10.1002/gepi.20056. [DOI] [PubMed] [Google Scholar]
- Risch N, Merikangas K. The future of genetic studies of human complex diseases. Science. 1996;273:1516–1517. doi: 10.1126/science.273.5281.1516. [DOI] [PubMed] [Google Scholar]
- Risica PM, Ebbeson SOE, Schraer CD, Nobmann ED, Caballero BH. Body fat distribution in Alaskan Eskimos of the Bering Straits region: the Alaska Siberia Project. Int J Obes. 2000;24:171–179. doi: 10.1038/sj.ijo.0801103. [DOI] [PubMed] [Google Scholar]
- Rudkowska I, Dewailly E, Hegele RA, Boiteau V, Dube-Linteau A, Abdous B, Giguere Y, Chateau-Degat ML, Vohl MC. Gene-diet interactions on plasma levels in the Inuit population. Br J Nutr. 2012. in press. [DOI] [PubMed]
- Teslovich TM, Musunuru K, Smith AV, Edmondson AC, Stylianou IM, Koseki M, Pirruccello JP, Ripatti S, Chasman DI, Willer CJ, Johansen CT, Fouchier SW, Isaacs A, Peloso GM, Barbalic M, Ricketts SL, Bis JC, Aulchenko YS, Thorleifsson G, Feitosa MF, Chambers J, Orho-Melander M, Melander O, Johnson T, Li X, Guo X, Li M, Shin Cho Y, Jin Go M, Jin Kim Y, Lee JY, Park T, Kim K, Sim X, Twee-Hee Ong R, Croteau-Chonka DC, Lange LA, Smith JD, Song K, Hua Zhao J, Yuan X, Luan J, Lamina C, Ziegler A, Zhang W, Zee RY, Wright AF, Witteman JC, Wilson JF, Willemsen G, Wichmann HE, Whitfield JB, Waterworth DM, Wareham NJ, Waeber G, Vollenweider P, Voight BF, Vitart V, Uitterlinden AG, Uda M, Tuomilehto J, Thompson JR, Tanaka T, Surakka I, Stringham HM, Spector TD, Soranzo N, Smit JH, Sinisalo J, Silander K, Sijbrands EJ, Scuteri A, Scott J, Schlessinger D, Sanna S, Salomaa V, Saharinen J, Sabatti C, Ruokonen A, Rudan I, Rose LM, Roberts R, Rieder M, Psaty BM, Pramstaller PP, Pichler I, Perola M, Penninx BW, Pedersen NL, Pattaro C, Parker AN, Pare G, Oostra BA, O'Donnell CJ, Nieminen MS, Nickerson DA, Montgomery GW, Meitinger T, McPherson R, McCarthy MI, McArdle W, Masson D, Martin NG, Marroni F, Mangino M, Magnusson PK, Lucas G, Luben R, Loos RJ, Lokki ML, Lettre G, Langenberg C, Launer LJ, Lakatta EG, Laaksonen R, Kyvik KO, Kronenberg F, König IR, Khaw KT, Kaprio J, Kaplan LM, Johansson A, Jarvelin MR, Janssens AC, Ingelsson E, Igl W, Kees Hovingh G, Hottenga JJ, Hofman A, Hicks AA, Hengstenberg C, Heid IM, Hayward C, Havulinna AS, Hastie ND, Harris TB, Haritunians T, Hall AS, Gyllensten U, Guiducci C, Groop LC, Gonzalez E, Gieger C, Freimer NB, Ferrucci L, Erdmann J, Elliott P, Ejebe KG, Döring A, Dominiczak AF, Demissie S, Deloukas P, de Geus EJ, de Faire U, Crawford G, Collins FS, Chen YD, Caulfield MJ, Campbell H, Burtt NP, Bonnycastle LL, Boomsma DI, Boekholdt SM, Bergman RN, Barroso I, Bandinelli S, Ballantyne CM, Assimes TL, Quertermous T, Altshuler D, Seielstad M, Wong TY, Tai ES, Feranil AB, Kuzawa CW, Adair LS, Taylor HA, Jr, Borecki IB, Gabriel SB, Wilson JG, Holm H, Thorsteinsdottir U, Gudnason V, Krauss RM, Mohlke KL, Ordovas JM, Munroe PB, Kooner JS, Tall AR, Hegele RA, Kastelein JJ, Schadt EE, Rotter JI, Boerwinkle E, Strachan DP, Mooser V, Stefansson K, Reilly MP, Samani NJ, Schunkert H, Cupples LA, Sandhu MS, Ridker PM, Rader DJ, van Duijn CM, Peltonen L, Abecasis GR, Boehnke M, Kathiresan S. Biological, clinical, and population relevance of 95 loci for blood lipids. Nature. 2010;466:707–713. doi: 10.1038/nature09270. [DOI] [PMC free article] [PubMed] [Google Scholar]
- Tranchevent L-C, Barriot R, Yu S, Van Vooren S, Van Loo P, Coessens B, De Moor B, Aerts S, Moreau Y. ENDEAVOUR update: a web resource for gene prioritization in multiple species. Nucleic Acids Res. 2008;36:W377–384. doi: 10.1093/nar/gkn325. [DOI] [PMC free article] [PubMed] [Google Scholar]
- Voruganti VS, Cai G, Cole SA, Freeland-Graves JH, Laston S, Wenger CR, MacCluer JW, Dyke B, Devereux R, Ebbesson SO, Fabsitz RR, Howard BV, Comuzzie AG. Common set of genes regulates low-density lipoprotein size and obesity-related factors in Alaskan Eskimos: results from the GOCADAN study. Am J Hum Biol. 2006;18:525–531. doi: 10.1002/ajhb.20527. [DOI] [PubMed] [Google Scholar]
- Voruganti VS, Diego VP, Haack K, Cole SA, Blangero J, Goring HH, Laston S, Wenger CR, Ebbesson SO, Fabsitz RR, Devereux R, Howard BV, Umans JG, MacCluer JW, Comuzzie AG. A QTL for genotype by sex interaction for anthropometric measurements in Alaskan Eskimos (GOCADAN Study) on chromosome 19q12-13. Obesity (Silver Spring) 2011;19:1840–1846. doi: 10.1038/oby.2011.78. [DOI] [PMC free article] [PubMed] [Google Scholar]
- Winkler TW, Croteau-Chonka DC, Ferreira T, Fischer K, Locke AE, Magi R, Shungin D, Workalemahu T, Wu J, Day F, Jackson AU, Justice A, Strawbridge R, Volzke H, Qi L, Zillikens MC, Fox CS, Speliotes EK, Barroso I, Ingelsson E, Hirschhorn JN, McCarthy MI, Franks PW, Morris AP, Cupples LA, North KE, Molhke KL, Loos RJF, Heid IM, Lindgren CM, GIANT Consortium Genome-wide association meta-analyses in over 210,000 individuals identify 20 sexually dimorphic genetic variants for body fat distribution. Annual Meeting of the American Society for Human Genetics. 2012 [Google Scholar]
- Wu Z, Li Y, Li X, Ti D, Zhao Y, Si Y, Mei Q, Zhao P, Fu X, Han W. LRP16 integrates into NF-kB transcriptional complex and is required for its functional activation. PloS ONE. 2011;6:e18157. doi: 10.1371/journal.pone.0018157. [DOI] [PMC free article] [PubMed] [Google Scholar]
- Yan TT, Yin RX, Li Q, Huang P, Zeng XN, Huang KK, Aung LH, Wu DF, Liu CW, Pan SL. Sex-specific association of rs16996148 SNP in the NCAN/CILP2/PBX4 and serum lipid levels in the Mulao and Han populations. Lipid Health Dis. 2011;10:248. doi: 10.1186/1476-511X-10-248. [DOI] [PMC free article] [PubMed] [Google Scholar]
- Yu W, Gwinn M, Clyne M, Yesupriya A, Khoury MJ. A navigator for human genome epidemiology. Nat Genet. 2008;40:124–125. doi: 10.1038/ng0208-124. [DOI] [PubMed] [Google Scholar]
- Zhou L, Ding H, Zhang X, He M, Huang S, Xu Y, Shi Y, Cui G, Cheng L, Wang QK, Hu FB, Wang D, Wu T. Genetic variants at newly identified lipid loci are associated with coronary heart disease in a Chinese Han population. PloS ONE. 2011;6:e27481. doi: 10.1371/journal.pone.0027481. [DOI] [PMC free article] [PubMed] [Google Scholar]


