

Abstract
Flow cytometry is an established method for fast and accurate quantitation of cellular protein levels and requires fluorescently labeled antibodies as well as calibration standards. A critical step for quantitation remains the production of suitable detection antibodies with a precisely defined ratio of antigen-binding sites to fluorophores. Problems often arise as a consequence of inefficient and unspecific labeling which can influence antibody properties. In addition, the number of incorporated fluorophores necessitates a special normalization step for quantitation. To address these problems, we constructed different mono- and bivalent bispecific antibodies with binding site(s) for the cell surface antigens, cMET, EGFR1/HER1, ErbB2/HER2 or ErbB3/HER3 and with an additional digoxigenin-binding single-chain Fv fusion. The fluorophore Cy5 was covalently coupled to digoxigenin and quantitatively bound by the bispecific antibody. A panel of tumor cell lines was assessed under different culture conditions for absolute receptor expression levels of the indicated antigens and the data were set in relation to mRNA, gene count and immunoblot data. We could reproducibly quantify these receptors, omit the otherwise required normalization step and demonstrate the superiority of a 1 + 1 bispecific antibody. The same antibodies were also used to quantify the number of proteins in intracellular vesicles in confocal microscopy. The antibodies can be stored like regular antibodies and can be coupled with different digoxigenin-labeled fluorophores which makes them excellent tools for FACS and imaging-based experiments.
Keywords: bispecific antibodies, cMET, digoxigenin, ErbB, receptor quantification
Introduction
Flow cytometry is an attractive option for quantitation of cell surface antigens on intact cells as this technique is available in most molecular biology laboratories. Quantitation of cell surface receptors by flow cytometry has already been described in the early 1980s and is best known as quantitative flow cytometry (QFCM) (Maher and Fletcher, 2005). This technique was early on applied in hematological diseases in order to analyze the implication of cell surface proteins in development of these malignancies. Consequently, a variety of B-cell markers like CD2, CD19, CD20, CD22, CD38 and CD52 are now routinely quantified in different leukemias using QFCM (Iyer et al., 1998; Ginaldi et al., 1998a; Ginaldi et al., 1998b; D'Arena et al., 2000; Jiang et al., 2009; Arun et al., 2010). However, accurate quantitation of cell surface receptors is also of importance in other applications, as the analysis of cellular functions is often based on relative comparison of different cellular states. Exact quantitation of cell surface receptors is for various reasons attractive: among them modeling of cellular networks, predictions on saturation conditions with therapeutic compounds and differentiation of normal and malignant state of cells. Finally, it also facilitates inter-laboratory comparisons (Zenger et al., 1998).
Quantitation of cellular antigens relies on beads with precisely defined numbers of reference molecules which are used as calibration standards. Most common are beads from Quantum Simply Cellular, QuantiBRITE and QIFI for which similar sensitivity and accuracy was reported (Serke et al., 1998). The total fluorophore loading of beads is determined by comparison with a solution of known concentration of this fluorophore, yielding an MESF value (molecules of equivalent soluble fluorophore) (Schwartz et al., 2004). To allow inter-laboratory comparisons, calibrated reference beads are available to standardize procedures. The individual steps of quantitation experiments have been standardized and guidelines are available (Schwartz and Fernandez-Repollet, 2001; D'hautcourt, 2002; Schwartz et al., 2004; Mittag and Tarnok, 2009).
FACS-based receptor quantitation absolutely relies on the availability of fluorescently labeled antibodies. Most often, antibodies are labeled by a lysine-linker chemistry in which surface accessible lysines in the antibody chain are covalently linked to a fluorophore of interest. Usually, labeling reactions are stopped before complete labeling is achieved. Under such conditions it can happen that a certain population of antibodies does not carry a fluorescent label. In addition, depending on the number and location of lysines in the antibody chain the properties of the labeled antibodies can change. For instance, as this labeling technique introduces fluorophores randomly, labeling of lysines near the antigen-recognition sites may lead to a population of antibodies with no or reduced activity. Consequently, active concentration of the detection antibody varies and quantitation will be imprecise. The limiting factor for QFCM therefore is labeling of detection antibodies which is usually unspecific, resulting in, e.g. loss of antigen-binding, poor labeling reproducibility, heterogeneity of conjugated antibodies and shifted excitation and emission spectra (Schwartz et al., 2004). A strategy which is often used to overcome these problems is a special normalization step in which the fluorophore to antibody ratio is quantified using beads which can bind a defined amount of labeled antibody (Lenkei et al., 1998). One fluorophore that can be used in this respect is phycoerythrin, which has a molecular weight of 200 kDa and a very high quantum yield. The size of the fluorophore enables purification of 1 : 1 antibody–fluorophore conjugates, however, usually with a poor overall yield (Pannu et al., 2001).
The advent of bispecific antibodies, easily available antibody variable domain sequences and falling prices for gene synthesis offers now a solution to generate a precise tool for receptor quantitation and internalization studies. A multitude of different antibody formats has been described in the past (Kontermann, 2012). Purification to near homogeneity is feasible, which is also reflected by the fact that such constructs are developed for therapeutic use in patients (Nieri et al., 2009). This makes it possible to tailor the antigen-binding properties on the one side and allows engineering of site-specific fluorophore incorporation on the other. It has been shown previously that attachment of a hapten-specific single-chain Fv (scFv) can be used to couple ‘cargo’ to a bispecific antibody (BsAb). This concept was used for payload delivery of drugs to cells (Metz et al., 2011).
In this study, we applied the same concept to couple fluorophores of interest to generate tool antibodies, which enable highly reproducible precise receptor quantitation. Initially, different formats were generated to compare their properties. As antigens of interest we chose the receptor tyrosine kinases cMET, EGFR1/HER1, ErbB2/HER2 and ErbB3/HER3. These molecules are prominent oncogenes and pursued as drug targets in the clinic (Yarden and Sliwkowski, 2001; Gherardi et al., 2012). By providing quantitation of antigen cell surface expression for nine different cell lines, we here show that a Fab-scFv format is an ideal tool antibody for overcoming the above mentioned problems of QFCM leading to a standardized flow cytometry receptor quantitation. Finally, these antibodies were also used for quantitation of proteins in intracellular vesicles, using confocal microscopy.
Material and methods
Cell culture
A549, A431, Hs746T, MDA-MB-175 VII, NCI-H1993, NCI-H441, SNU-5 and T47D were obtained from ATCC. DU145 and HT29 were obtained from the NCI. MKN45 were purchased from the DSMZ. All cell lines were supplemented with 10% fetal calf serum (FCS), 2 mM l-glutamine (Gibco) and non-essential amino acids (Pan Biotech) unless stated otherwise. A549, A431, NCI-H1993, NCI-H441, DU145, A549-B34 and HT29 were maintained in RPMI 1640 medium. The cell line A549-B34 is genetically altered and overexpresses the HER3 receptor and was kindly provided by Dr Birgit Bossenmaier. For MKN45, RPMI 1640 medium containing 20% FCS was used. SNU-5 cells were maintained in iscove's modified dulbecco's media supplemented with 15% FCS. Hs746T cells were maintained in Dulbecco's modified Eagle's medium (DMEM) high glucose and T47D in RPMI high glucose medium. For MDA-MB-175 VII DMEM:F12 medium containing 10% FCS was used.
Antibody construction
Variable heavy chain regions were ordered as gene synthesis containing a Kozak sequence and leader peptide with flanking 5′ BamHI and 3′ KpnI sites. The sequences were derived from available patents (HER2: US5772997; HER3: WO2011076683; cMET: US2007/0092520; DIG scFv: WO2011/003557). The KpnI site was located in the CH1 domain of the human IgG1 cds (coding sequence). The light chains were ordered as complete cds in form of a gene synthesis with 5′ BamHI and 3′ XbaI sites. The scFv anti-digoxigenin (Dig) fusion construct was ordered in the order of variable heavy chain, linker, followed by variable light chain and contained an additional disulfide bridge (VHCys44 and VLCys100) (Jung et al., 1994). The scFv was cloned as described before (Metz et al., 2011). For Met2v2, one heavy chain and one light chain plasmid were prepared. For Met1v1, two different heavy chains and one light chain plasmid were prepared. The two heavy chain plasmids contained the knobs-into-hole mutation T366W (knob) and T366S, L368A and Y407V (hole) in the CH3 domain of the human IgG1 backbone as previously published (Ridgway et al., 1996; Merchant et al., 1998). An additional disulfide bond was engineered into the CH3 domains of the two heavy chains: S354C (knob) and Y349C (hole) (Ridgway et al., 1996; Merchant et al., 1998). For Met Fab1v1, a light chain and one ‘heavy’ chain consisting of VH-CH1 coupled to scFv were constructed. The resulting Fab-scFv construct has been described previously (Lu et al., 2002).
Antibody expression and purification
Antibody chains were co-transfected in HEK293F cells (Invitrogen) as previously described (Metz et al., 2011). After 7 days of cultivation cell culture supernatants were harvested and filtered through a 0.22 µM filter. Antibodies with Fc part were bound to a protein A Sepharose column (GE Healthcare) and washed with phosphate-buffered saline (PBS). Antibodies without Fc part were applied to a Kappa-Select column (GE Healthcare) and similarly washed with PBS. Elution of antibodies was achieved at pH 3.0 for protein A and at pH 2.5 for Kappa-Select. If required, further purification by size-exclusion chromatography was performed as described (Metz et al., 2011). The protein concentration of purified antibodies was determined by measuring the OD at 280 nm, using a molar extinction coefficient calculated according to Pace et al.(1995).
Analytical size-exclusion chromatography
For analytical size-exclusion chromatography, samples were applied to a Tosoh TSKgel G3000SW column in 300 mM NaCl, 50 potassium phosphate, pH 7.5, on an Agilent HPLC 1100 system. The eluted protein was quantified by UV absorbance at 280 nm.
Labeling of antibodies with Cy5-Dig
Cy5-Dig constructs were synthesized at Roche essentially as described (Metz et al., 2011). A 428 µM solution of a Cy5-Dig conjugate in PBS was mixed with the respective BsAb in a 1.2 : 1 molar ratio or 2.4 : 1 ratio, respectively, if two scFv were contained. The mixture was incubated for 10 min at room temperature. Antibodies were used immediately for FACS-based applications.
Labeling of antibodies with Cy5
The parental Met2v2 and Met1v1 antibodies were covalently labeled with Cy5 by the use of Cy5 mAb Labeling Kit (GE Healthcare). In brief, antibodies were equilibrated in PBS (pH 7.3) at 1 mg/ml. 100 µg of antibody was conjugated according to the manufacturer's instructions for 30 min at room temperature. Free dye was separated from conjugated antibody by size-exclusion chromatography. Cy5-labeled antibody was stored light protected at 2–8°C.
FACS-based receptor quantitation
Cell lines growing in the logarithmic phase were harvested by the use of Accutase (Sigma Aldrich) at the respective experimental time points. Cells were counted and 2 × 10⁵ cells were seeded in duplicates into v-bottom 96-MTP wells (Nunc). After centrifugation, a washing step with ice-cold PBS (Gibco) containing 2% FCS was performed on ice. In the meantime, detection antibodies were coupled to Dig-Cy5 in a 1 : 1.2 or 1 : 2.4 molar ratio in PBS (2% FCS) and incubated for 10 min in the dark at room temperature. 50 µl of Dig-Cy5 coupled antibodies was added to the cells, thoroughly resuspended and incubated in the dark. After 45 min of incubation the cell suspension was washed three times with ice-cold PBS (2% FCS) and spun down at 300× g for 5 min. Samples were resuspended in 200 µl 1× CellFix (BD) and subjected to flow cytometric analysis (BD, FACS Canto). Data acquisition comprised of SSC-A, forward scatter (FSC)-A, FSC-W and Cy5 channel. FSC threshold for events was set between 10 000 and 12 000. Photomultiplier tube (PMT) for Cy5 channel was kept constant at 446. Overall, 10 000 events of the desired and gated populations were recorded. HTS unit settings were: 100–150 µl sample, flow rate 2 µl/s, mixing volume 80–100 µl, mixing five times with a speed of 200 µl/s and a washing step of 200–600 µl. Data analysis was performed with FlowJo (Tree Star) and XLfit (IDBS).
MESF calibration beads and MESF reference standard
Mean fluorescence intensity (MFI) values were translated into MESF values by the use of Cy5 MESF Calibration Beads (Bangs Laboratories). For this purpose one drop of each bead population was added into 500 µl 1× Cell Fix (BD) in PBS containing 2% FCS and mixed thoroughly. The same procedure was followed for the Cy5 MESF blank control. The use of a Cy5 reference standard (Bangs Laboratories) guarantees similar flow cytometric conditions between experiments and was used to calibrate the FACS Canto prior use (unified window of analysis). For this purpose, MESF calibration beads and MESF reference standard were measured at the same PMT settings as subsequently analyzed cells.
Simple cellular beads
The effective fluorophore to protein ratio (F/P) was determined by the use of simple cellular® anti-human IgG beads in combination with MESF calibration beads (Bangs Laboratories). To 100 µl of a 10 or 100 µg/ml containing BsAb-Dig-Cy5 solution one drop of simple cellular® anti-human IgG beads was added and incubated for 30 min on ice in the dark. Samples were then washed twice with 2 ml ice-cold PBS (2% FCS) and centrifuged at 300× g for 5 min. For flow cytometric analysis (BD, FACS Canto), 500 µl of ice-cold PBS (2% FCS) was added to the samples which were then analyzed in the SSC-A, FSC-A, FSC-W and Cy5 channel. In total, 10 000 events were recorded, exported as FCS 3.0 files and analyzed with FlowJo (Tree Star).
Receptor quantitation with QuantiBRITE
To evaluate phycoerythrin (PE)-labeled HER3 mAb (R&D Systems) the QuantiBRITE™ PE fluorescence quantitation kit was applied. It contains lyophilized pellets of four bead populations that are conjugated with different amounts of PE molecules. The beads were resuspended in 500 µl PBS (2%FCS, 1× BD Fix) and analyzed in flow cytometry. Singlets were gated in the SSC and FSC plot and the resulting PE levels used to determine the antibody-binding capacity (ABC) of an unknown cell population.
mRNA expression profiling
Total RNA was isolated from cells using the RNeasy Mini Kit (Qiagen, Germany). From this material, cDNA synthesis was performed using a cDNA synthesis kit (Roche Applied Science, Germany) and the resulting double-stranded cDNA was purified with a Microarray Target Purification Kit (Roche Applied Science). Purified cDNA was then transcribed into cRNA using the Roche Microarray RNA Target Synthesis Kit (T7) (Roche Applied Science) and further purified with RNeasy Mini-Spin Columns (RNeasy Mini Kit). All kit procedures were performed according to the manufacturers' instructions. Twenty micrograms of the purified cRNA were fragmented in a total volume of 40 µl (adjusted with diethylpyrocarbonate-water) using 8 µl of 5× fragmentation buffer (200 mM Tris-acetate, pH 8.1; 500 mM potassium acetate and 150 mM magnesium acetate) at 94°C for 35 min. Thirty microliters of fragmented cRNA solution were mixed with control oligonucleotide, staggered control cRNAs, herring sperm DNA, acetylated bovine serum albumin and hybridization buffer in a total volume of 300 µl. This hybridization mix was loaded onto Affymetrix Human Genome U133 Plus 2.0 arrays and incubated in a roller device for 16 h. Hybridization solution was removed, the arrays were washed and stained as recommended by Affymetrix and then scanned with an Affymetrix GeneChip Scanner 3000 (7G). For the cell line H1993 a slightly modified protocol (L8) was used. After total RNA isolation with the RNeasy Kit double-stranded cDNA was generated, then transcribed into biotinylated aRNA and purified using the GeneChip 3′IVT Express Kit (Affymetrix). All samples were measured in triplicates and analyzed using in-house software.
Immunoblot
Overall 1 × 10⁶ cells were lysed, the protein concentration was determined by BCA assay (Pierce) and sodium dodecyl sulphate polyacrylamide gel electrophoresis (SDS–PAGE) analysis with 25 µg of total protein was performed with NuPAGE gels (Invitrogen). Protein transfer to a nitrocellulose membrane was done using the I-blot (Invitrogen) system. Total and phosphorylated cMET receptor was detected with mAb #3148 and mAb #3077 (Cell Signaling), respectively.
Quantitative confocal immunofluorescence analysis of bispecific antibodies
Cells were grown on calibrated glass coverslips to a confluency of 80%. Subsequently, cells were incubated with 10 µg/ml of BsAb/Dig-Cy5 complex for 60 min at either 4 or 37°C, washed, fixed and immediately imaged on a Leica SP5X confocal microscope using hybrid detectors (HyD) in photon counting mode. Imaging conditions were as follows: 63×/1.2 NA water immersion lens, white light laser excitation at 649 nm at 25% laser intensity, emission band pass at 656–758 nm, HyD setting at 100%, Pinhole AU = 1.2 corresponding to an optical section thickness of 1.062 µm, pixel size 72.9 nm and 12 bit resolution. For quantification, solutions with defined concentrations of Cy5 were measured and a calibration curve was established. Measured gray levels were then translated into a pseudocolor intensity map and absolute concentrations of Cy5, respectively, which were then assigned to the labeled cells.
Results
Generation and biochemical characterization of bispecific antibodies
We sought to improve the quality of detection antibodies to increase the technical precision of receptor quantitation. For this purpose we took advantage of the BsAb technology as a regular IgG antibody is bivalent and as such can bind to one or two antigens leading to inaccurate quantitation. To address several questions we chose three principal antibody formats, which were specific for the receptor tyrosine kinases cMET, HER1, HER2 and HER3, as biological targets on the one hand and in addition recognized hapten Dig on the other hand (Fig. 1a). All antibodies bound with low nM affinities to their respective targets.
Fig. 1.

Generation of bispecific antibodies for receptor quantitation of cell surface cMET. (a) Schematic presentation of different BsAb formats (variable regions shaded). (b) Coomassie stained SDS–PAGE under non-reducing (NR) and reducing (R) conditions in the order as presented in A (HC 1/2 indicates the two different heavy chains, LC, light chain, *, chain with scFv). (c) Analytical HPLC of Protein A and size-exclusion chromatography purified BsAb. (d) Chemical structure of the small molecule Dig-Cy5. (e) Binding possibilities of a 1 + 1 and 2 + 2 format emphasizing that a 2 + 2 BsAb can also bind monovalently.
A first construct, Met2v2, comprised of two disulfide stabilized scFv fusions at the C-terminus of the human IgG1 heavy chain of the cMET-specific antibody. As connector between heavy chain and scFv we chose a glycine serine motif (G4S), which was previously shown to enable free access to the Dig-binding site (Metz et al., 2011). Secondly, we constructed a monovalent construct, Met1v1, with only one scFv. In this construct, the second Fab arm was removed. To enforce hetero-dimerization of the two different heavy chains, knobs-into-holes strategy was employed. Furthermore, an additional disulfide bridge was engineered in the CH3 domain of the heavy chains (Ridgway et al., 1996; Merchant et al., 1998). In a third construct, Met Fab1v1, we constructed a Fab-scFv fusion construct which lacked a constant region (Fc). Of the last variant, we also generated ErbB2/HER2 and ErbB3/HER3-specific BsAb. Fab-scFv constructs have been described previously (Lu et al., 2002). A fourth construct, only generated for HER2 (Her2 Fab1v2), not depicted in this figure, consisted of a Fab with scFv fusions at the C-terminus of heavy and light chain, thus resulting in two Dig-binding sites.
The BsAbs were transiently expressed in a HEK293 expression system and affinity purified from the cell supernatant with protein A if Fc part was present or with Kappa-Select if Fc was lacking. In a second step, BsAb were subjected to size-exclusion chromatography. Protein purity and integrity were confirmed by SDS–PAGE analysis (Fig. 1b) and analytical high-performance liquid chromatography (HPLC) (Fig. 1c). Antibody masses were confirmed in mass spectroscopy (data not shown). In summary, all constructs could be produced in mg quantities and their homogeneity was >95%.
Dig is a small molecule and specific antibodies against Dig have been described more than 20 years ago (Kessler, 1991). We took advantage of the small size of Dig and the possibility to covalently couple Dig with other small molecules. The antibody-binding Dig which was used here has been described and a crystal structure of the antigen–antibody complex is available (Metz et al., 2011). More importantly, the antibody accommodates modification of Dig and linker-mediated fusion of small molecules or proteins. For our studies we generated a Dig-Cy5 molecule (Dig-Cy5) (Fig. 1d). Homogeneity of Dig-Cy5 was confirmed to be >96% by re-analysis of the purified product in analytical HPLC (Supplementary Fig. S1A). It has been previously shown by us that the labeling of such BsAb with Dig is quantitative and stable (Metz et al., 2011).
Flow cytometric setup for cMET receptor quantitation
For flow cytometric receptor quantitation experiments commercially available beads were used carrying defined amounts of fluorophores. We obtained Cy5-labeled beads from Bangs Laboratories and determined the quality of these beads in forward-side scatter. Potential dimers were excluded and four different bead populations gated (Fig. 2a). The resulting MFI standard curve had a correlation coefficient of R > 0.99 and upon calculation of the MESF values the lower and upper detection limits were 831 ± 38 and 1 655 554, respectively.
Fig. 2.

Establishing receptor quantitation and the FACS gating strategy. (a) Gating and quality control of MESF calibration beads used for calibration curve. Numbers indicate four different bead populations. (b) Analysis of Dig-Cy5 to antibody ratio for indicated antibodies using simple cellular beads. (c) Concentration-dependent analysis of BsAb cell surface binding to cMEThigh H1993 (red = Met1v1, blue = Met2v2, green = Met Fab1v1). Saturation is dependent on absolute cMET receptor expression. (d) Exemplary scatter profile for a cMETlow and cMEThigh (A549, MKN45) cell line with additional histogram analysis for Met1v1 (red) and IgG control (black).
If antibodies are randomly labeled with fluorophores, mean incorporation efficiency is determined (F/P ratio) in a separate experiment. For this, beads which carry a defined amount of anti-Fc-binding antibodies detecting human IgG, so called simply cellular beads, are used (Bangs Lab). Fluorophore-labeled antibodies bound to these beads are analyzed by flow cytometry and the resulting MFI signal is matched against the previously described calibration curve and yields mean MESF per antibody. We quantified the amount of fluorophore bound to our bispecific antibodies with simple cellular beads specific for human IgG. For this, antibodies were loaded with Dig-Cy5 which was done prior to each experiment. To fully saturate the monoclonal antibody (mAb) or scFv(s), Dig-Cy5 was added in a 1.2 : 1 and 2.4 : 1 molar ratio, respectively. Residual Dig-Cy5 was not removed by size exclusion or other methods. Two different concentrations of anti-Dig mAb (IgG-Dig), Met2v2 and Met1v1 were used to achieve saturation of simple cellular beads which had an ABC value of 194 461. No concentration-dependent differences were observed, confirming saturation of beads with BsAb (Fig. 2b). Displayed MESF values were not normalized for the number of Dig-Cy5 molecules per antibody. Instead, we calculated the expected and effective F/P ratio by dividing measured MESF and manufacturer provided ABC value. For all antibodies, the obtained value was significantly lower than the expected ratio (Fig. 2b). This was also the case for IgG-Dig, a regular mAb and therefore steric hindrance due to scFv did not play a role. Instead, it is likely that mono- or bivalent binding to anti-Fc-binding antibodies introduces an already significant error margin.
Next, we determined saturation curves for different cMET-specific BsAb on cell lines with high expression of cMET as the required antibody concentration depends on absolute receptor expression. This is exemplarily shown for H1993 (Fig. 2c). For all constructs, saturation was reached at a concentration of 10 µg/ml and this BsAb concentration was chosen for all subsequent quantitation experiments. For a relatively cMETlow and cMEThigh cell line, A549 and H1993, we have shown the scatter profiles and gating strategy. A clear differentiation between control antibody and BsAb was visible (Fig. 2d). As control antibody we used IgG-Dig with bound Dig-Cy5. This unspecific MFI signal was always subtracted from the measured BsAb MFI and the resulting MFI was matched against the calibration curve (Fig. 2a) to yield the final MESF value which reflects the total receptor number. Presence or absence of a live–dead marker to exclude apoptotic cells did not influence the quantitation results (data not shown). All subsequent experiments were conducted in the absence of a live–dead marker.
Cell culture-dependent cell surface expression of cMET
It is known that the expression level of cellular proteins also depends on confluency and the elapsed time from seeding to analysis (Kornilova et al., 1992). Therefore, a time course experiment was conducted in which the MESF values for cMET were determined over a period of 4 days for two different cell lines, A549 and MKN45. In contrast to A549, MKN45 harbor a gene amplification of cMET (Supplementary Table SI) and therefore display much higher cell surface cMET levels. This is also accompanied with a change of cellular morphology as cMET induces an epithelial-to-mesenchymal transition phenotype. Accordingly, MKN45 cells appeared roundish and loosely adherent in bright field microscopy (Fig. 3a). We observed indeed a 2–4-fold change in MESF values for both cell lines and the trend for both cell lines was similar, with a higher variation for A549 (Fig. 3a). For better visualization the values at Day 3 were set to 100% and all subsequent experiments were done at Day 3.
Fig. 3.

Influence of culture conditions on cell surface expression levels of cMET determined by flow cytometry. (a) Time course receptor quantitation experiment with Met1v1 in A549 and MKN45. MESF values at Day 3 were set to 100% (absolute MESF values at Day 3: A549 = 49 984; MKN45 = 569 090). Prior analysis bright field pictures were taken at each day (Days 1–4) at a magnification of 100×. (b) Immunoblot analysis of total (t) and phosphorylated (p) cMET in nine cell lines (black triangle indicates t- and p-cMET). Cell lysates were harvested at Day 3 after seeding.
Quantitation of cMET receptors on tumor cells
For a panel of nine cell lines we assembled the corresponding gene count, mRNA and protein expression data (Supplementary Table SI, Fig. 3b). Criteria for inclusion were different tissue type origins, absence or presence of gene amplification and accordingly high and low mRNA values. As cMET negative cell line T47D was selected for which also no mRNA signal was detectable. The mRNA value was normalized to DU145, a cell line with relatively low expression levels of cMET. Overall, a correlation of gene count and mRNA expression was visible, albeit the fold difference for the mRNA value was rather modest. Gene count data were obtained from Beroukhim et al. (2010). Cell lysates were prepared at Day 3 after seeding and total as well as phosphorylated cMET were visualized in an immunoblot (Fig. 3b). At low exposure levels, the total cMET signal in A549 was not visible, highlighting the limited dynamic range of immunoblots. For phosphorylated cMET a second band at 170 kDa was visible which indicated the furin-uncleaved precursor protein.
For this cell line panel MESF values for cMET were generated using our three different BsAb. MESF values obtained for Met1v1 and Met Fab1v1 were similar and reproducible (Table I). With the selected cell lines we could show quantitation over three log scales. We calculated the ratio of Met2v2 to Met1v1 and observed that Met2v2 gave consistently higher MESF values, except for H1993. This can be explained by the binding properties of Met2v2, which can bind one cMET receptor with each Fab arm (Fig. 1e). It has been shown previously that mono- and bivalent binding influences receptor quantitation (Davis et al., 1998). Pure monovalent binding would have resulted in a ratio of two (Table I). A bivalent detection antibody therefore introduces a huge error margin simply because mono- or bivalent binding properties cannot be predicted.
Table I.
MESF values for cMET
| Cell line | Met2v2 |
Met1v1 |
Met Fab1v1 |
Factor | |||
|---|---|---|---|---|---|---|---|
| Mean MESF | STD (MESF) | Mean MESF | STD (MESF) | Mean MESF | STD (MESF) | Met2v2/Met1v1 | |
| T47D | n.d. | n.d. | n.d. | n.d. | n.d. | n.d. | n.d. |
| H441 | 137 252 | ±42 899 | 109 909 | ±36 334 | 109 270 | ±39 611 | 1.2 |
| Du145 | 11 211 | ±2009 | 7000 | ±1057 | 5511 | ±1180 | 1.6 |
| HT29 | 15 460 | ±1898 | 9440 | ±2219 | 9139 | ±2339 | 1.6 |
| A549 | 45 096 | ±6530 | 37 224 | ±6878 | 34 360 | ±87 | 1.2 |
| Hs746T | 235 601 | ±5958 | 152 191 | ±33 867 | 150 603 | ±24 984 | 1.5 |
| MKN45 | 752 311 | ±47 944 | 698 653 | ±40 066 | 783 259 | ±61 171 | 1.1 |
| Snu5 | 1 417 397 | ±91 892 | 1 145 582 | ±149 106 | 1 226 230 | ±129 951 | 1.2 |
| H1993 | 1 188 770 | ±11 388 | 1 173 664 | ±100 686 | 1 178 566 | ±40 577 | 1.0 |
Flow cytometric quantitation of cMET cell surface levels at Day 3 using different bispecific antibodies as indicated. Standard deviation (STD) presented in absolute values. F/P, ratio of MESF values for Met2v2 and Met1v1. Flow cytometric experiments were performed in three biological replicates with two technical replicates per measurement (n.d., not detectable).
Quantitation of ErbB2/HER2 and ErbB3/HER3 on tumor cells
To expand our analysis to other cell surface targets we chose HER2 and HER3 as prominent tumor targets and similarly generated Fab1v1 constructs (data not shown). Receptor quantitation was done with the same cell line panel as described for cMET. Despite the low mRNA signals which were observed for HER2 and HER3, we could detect both receptor tyrosine kinases on the cell surface of the indicated tumor cell lines (Table II). The correlation between mRNA and protein was weak underscoring the necessity to directly determine protein levels to draw meaningful conclusions on the presence of protein on the cell surface. For HER2, we also generated a Fab1v2 molecule, which contained two Dig-specific scFv. The rationale for this construct was to increase the signal strength to also detect targets with low cell surface expression levels. In particular, we wondered if the monitored number of HER2 molecules would increase if the antibody delivers a brighter fluorescent signal due to a shift in the detection limit. For HER2, this was not the case: instead, we observed a very good 2-fold increase in the MESF signal if values were not corrected for the number of scFv's (Table II). This finding confirmed a linear increase in the monitored signal if the number of fluorophores was doubled. Thus, this approach is feasible but benefits might only be visible for targets with even lower cell surface expression levels.
Table II.
MESF values for ErbB2/Her2 and ErbB3/Her3
| Cell line | HER2 |
HER3 |
||||||||
|---|---|---|---|---|---|---|---|---|---|---|
| Her2 Fab1v2 |
Her2 Fab1v1 |
Her3 Fab1v1 |
||||||||
| mRNA | STD | Mean MESF | STD | Mean MESF | STD | mRNA | STD | Mean MESF | STD | |
| T47D | 565 | ±23 | 80 677 | ±14 938 | 32 637 | ±6762 | 2436 | ±71 | 5080 | ±1641 |
| DU145 | 229 | ±4 | 20 524 | ±2317 | 11 066 | ±997 | 159 | ±24 | 2751 | ±429 |
| HT29 | 364 | ±32 | 45 029 | ±1683 | 22 354 | ±3113 | 1472 | ±57 | 4020 | ±86 |
| H1993 | 139 | ±13 | 59 036 | ±4358 | 29 231 | ±1355 | 163 | ±5 | 8482 | ±450 |
| H441 | 465 | ±11 | 66 913 | ±11 847 | 32 722 | ±6152 | 1105 | ±168 | 8297 | ±1932 |
| A549 | 139 | ±12 | 12 219 | ±3157 | 6230 | ±1163 | 21 | ±4 | 1498 | ±266 |
| Hs746T | 161 | ±3 | 16 629 | ±2578 | 7610 | ±888 | 1 | ±3 | 900 | ±326 |
| MKN45 | 405 | ±4 | 53 227 | ±4559 | 27 041 | ±3974 | 1473 | ±30 | 7403 | ±1310 |
| SNU-5 | n.d. | n.d. | 72 193 | ±8871 | 31 752 | ±3322 | n.d. | n.d. | 3175 | ±696 |
Flow cytometric quantitation of 1v1 and 1v2 normalization of Her2 and Her3 cell surface levels at Day 3 using a Fab1v1 BsAb. Flow cytometric experiments were performed in three biological replicates with two technical replicates. mRNA data and standard deviation (STD) are shown in absolute values.
Comparison to available methods
To assess comparability and potential superiority of our approach we followed several strategies. We labeled our antibodies, thus having the same antigen-binding site, with Cy5 by lysine-linker chemistry. This was done for the parental antibodies of Met1v1 and Met2v2 which did not carry additional scFvs. For the former, we determined 0.87 and for the latter 0.38 Cy5 per antibody using simple cellular beads. MESF values for MKN45 and H1993 were then determined (Fig. 4a). We observed differences between our Dig-Cy5 and directly Cy5-conjugated constructs which ranged from 1 : 0.8 to 1 : 2.5. This apparent difference can be explained by the normalization step with simple cellular beads. With Dig-Cy5 coupled antibodies we found a deviation of up to 3-fold from the expected value in this normalization step (Fig. 2b). This error is propagated to the cellular receptor quantitation. Therefore, we conclude that simple cellular beads by itself already introduce a large error margin.
Fig. 4.

Comparison of BsAb based receptor quantitation with standard FACS-based methods. (a) cMET receptor quantitation in MKN45 and H1993 with either Dig-Cy5 BsAbs (black bars) or lysine-coupled Cy5 mAbs (white bars). (b) HER3 receptor levels in A549-B34, H441 and MDA-MB175. Dig-Cy5 Her3 Fab1v1 and a HER3-phycoerythrin antibody (QuantiBRITE) were compared.
Next, we obtained commercially available anti-HER3-PE antibody which was suitable for QuantiBRITE experiments. We chose three cell lines to compare in parallel HER3 receptor expression with QuantiBRITE and our method using the Her3 Fab1v1 (Fig. 4b). At least for two cell lines we found higher signals for Her3 Fab1v1 in a range, which is similar to what we observed for Met1v1 versus Met2v2 (Table I). These differences display monovalent versus bivalent binding and therefore support our hypothesis that it is better to use high affinity monovalent binders instead of bivalent mAbs (Fig. 1e).
Lastly, we did a literature search to compare our method to publicly available data. HER1/EGFR numbers were quite often determined in A431, an epidermoid cancer cell line, using different approaches (Chatelier et al., 1986; Barta et al., 2011; Novy et al., 2012). The mean receptor numbers found ranged from 1.3 to 2.1 × 10⁶. We generated an EGFR 2v2 BsAb, and determined the mean receptor number on A431 to be 1.55 × 10⁶ ± 9.1 × 10⁴ which matches previous findings. This highlights that using a mAb (EGFR 2v2 BsAb) we can reproduce literature known data.
Taken together, we believe that these findings confirm that not just comparable but also more precise values can be obtained using bispecific antibodies for receptor quantitation.
Distribution of cMET receptors on the surface of tumor cells
We used the BsAbs in parallel for quantitative confocal microscopy analysis in conjunction with HyD. This method allowed us to infer the absolute number of labeled biomolecules at a subcellular level of resolution (Digman et al., 2008; Leica Microsystems, 2012). In a first experiment, we incubated the high cMET expressing cell line H1993 at 4°C with Met2v2 and Met1v1. Under these conditions, which are similar to the FACS-based receptor quantitation, we observed in confocal microscopy a homogeneous receptor expression on the cell surface (Fig. 5a). The overall signal for Met1v1 was lower than for Met2v2. To quantify the obtained signals, solutions of defined concentrations of Cy5 were analyzed in parallel and the resulting fluorescent signal was used to calculate the absolute concentration (for details see Materials and methods section). The signal was linear over a large log range and translated into a pseudocolor map representing absolute concentrations (Fig. 5b). In a second experiment, the bispecific antibodies were added at 37°C to three different cell lines with different expression levels of cMET (Fig. 5c). The differences in staining intensity were clearly visible and correlated with the quantitation experiment. This method allowed the quantitative assessment of local concentrations of molecules of interest in subcellular domains at a high level of optical resolution afforded by high end confocal microscopy. Quantitation was quite possible for visible cellular structures and organelles—but not so easily achieved for the whole cell. At 37°C, the BsAb significantly internalized and was visible as punctuate pattern corresponding to endosomes and lysosomal organelles.
Fig. 5.
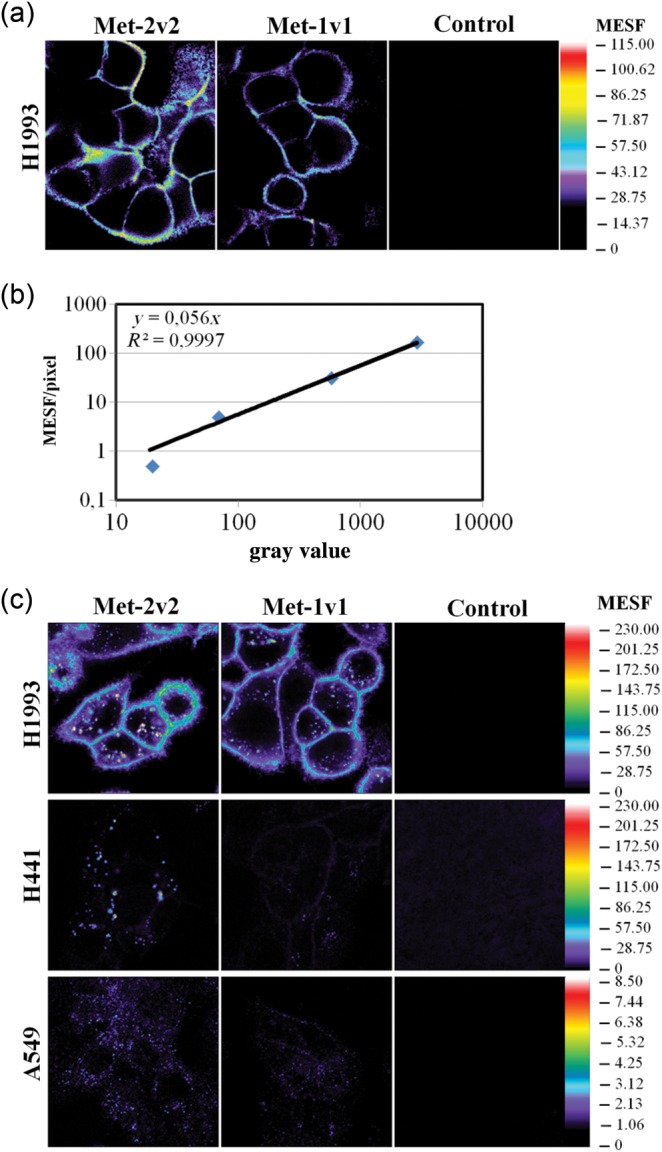
Visualization of cMET on tumor cells by confocal microscopy. (a) Analysis of cMET cell surface expression with the indicated antibodies. Cells were stained at 4°C. (b) Gray value–concentration plot of defined concentrations of Cy-5 dye in solution. Measurements were taken at 10 µm distance from the coverglass surface. (c) Analysis cMET cell surface expression and internalized cMET. Cells were incubated with antibodies for 60 min at 37°C. Signals for Met2v2 were corrected for the number of Dig-binding scFv per antibody.
Discussion
A BsAb, specifically a Fab-scFv construct, with an antigen-specific part and a hapten-binding moiety which allows coupling of fluorophores for receptor quantitation experiments presents several advantages: (i) monovalency for the antigen-binding site delivers a precise antibody to antigen ratio; (ii) quantitative and site-specific labeling is feasible without eventually affecting the antibody-binding properties and yielding only one product; (iii) the precise labeling ratio makes it unnecessary to use another error-prone normalization step with simple cellular beads; (v) although not specifically shown, omitting the Fc part reduces the risk of unwanted binding to FcRn receptor molecules.
The hapten coupling method is in our opinion of advantage in comparison to a covalent coupling as larger amounts of different hapten-conjugated fluorophores can be easily produced, which enables versatile and flexible coupling of different fluorophores to one BsAb. This would also enable multiplexing of different cell surface antigens as long as the fluorophore excitation and emission spectra do not overlap. Multiplexing for receptor quantitation experiments is challenging but has been described previously (Wang et al., 2008). In addition, this separates the protein component from the small molecule fluorophore. The latter is usually stable much longer and easier to handle. Instead of small molecules the technique very likely also accommodates quantum dots which already have been used for antigen quantitation experiments (Buranda et al., 2011).
We could demonstrate that the signal strength increases linearly if another hapten-specific scFv is conjugated, doubling the amount of fluorophore per antibody. This could be employed to increase the signal strength for targets with a low cell surface expression. Furthermore, instead of increasing the number of hapten-specific scFv one could also synthesize a Dig-containing small molecule which carries more than one fluorophore, further enhancing the signal strength.
One has to be aware that flow cytometric MFI values correlate with beads which were normalized to MESF values of a defined calibrator solution. As the steric, electrostatic and buffer conditions of an antibody–fluorophore are different, one can only refer to this standard and not define absolute receptor numbers as it might be possible by mass spectrometry.
If a bivalent mAb format is replaced by a monovalent binder it is of importance that the antibody affinity is very high, specifically a low koff is desired, to prevent dissociation under washing conditions. Similar considerations are valid for the hapten-binding site. However, we did not observe loss of antibody or hapten in our experimental setting. For all antibody-derived quantitation experiments it has to be considered that the antigen-binding site can have a major influence on quantitation. Antigen binding can be influenced by various factors, e.g. co-receptor expression or ligand presence masking the binding site, changes in the glycosylation pattern or splice variants lacking the antigen-binding site.
Using a BsAb for receptor quantitation as described here, one still faces the problem that a huge variability is introduced by the cell culture conditions. Cell culture confluency has a large impact on receptor expression. This necessitates rigorous adherence to cell culture protocols to achieve reproducible results. Therefore, the seeding conditions and time of analysis are fundamental parameters which need to be reported.
With quantitative confocal immunofluorescence we could confirm our flow cytometry findings. Indeed, we were also able to successfully employ bispecific antibodies to quantify the amount of BsAb which was internalized at 37°C in individual cellular organelles. This additional information on subcellular locations complements the FACS analysis. Precise quantitation of antibody content in organelles may for instance help to infer the rate of internalization in a quantitative manner. Although not a focus of this manuscript, the presented BsAb approach can be easily adopted for confocal microscopy as well.
The application of recombinant antibody technology to receptor quantitation can be easily implemented if a therapeutic antibody is generated. One part of this effort is sequencing and kinetic characterization of obtained binders. In this case, selection of a suitable antibody from a lead series or the use of the therapeutic antibody itself is feasible. The variable sequence information of antibodies already in use in flow cytometric experiments could also be derived from existing Hybridomas. However, a DNA isolation and sequencing step is then required before a BsAb can be generated.
Overall, we could successfully and reproducibly quantify the amount of cell surface protein for four different antigens. We confirmed our findings by comparison to existing technologies like lysine-linker chemistry and QuantiBRITE and matched findings to literature known data. It can be expected that this concept has broad applicability and could also be expanded for analysis of antigen internalization. FACS-based antigen quantitation experiments can benefit in our opinion from using bispecific antibodies for various aforementioned reasons and significantly improve the value of this technique. Our confocal microscopy findings support that the approach can be broadly applied for imaging techniques as well.
Supplementary data
Funding
Funding to pay the Open Access publication charges for this article was provided by Roche Diagnostics GmbH.
Supplementary Material
Acknowledgements
We thank I. Ioannidis and M. Schwaiger for expert help in protein purification and B. Bossenmaier for kindly providing A549-B34 for receptor quantitation experiments.
References
- Arun I., Wulu J.A., Janik J.E., Jasper G.A., Yuan C.M., Venzon D., Stetler-Stevenson M. Cytometry B Clin. Cytom. 2010;78:169–175. doi: 10.1002/cyto.b.20507. [DOI] [PMC free article] [PubMed] [Google Scholar]
- Barta P., Bjorkelund H., Andersson K. Nucl. Med. Commun. 2011;32:863–867. doi: 10.1097/MNM.0b013e3283483e1c. [DOI] [PubMed] [Google Scholar]
- Beroukhim R., Mermel C.H., Porter D., et al. Nature. 2010;463:899–905. doi: 10.1038/nature08822. [DOI] [PMC free article] [PubMed] [Google Scholar]
- Buranda T., Buranda T., Sklar L.A. Methods Mol. Biol. 2011;699:67–84. doi: 10.1007/978-1-61737-950-5_4. [DOI] [PMC free article] [PubMed] [Google Scholar]
- Chatelier R.C., Ashcroft R.G., Lloyd C.J., Nice E.C., Whitehead R.H., Sawyer W.H., Burgess A.W. EMBO J. 1986;5:1181–1186. doi: 10.1002/j.1460-2075.1986.tb04344.x. [DOI] [PMC free article] [PubMed] [Google Scholar]
- D'Arena G., Musto P., Cascavilla N., Dell'Olio M., Di Renzo N., Carotenuto M. Am. J. Hematol. 2000;64:275–281. doi: 10.1002/1096-8652(200008)64:4<275::aid-ajh7>3.0.co;2-y. [DOI] [PubMed] [Google Scholar]
- Davis K.A., Abrams B., Iyer S.B., Hoffman R.A., Bishop J.E. Cytometry. 1998;33:197–205. doi: 10.1002/(sici)1097-0320(19981001)33:2<197::aid-cyto14>3.0.co;2-p. [DOI] [PubMed] [Google Scholar]
- D'hautcourt J.L. Curr. Protoc. Cytom. 2002:6.12.1–6.12.22. doi: 10.1002/0471142956.cy0612s22. [DOI] [PubMed] [Google Scholar]
- Digman M.A., Dalal R., Horwitz A.F., Gratton E. Biophys. J. 2008;94:2320–2332. doi: 10.1529/biophysj.107.114645. [DOI] [PMC free article] [PubMed] [Google Scholar]
- Gherardi E., Birchmeier W., Birchmeier C., Vande Woude G. Nat. Rev. Cancer. 2012;12:89–103. doi: 10.1038/nrc3205. [DOI] [PubMed] [Google Scholar]
- Ginaldi L., De Martinis M., Matutes E., Farahat N., Morilla R., Catovsky D. J. Clin. Pathol. 1998a;51:364–369. doi: 10.1136/jcp.51.5.364. [DOI] [PMC free article] [PubMed] [Google Scholar]
- Ginaldi L., De Martinis M., Matutes E., Farahat N., Morilla R., Dyer M.J., Catovsky D. Leukoc. Res. 1998b;22:185–191. doi: 10.1016/s0145-2126(97)00158-6. [DOI] [PubMed] [Google Scholar]
- Iyer S.B., Hultin L.E., Zawadzki J.A., Davis K.A., Giorgi J.V. Cytometry. 1998;33:206–212. doi: 10.1002/(sici)1097-0320(19981001)33:2<206::aid-cyto15>3.0.co;2-y. [DOI] [PubMed] [Google Scholar]
- Jiang L., Yuan C.M., Hubacheck J., Janik J.E., Wilson W., Morris J.C., Jasper G.A., Stetler-Stevenson M. Br. J. Haematol. 2009;145:173–179. doi: 10.1111/j.1365-2141.2009.07606.x. [DOI] [PMC free article] [PubMed] [Google Scholar]
- Jung S.H., Pastan I., Lee B. Proteins. 1994;19:35–47. doi: 10.1002/prot.340190106. [DOI] [PubMed] [Google Scholar]
- Kessler C. Mol. Cell. Probes. 1991;5:161–205. doi: 10.1016/0890-8508(91)90041-h. [DOI] [PubMed] [Google Scholar]
- Kontermann R. MAbs. 2012;4:182–197. doi: 10.4161/mabs.4.2.19000. [DOI] [PMC free article] [PubMed] [Google Scholar]
- Kornilova E.S., Taverna D., Hoeck W., Hynes N.E. Oncogene. 1992;7:511–519. [PubMed] [Google Scholar]
- Leica Microsystems. 2012. Simple number and brightness analysis with the Leica TCS SP5 and HyD detection.
- Lenkei R., Gratama J.W., Rothe G., Schmitz G., D'hautcourt J.L., Arekrans A., Mandy F., Marti G. Cytometry. 1998;33:188–196. doi: 10.1002/(sici)1097-0320(19981001)33:2<188::aid-cyto13>3.0.co;2-q. [DOI] [PubMed] [Google Scholar]
- Lu D., Jimenez X., Zhang H., Bohlen P., Witte L., Zhu Z. J. Immunol. Methods. 2002;267:213–226. doi: 10.1016/s0022-1759(02)00148-5. [DOI] [PubMed] [Google Scholar]
- Maher K.J., Fletcher M.A. Quantitative flow cytometry in the clinical laboratory. Clin. Appl Immunol Rev. 2005;5:353–372. [Google Scholar]
- Merchant A.M., Zhu Z., Yuan J.Q., Goddard A., Adams C.W., Presta L.G., Carter P. Nat. Biotechnol. 1998;16:677–681. doi: 10.1038/nbt0798-677. [DOI] [PubMed] [Google Scholar]
- Metz S., Haas A.K., Daub K., et al. Proc. Natl Acad. Sci. USA. 2011;108:8194–8199. doi: 10.1073/pnas.1018565108. [DOI] [PMC free article] [PubMed] [Google Scholar]
- Mittag A., Tarnok A. J. Biophotonics. 2009;2:470–481. doi: 10.1002/jbio.200910033. [DOI] [PubMed] [Google Scholar]
- Nieri P., Donadio E., Rossi S., Adinolfi B., Podestà A. Curr. Med. Chem. 2009;16:753–779. doi: 10.2174/092986709787458380. [DOI] [PubMed] [Google Scholar]
- Novy Z., Barta P., Mandikova J., Laznicek M., Trejtnar F. Nucl. Med. Biol. 2012;39:893–896. doi: 10.1016/j.nucmedbio.2012.02.007. [DOI] [PubMed] [Google Scholar]
- Pace C.N., Vajdos F., Fee L., Grimsley G., Gray T. Protein Sci. 1995;4:2411–2423. doi: 10.1002/pro.5560041120. [DOI] [PMC free article] [PubMed] [Google Scholar]
- Pannu K.K., Joe E.T., Iyer S.B. Cytometry. 2001;45:250–258. doi: 10.1002/1097-0320(20011201)45:4<250::aid-cyto10021>3.0.co;2-t. [DOI] [PubMed] [Google Scholar]
- Ridgway J.B., Presta L.G., Carter P. Protein Eng. 1996;9:617–621. doi: 10.1093/protein/9.7.617. [DOI] [PubMed] [Google Scholar]
- Schwartz A., Fernandez-Repollet E. Clin. Lab. Med. 2001;21:743–761. [PubMed] [Google Scholar]
- Schwartz A., Gaigalas A.K., Wang L., Marti G.E., Vogt R.F., Fernandez-Repollet E. Cytometry B Clin. Cytom. 2004;57:1–6. doi: 10.1002/cyto.b.10066. [DOI] [PubMed] [Google Scholar]
- Serke S., van Lessen L.A., Huhn D. Cytometry. 1998;33:179–187. doi: 10.1002/(sici)1097-0320(19981001)33:2<179::aid-cyto12>3.0.co;2-r. [DOI] [PubMed] [Google Scholar]
- Wang L., Gaigalas A.K., Marti G., Abbasi F., Hoffman R.A. Cytometry A. 2008;73:279–288. doi: 10.1002/cyto.a.20507. [DOI] [PubMed] [Google Scholar]
- Yarden Y., Sliwkowski M.X. Nat. Rev. Mol. Cell Biol. 2001;2:127–137. doi: 10.1038/35052073. [DOI] [PubMed] [Google Scholar]
- Zenger V.E., Vogt R., Mandy F., Schwartz A., Marti G.E. Cytometry. 1998;33:138–145. doi: 10.1002/(sici)1097-0320(19981001)33:2<138::aid-cyto8>3.0.co;2-f. [DOI] [PubMed] [Google Scholar]
Associated Data
This section collects any data citations, data availability statements, or supplementary materials included in this article.