Abstract
Purpose
Management of Retinoblastoma (RB), a pediatric ocular cancer is limited by drug-resistance and drug-dosage related side effects during chemotherapy. Molecular de-regulation in post-chemotherapy RB tumors was investigated.
Materials and Methods
cDNA microarray analysis of two post-chemotherapy and one pre-chemotherapy RB tumor tissues was performed, followed by Principle Component Analysis, Gene ontology, Pathway Enrichment analysis and Biological Analysis Network (BAN) modeling. The drug modulation role of two significantly up-regulated genes (p≤0.05) − Ect2 (Epithelial-cell-transforming-sequence-2), and PRAME (preferentially-expressed-Antigen-in-Melanoma) was assessed by qRT-PCR, immunohistochemistry and cell viability assays.
Results
Differential up-regulation of 1672 genes and down-regulation of 2538 genes was observed in RB tissues (relative to normal adult retina), while 1419 genes were commonly de-regulated between pre-chemotherapy and post- chemotherapy RB. Twenty one key gene ontology categories, pathways, biomarkers and phenotype groups harboring 250 differentially expressed genes were dys-regulated (EZH2, NCoR1, MYBL2, RB1, STAMN1, SYK, JAK1/2, STAT1/2, PLK2/4, BIRC5, LAMN1, Ect2, PRAME and ABCC4). Differential molecular expressions of PRAME and Ect2 in RB tumors with and without chemotherapy were analyzed. There was neither up- regulation of MRP1, nor any significant shift in chemotherapeutic IC50, in PRAME over-expressed versus non-transfected RB cells.
Conclusion
Cell cycle regulatory genes were dys-regulated post-chemotherapy. Ect2 gene was expressed in response to chemotherapy-induced stress. PRAME does not contribute to drug resistance in RB, yet its nuclear localization and BAN information, points to its possible regulatory role in RB.
Keywords: RB, Ect2, PRAME, MYBL2, NCoR1, drug resistance, micro array, chemotherapy
Introduction
Retinoblastoma (RB), a pediatric intraocular malignancy is fatal when left untreated. Enucleation is the treatment of choice and is curative in more than 90% of cases but results in adverse physiological and psychological effects.1–3 Chemotherapy in combination with cyclosporin has also been used in management of intraocular RB.4 Previous studies on drug resistance in RB are based on proteins playing a role in drug resistance reported in other cancers. Some examples are P-glycoprotein (P-gp)/multidrug resistance-associated protein (MRP) and lung resistance protein (LRP),5,6 Crystallin alpha A, alpha B,7 heat shock proteins (HSP 27),8 cancer stem cell markers (ABCG2, MCM2),9 serine/arginine-rich protein-specific kinase 1 (SRPK1),10 Hypoxia inducible factors-alpha (HIF1a) and survivin11 and stathmin12 gene and protein expressions. These studies have analyzed the protein expression mainly by various techniques such as immunohistochemistry and Western blot. Other studies on gene expression in RB are in primary RB samples prior to chemotherapy.13,14 Molecular understanding of drug resistance in post-chemotherapy RB using microarray is limited.
Tumor aggressiveness and/or late diagnosis15 of RB has prompted development of therapeutic strategies, such as chemo-thermotherapy,16 cryotherapy,17 chemotherapy (high-dose chemo), laser therapy,18 brachytherapy, adjuvant therapy, or various combinations of these therapies.19,20 However, even these sometimes fail to prevent tumor recurrence owing to several factors such as larger tumor size, vitreous seedings, age of onset, and family history of RB.21–23 In this context, insights of molecular mechanisms of antitumor agents and their relationship with the drug resistant states would provide effective options for chemotherapy prevention.24,25 Hence, here microarray analysis of various deregulated genes was performed in tumor tissues from post-chemotherapy RB patients. The present study also evaluates the possible role of 2 genes, namely PRAME (Preferentially expressed Antigen in Melanoma) and Ect2 (Epithelial cell transforming sequence 2) in chemo therapeutic drug response modulation in primary RB tissues.
Materials and Methods
The study was reviewed and approved by the institutional ethics committee of Vision Research Foundation, Sankara Nethralaya (Chennai, India). Consents signed by the guardians (as patients are minors) for both diagnosis and research were obtained for the patients who were included in the study. The snap frozen RB tumors (n = 3) and snap frozen retinal samples (n = 2) collected from 2 cadaveric eyeball (received at C U Shah eye bank, Sankara Nethralaya) during 2009–2010 were included for the gene expression studies. The tumor samples were collected from the enucleated eyeballs received at Larsen and Toubro, Department of Ocular Pathology, Sankara Nethralaya. Table 1 shows the clinicopathological descriptions of the RB tumors included in the microarray gene expression profiling. The differentially expressed genes from the microarray analyses, selected based on the earlier reports were validated in other RB tumors (n = 21) by real-time polymerase chain reaction (qRT-PCR) and immunohistochemistry. Paraffin embedded tissue blocks from 21 patients with RB from the year 2009 to 2011 with median age of 2.6 years were retrieved for PRAME protein expression studies by immunohistochemistry. Clinical and pathological information was obtained from medical records and surgical pathology reports respectively.
Table 1.
Clinico-pathological features of retinoblastoma tumor tissues included in the whole genome expression studies by cDNA microarray.
| S. no | Age/sex | Clinicopathological features | Chemotherapy |
|---|---|---|---|
| 1 | 3 Y/male | OD: UD, no invasion into the choroid and ON | 11 cycles |
| 2 | 1 Y/F | OD: UD, endophytic, no choroidal invasion | No chemotherapy |
| 3 | 2.5 Y/M | OS: UD, no invasion of choroid, sclera and ON | 9 cycles |
Abbreviations: UD, Undifferentiated; ON, Optic nerve; OD, Right eye; OS, Left eye; M, Male; F, Female.
Histopathology
All the tumors were grouped into A–E groups following International Intraocular Retinoblastoma Classification (IIRC).26 Haematoxylin and Eosin stained slides of these tumors were observed and classified as reported by Sastre, et al.27 The clinicopathological description of the RB included in the validation studies has been described in Table 3.
Table 3.
Clinico-pathological features of retinoblastoma tumor tissues and the percentage positivity of PRAME expression (immuno histochemical analysis), PRAME mRNA expression and ECT2 mRNA expression (qRT-PCR).
| Age/sex | Post-chemotherapy/pre-chemotherapy | Clinicopathological features | Percentage of positivity | PRAME mRNA expression | ECT2 mRNA expression |
|---|---|---|---|---|---|
| 3/M | NC | OS: UD, focal choroid invasion, pre liminar invasion of ON | 20% | −5.11 | 1.25 |
| 2/M | C (7 cycles) | OU: UD, focal choroid invasion <3 mm | 40% | 3.42 | 6.59 |
| 3/F | NC | OD: WD, focal choroid invasion <3 mm, pre laminar and laminar invasion of ON | 20% | −1.34 | 4.22 |
| 3/M | NC | OS: UD, NI | 80% | 12.21 | −5.00 |
| 2/M | C (8 cycles) | OD: UD, Full thickness invasion of choroid >3 mm, pre laminar and laminar invasion of ON | 80% | 5.77 | 2.08 |
| 2/M | NC | OS: PD, Diffuse full thickness choroid invasion >3 mm | 20% | −0.21 | −2.91 |
| 71/2/M | NC | OD: WD, focal choroid invasion | 70% | 6.50 | −3.70 |
| 10/F | C (9 cycles) | OU: UD, choroid invasion <3 mm | 80% | 3.19 | 4.04 |
| 3/F | C (10 cycles) | OU: WD, NI | 0 | −6.46 | 6.62 |
| 3/M | NC | OD: PD, diffuse choroidal invasion >3 mm tumor cells invading pre laminar, laminar and post laminar portion of ON | 10% | −3.87 | −5.08 |
| 21/2/F | NC | OS: WD, focal choroidal invasion | 70% | 2.90 | 0.19 |
| 1/M | NC | OS: PD, NI | 10% | −2.07 | −9.57 |
| 3/F | C (17 cycles) | OU: UD, NI | 0 | −1.34 | 4.87 |
| 1/F | NC | OS: PD, focal choroidal invasion of <3 mm full thickness invasion of pre laminar laminar and post laminar region ON | 60% | 1.92 | −0.67 |
| 1.8/M | NC | OD: UD full thickness choroidal invasion >3 mm pre laminar laminar and post laminar invasion of ON | 40% | 1.09 | −1.12 |
| 2/M | C (9 cycles) | OD: PD, focal choroidal invasion <3 mm tumor cells invading pre laminar laminar and post laminar region of ON | 60% | 4.50 | 0.78 |
| 5 months/F | NC | OS: MD, Choroidal invasion >3 mm pre laminar invasion of ON | 30% | −0.34 | −0.23 |
| 1/F | NC | OS: WD, focal chroidal invasion <3 mm | 20% | −0.05 | −4.27 |
| 4/F | C (5 cycles) | OS: UD, focal RPE invasion | 30% | 1.32 | 6.60 |
| 4/F | C (7 cycles) | OD: PD, NI | 20% | 1.24 | 6.88 |
| 4/M | C (20 cycles) | OD: PD, focal choroidal invasion >3 mm, tumor cells invading pre laminar laminar and post laminar region of ON | 0 | 0.93 | 0.98 |
Abbreviations: C, post-chemotherapy RB tumor tissues; NC, pre-chemotherapy RB tumor tissues; WD, Well differentiated; PD, Poorly differentiated; UD, Undifferentiated; ON, optic nerve; OD, Right eye; OS, Left eye; OU, Both eyes; M, Male; F, Female.
Oligonucleotide microarray analysis
Three RB fresh tumor tissues (n = 3) and 2 normal adult retina samples were subjected to oligonucleotide microarray using U133 Affymetrix gene platform. For the microarray analysis, the 3 RB tumour tissues were processed in triplicate. Total RNA was extracted using TRIZOL reagent (Invitrogen, Carlsbad, CA) and treated with TURBO DNase (Ambion, Genetix Biotech Asia Pvt. Ltd., New Delhi, India) to remove the DNA. The RNA samples (10 μg each) in a 50 μL reaction were treated with 1 μL of TURBO DNase (2 U) in 1 × TURBO DNase buffer at 37 °C for 30 minutes. Followed by the incubation, the RNA sample was extracted with phenol/chloroform to inactivate TURBO DNase. The samples were amplified from 200 ng of total RNA in accordance with the WT Expression assay kit (Ambion, Genetix Biotech Asia Pvt. Ltd., New Delhi, India). Further, the cRNA was fragmented and end labeled in accordance with the Affymetrix® GeneChip® WT Terminal Labeling protocol. The prepared targets were hybridized overnight to Affymetrix Human Gene 1.0 ST Genechip. Following hybridization, the arrays were washed and stained using the GeneChip Fluidics Station 450 and scanned using the GeneChip Scanner 3000 7G as recommended by the manufacturer (Affymetrix Technologies, Santa Clara, CA).
Microarray data acquisition and preprocessing
Raw data was obtained as .CEL and .CHP format using GCOS software. Agilent Technologies GeneSpring GX v 12.0 was used to process the raw data. Probeset summarization was done using ExonRMA16 algorithm with confidence level set at 100%. Intrasample normalization was done by the quantile method and baseline transformation was done by taking the median of all samples. The HuGene 1.0 ST Genechip comprises 28,869 well-annotated genes with 764,885 distinct probes. The design of the Human Gene 1.0 ST Array was based on the March 2006 human genome sequence assembly (UCSC Hg18, National Center for Biotechnology Information (NCBI) build 36) with comprehensive coverage of RefSeq, Ensembl, and putative complete CDS GenBank transcripts. The Human Gene 1.0 ST Array has greater than 99% coverage of NM sequences present in the November 3, 2006, RefSeq database.
Differential gene expression analysis
Volcano plot based method was used to find out genes that are differentially expressed between 2 conditions. Volcano plots allow easy comparison between the “double filtering” gene selection criteria and “single filtering” or “joint filtering” criteria.28 Genes whose log fold change is +2 and above is considered as upregulated and −2 and below as downregulated. Filtering of differentially expressed genes was done by applying unpaired Student t test with a P value cutoff of <0.05. To the filtered list of differentially expressed genes, the Benjamini Hocheberg method was applied to calculate the false discovery rate (FDR). Differentially expressed genes in RB tumors were identified in comparison with normal retina, and for post-chemotherapy treated tumors, it was done in comparison with pre-chemotherapy treated RB tumors. Further unsupervised hierarchical clustering of differentially expressed genes was done by applying the Pearson uncentered algorithm with average linkage rule.
Gene ontology, phenotype, biomarkers, and pathway enrichment analysis
GOElite tool (www.genmapp.org/go_elite) was used for enrichment analysis of biological processes dysregulated by differentially expressed genes. Significant biological processes were filtered out based on categories with a P value of <0.05 along with one or more of the following criteria: z score (>2.0) or q-value (<0.1).
Biological analysis network modeling
Information pertaining to protein-protein interaction along with biological processes involved for the differentially expressed genes was collated to identify key genes that can act as biomarkers for treatment response and tumor profile. Protein-protein interaction data for gene list in each group were obtained from the MiMi database (mimi.ncibi.org). Further, Cytoscape V 8 was used to model the biological network with emphasis on proteins that are significantly connected to the network (>10 edges) to understand their role and significance.
PRAME/Ect2 mRNA quantification using quantitative real-time polymerase chain reaction (qRT-PCR)
Total RNA was isolated using RNeasy Mini Kit including DNase digestion (Qiagen, Hilden, Germany). The amount of RNA was measured by nanodrop, and a stock solution of 2 μg RNA in 20 μL was prepared. RNA was transcribed into cDNA using Omniscript (Qiagen, Hilden, Germany). Quantitative PCR was performed using the ABI Prism 7500 Sequence Detector (Applied Biosystems, Lab India, Chennai, India). Primers and Taq-Man probes for GAPDH, MRP1, and PRAME were used. Final concentration of the TaqMan probes was 100 nM. All TaqMan probes were labeled with 6-carboxy fluorescein (FAM) and 6-carboxytetramethyl rhodamine (TAMRA). The expression of the PRAME and Ect2 was normalized with the expression of glyceraldehyde phospho-dehydrogenase (GAPDH), which was measured using Pre-Developed Assay Reagents (Applied Biosystems, Invitrogen, Carlsbad, California, USA). The final volume for each PCR was 20 μL including 1 μL (100 ng) of the investigated sample. Universal PCR Master Mix (Applied Biosystems, Invitrogen, California, USA) was used according to the manufacturer’s instructions.
Ect2 expression was determined using the following primer sequence: FP: 5′ACTAGCTTGGCAGACTCTTC3′; RP: 5′TCCTGAAAGTCCGTGACTAC3′. The extraction of total RNA and the cDNA conversion was performed as described above. The final volume for each PCR was 20 μL, which consisted of 1 μL (100 ng) of the investigated sample in 1X Universal RT2 Real Time TM SyBr Green/ROX PCR master Mix (catalogue number: 330520, Valencia, California, SABiosciences, USA) in accordance with the manufacturer’s instructions. The expression of each gene in each sample was analyzed in triplicate for statistical comparisons.
Immunohistochemistry
Immunohistochemistry was performed on 4 mm thick formalin fixed, paraffin embedded sections mounted on (3-aminopropyl) triethoxy silane coated slides. After deparaffinization and rehydration, endogenous peroxidase activity was quenched by incubation in 3% H2O2 for 10 minutes at room temperature. Pretreatment in a pressure cooker (20 minutes) using citrate buffer (0.1 M citric acid and 0.1 M trisodium citrate in distilled water, pH 6.0) for PRAME protein was performed to unmask epitopes. Next, the sections were incubated in normal rabbit serum (1:50 in 1% phosphate buffered saline bovine serum albumin) and then with the optimally diluted specific antibody (1:50 in 1% phosphate buffered saline) for 16 hours at 4 °C in a humidified chamber. The polyclonal antibody PRAME (catalogue number: ab32185, Abcam Laboratories, Cambridge, UK) was detected by the Biogenex polymer and System horseradish peroxidase (BioGenex, San Ramon, California, USA) for overnight. Bound peroxidase was developed with diaminobenzidine (DAB) and hydrogen peroxide and counterstained with haematoxylin.
Immunoreactivity scoring
Two observers without knowledge of the clinical data independently assessed the expression of PRAME. The distribution of PRAME expression was semiquantitatively assessed by estimating the percentage of positively stained cells. Randomly, 10 tumor fields were scanned for protein expression under 40%, and percentage of positive tumor cells were noted for each field. Then the average expression was calculated from the 10 values for the entire slide. Depending on the percentage of positive cells, 4 categories were established: 0, no positive cells; 1+, positive cells in less than one-third; 2+, positive cells in 33% to 67%; and 3+, positive cells in more than two-thirds of total tumor cell population.29
Statistical analysis
For microarray analysis, the Benjamini and Hochberg algorithm was used to derive statistical t test and P value based on volcano plot. A P value ≤ 0.05 was considered significant for change in gene expression. Log2 transformed values of gene expression changes showing ≥1.0 fold were considered upregulation, while ≤1.0 fold change in gene expression was considered downregulation.
For immunohistochemistry analysis, the paired samples t test was used to derive the statistical significance. Statistical analysis was performed to correlate PRAME expression with invasion and differentiation of tumors. For statistical analysis, moderately differentiated and well-differentiated tumors were compared with poorly differentiated tumors. Mann–Whitney U test revealed statistically nonsignificant association of PRAME protein expression with respect to tumor invasiveness (P value = 0.715) and tumor differentiation (P value = 0.201). For the comparison of the chemotherapeutics (IC50) in PRAME transfected and untransfected RB (Y79) cells, Student t test was used to derive the P value.
Transient transfection
Human RB cell line (Y79, ATCC, USA) cultured in RPMI 1640 medium (Rosewell Park Memorial Institute; Gibco Rockville, MD, USA) with 10% heat-inactivated fetal bovine serum (FBS) (Gibco BRL (Rockville, MD), 0.1% ciprofloxacin, 2 mM L-glutamine, 1 mM sodium pyruvate, and 4.5% dextrose (Sigma Aldrich, St. Louis, MD, USA) as supplements were used in the study. The cultures were grown as suspension at 37 °C with 5% CO2. Transient overexpression of PRAME gene (PRAME cDNA, NM_206955.1) cloned into the pcDNA3.1 vector was purchased from OriGene Technologies, Inc. (Rockville, MD, USA) was established in a 6 well cell culture plate with 250,000 cells/well, 2.0 μg plasmid DNA, and 6.0 μg of lipofectamine 2000 (Invitrogen, Carlsbad, California, USA) as per the manufacturer’s protocol. The transfected cells were collected after 48 hours of incubation for the further experiments.
IC50 determination of 3 chemotherapeutic drugs
After 48 hours of transfection, the cell proliferation assay using 3-(4,5-Dimethylthiazol-2-yl)-2,5-diphenyltetrazolium bromide (MTT; Sigma, St Louis, MO) was performed in triplicates with 8000 cells per well in 96-well plate in complete growth medium containing concentrations of 25, 30, 35, 40, 45 μg/mL for carboplatin, 0.5, 1.0, 1.5, 2.0 μg/mL for vincristine and 2.5, 5.0, 7.5, 10.0 μg/mL for etoposide and incubated further for 48 hours. The complete growth medium was replaced by 100 μL of MTT reagent (5 mg/mL). After the 4 hours of incubation at 37 °C, the reagent was replaced by 100 μL of dimethyl sulphoxide (DMSO) and incubated for 10 minutes at 37 °C. The absorbance was determined at 570 nm.
Results
Oligonucleotide microarray analysis in primary RB tumor tissues
Differentially expressed genes in RB tissues and chemotherapy treated RB tissues normalized to normal retina
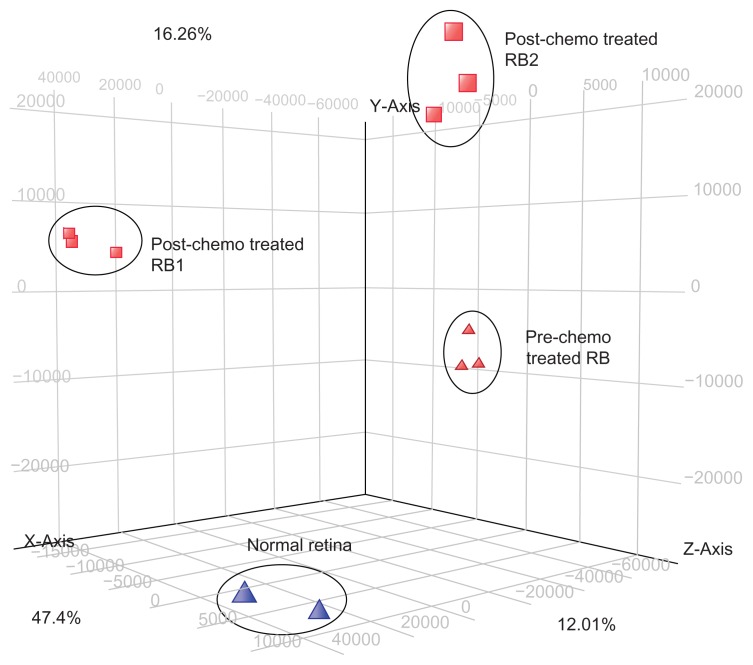
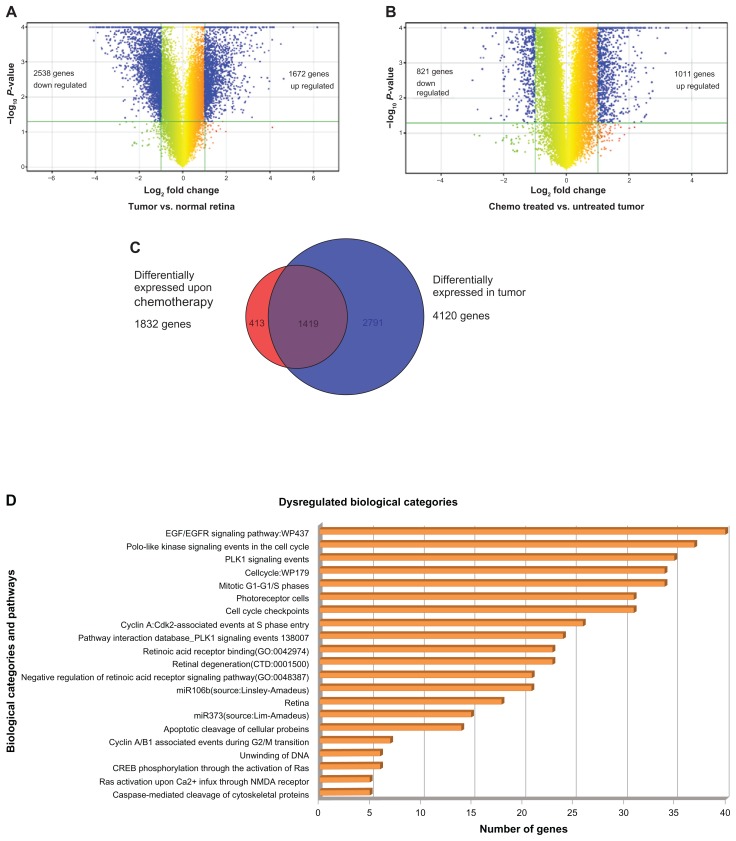
Principal component analysis (PCA) showed replicate samples under each condition were grouping together. Normal, prechemotherapy RB tumor samples are distinctively different from post-chemotherapy RB tumor tissues (Fig. 1). A fold change above 2.0 was considered upregulation in gene expression, while a log fold change below 2.0 was considered as downregulation. Volcano plot based method to identify differentially expressed genes showed that 2538 genes were downregulated and 1672 genes were upregulated in RB tumors in comparison with normal retina. We observed a downregulation of 821 genes and upregulation of 1011 genes in post-chemotherapy RB tumor tissues relative to prechemotherapy RB tumor tissues (Fig. 2A and B).
Figure 1.
The principal component analysis (PCA) of normal retina, RB tumor (pre-chemotherapy RB tumor tissue) and post-chemotherapy RB tumor tissues (RB1 and RB2). The PCA shows clustering of the gene profiles in groups respectively.
Figure 2.
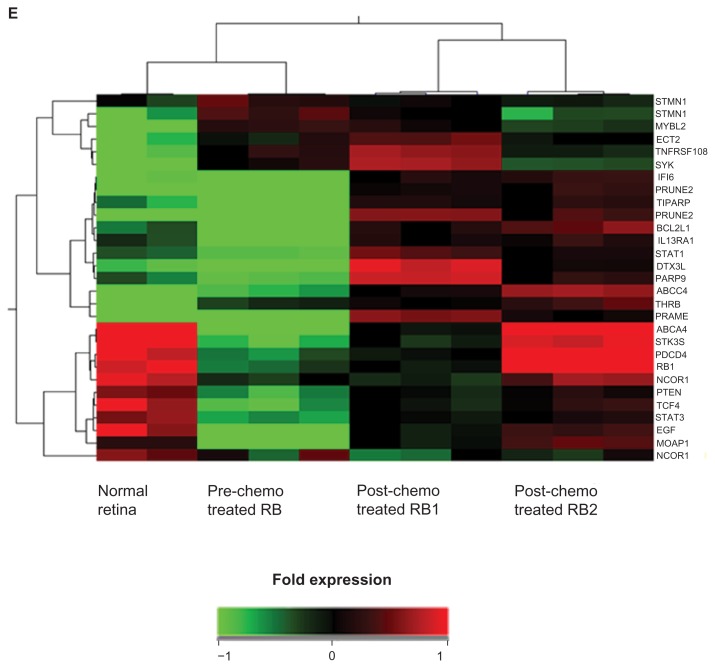
(A) The volcano plot showing differentially expressed 4210 genes (includes 1672 upregulated genes and 2538 downregulated genes) in number identified in the gene expression profiling of RB tumors compared with normal retina. (B) The volcano plot showing differentially expressed 1832 genes (includes 1011 upregulated genes and 821 downregulated genes) in number identified in the gene expression profiling of post-chemotherapy RB tumors compared with prechemotherapy RB. (C) Venn diagram representing distribution of differentially expressed genes upon chemo treatment and in tumor sample compared with normal retina. (D) Key biological categories and pathways that were dysregulated in the RB tumors. (E) The heat map represents the expression profile of 15 differentially expressed genes in RB (pre-chemotherapy treated RB, post-chemotherapy treated RB1 and post-chemotherapy treated RB2) compared with normal retina. The horizontal lines represent the relative fold change in the expression of individual genes. Green and red indicate increased and decreased gene expression, respectively, while yellow represents normal expression.
Comparison of differentially expressed genes between prechemotherapy RB tumor tissue and post-chemotherapy RB tumor tissues
Unsupervised hierarchical clustering of differentially expressed gene sets in pre-chemotherapy RB tumor tissue revealed 2791 genes deregulated relative to normal retinae. Out of this, 1419 gene expressions overlapped with the post-chemotherapy group. In addition, 413 genes were differently deregulated only in post-chemotherapy RB tumor tissues (Supplementary File 1, Fig. 2C).
Significantly dysregulated biological categories and pathways
GoElite analysis of merged differentially expressed genes resulted in identification of 21 key gene ontology categories, pathways, biomarkers, and phenotype groups dysregulated, harboring 250 differentially expressed genes. Some of the key biological categories include (1) caspase-mediated cleavage of cytoskeletal proteins, (2) Ras activation uopn Ca2+ infux through NMDA receptor, (3) cyclin A/B1 associated events during G2/M transition, (4) retinal degeneration, (5) PLK1 signaling events and (6) EGF/EGFR signaling pathway (Fig. 2D). Key gene families that were dysregulated included (1) aurora kinases, (2) cyclins, (3) cell division cycle genes, (4) centromere proteins, (5) guanylate cyclases, (6) minichromosome maintenance (MCMs), (7) origin recognition complex (ORCs), and (8) PRAME families (PRAMEF). From this, the genes that are functionally relevant to the scope of this study have been presented in (Supplementary File 1).
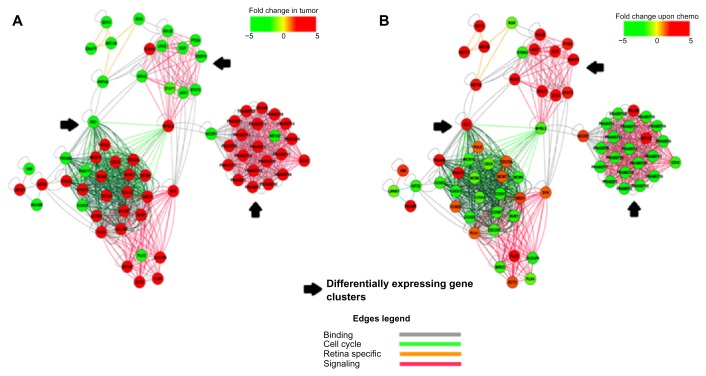
Figure 2E represents the heat map of the gene expression profile of 28 dysregulated genes in RB tumors compared with normal retina. Green and red indicates increased and decreased expression, respectively, in relation to normal expression (yellow). Significantly dysregulated biological processes were grouped as cell cycle process, retina-specific gene expression, and signal transduction. Protein-protein interactions were classified as binding. Differentially expressed genes were considered as nodes, and processes and binding were considered as edges that connect the nodes. Clustering using Cytoscape V 8.0 showed distinct gene and biological process clusters where all the PRAMEFs were clustered together and MCMs and CCNs clustered in 1 group. Figure 3A and B present the key regulatory networks that underlie the differential gene expression between pre-chemotherapy and post-chemotherapy RB tumour tissues. Additional details on these gene expressions and their biological process are provided as Supplementary File 1. The data discussed here have been deposited in NCBI Gene Expression Omnibus (GEO) and are accessible through GEO series accession number GSE24673.
Figure 3.
Protein interaction and regulatory network showing genes and biological process clustering (obtained using cytoscape V 8.0) underlying chemo treatment change versus tumor profile (A) post-chemotherapy and (B) pre-chemotherapy treated RB tumors.
Immunostaining of PRAME in primary RB tumor tissues
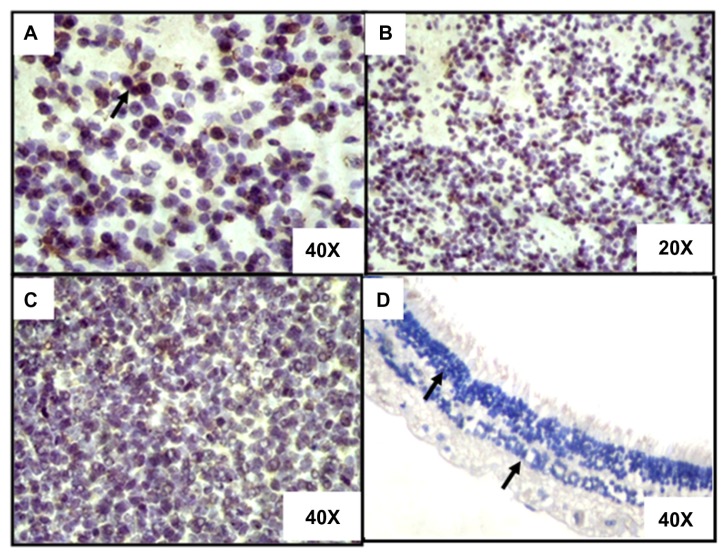
Nucleocytoplasmic positivity of PRAME protein in 19 out of 21 RB tumors was in the following order: higher expression in 5 tumors (5 out of 21 corresponding to 23.80%), moderate expression in 4 tumors (4 out of 21 corresponding to 19.04%), less expression in 9 (9 out of 21 RB tumors corresponding to 42.85%), and absent in 3 RB tumors (Fig. 4). There was neither any correlation between PRAME protein expression and tumor invasion, nor was there any correlation with chemotherapy status.
Figure 4.
Immunohistostaining of 3 representative RB tumor tissues compared with nonneoplastic retina (DAB staining with hematoxylin counter staining). (A) The photomicrograph shows the strong nuclear expression of PRAME (arrows show positivity) in a RB tumor (40× magnification). (B) The photomicrograph shows the strong nuclear expression of PRAME (arrows show positivity) in a RB tumor (20× magnification). (C) The photomicrograph shows lesser percentage of nuclear of PRAME (arrows show positivity) in a RB tumor (40× magnification). (D) The photomicrograph shows the negative expression of PRAME (arrows show negativity) in the retinal layers (40× magnification).
Ect2 mRNA expression analyzed by qRT-PCR in primary RB tumor tissues
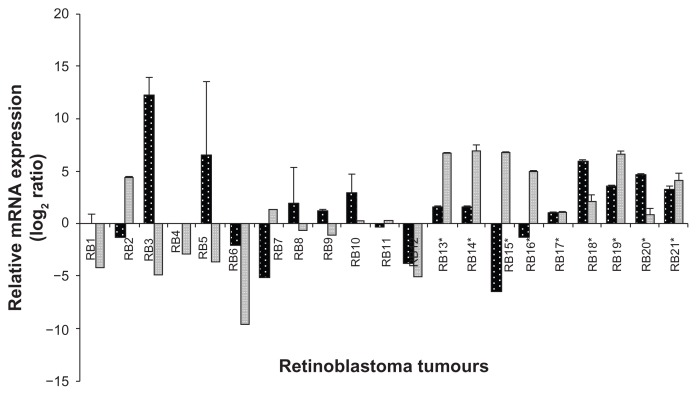
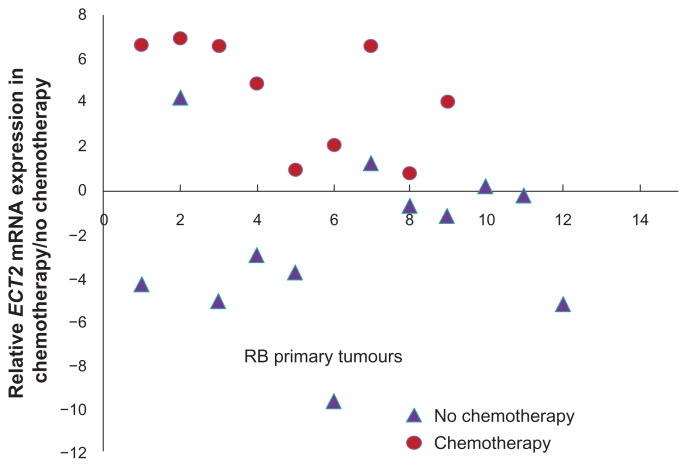
Ect2 mRNA expression was detected in 9 out of 21 (42.87%) tumors. Out of this cohort, 7 out of 9 post-chemotherapy treated RB showed a marked positivity (77.77%) while the remaining pre-chemotherapy group showed low to high positivity (2 out of 12, corresponding to 16.66%). The downregulation of Ect2 mRNA was observed in 6 out of 12 pre-chemotherapy treated RB tumors (corresponding to 50%). No significant fold change in expression was observed in 6 RB tumors (which included 4 out of 12 prechemotherapy RB tumors [33.33%] and 2 out of 9 post-chemotherapy RB tumors [22.22%]) (Fig. 5).
Figure 5.
The mRNA expression of PRAME (grey bar) and Ect2 (black bar) analyzed by real time quantitative reverse transcriptase PCR (qRT-PCR). Values are expressed as mean ± SD of triplicate analyses. *Indicates the post-chemotherapy RB tumor tissues.
PRAME expression analyzed by qRT-PCR in primary RB tumors and in PRAME overexpressed RB cells
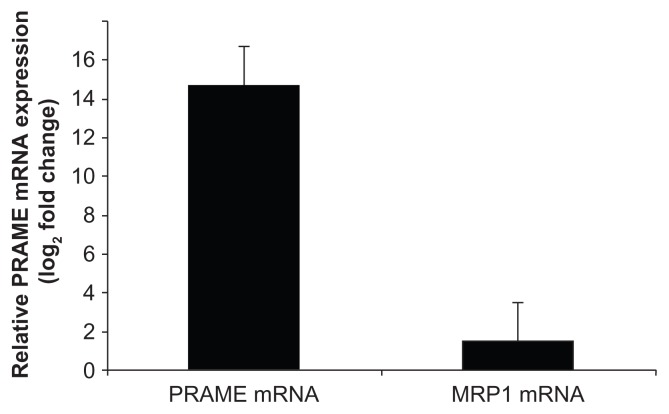
The RB primary tumors cohort showed PRAME mRNA expression in 11 tumors (52.38%), downregulation in 6 tumors (28.57%), while there was no significant fold change in 4 RB tumors (19.04%). In the transfected cells, PRAME gene expression was estimated to be 14.67 log2 fold change, while MRP1 showed 1.538 log2 fold changes, which was nonsignificant when compared woth PRAME by qRT-PCR (Fig. 6). Table 2 shows the clinicopathological features, percentage of positivity, and log2 fold change of PRAME expression in RB tumors.
Figure 6.
qRT-PCR analysis of the relative mRNA expression of PRAME and MRP1 gene in PRAME vector transfected Y79 (retinoblastoma cell line) normalized with untransfected Y79 cells.
Table 2.
Significantly dys- regulated genes determined by Microarray analysis.
| Gene description | Gene symbol | Accession number | Chromosomal location | Mean fold change (log2 ratio) | |
|---|---|---|---|---|---|
|
| |||||
| Post-chemotherapy treated RB tumors | Pre-chemotherapy treated RB tumor | ||||
| Modulator of apoptosis 1 | MOAP1 | NM_022151 | chr14 | 2.75 | 2.81 |
| Programmed cell death 4 (neoplastic transformation inhibitor) | PDCD4 |
NM_145341 NM_014456 |
chr10 | 2.11 | 2.66 |
| TCDD-inducible poly(ADP-ribose) polymerase | TIPARP | NM_015508 | chr3 | 2.71 | 1.599 |
| Poly (ADP-ribose) polymerase family, member 9 | PARP9 | NM_031458 | chr3 | 2.64 | 1.35 |
| Signal transducer and activator of transcription 1 | STAT1 |
NM_007315 NM_139266 |
chr2 | 2.22 | 1.41 |
| Signal transducer and activator of transcription 3 | STAT3 | NC_000017 | chr17 | 1.60 | 2.39 |
| Prune homolog 2 (Drosophila) | PRUNE2 | NM_138818 | chr9 | 6.52 | 2.24 |
| Stathmin1 | STMN1 | NC_000001 | chr1 | 1.51 | 2.27 |
| EGF epidermal growth factor | EGF | NC_000004 | chr4 | 1.16 | 2.05 |
| Interferon, alpha-inducible protein 6 | IFI6 |
NM_002038 NM_022872 |
chr1 | 4.33 | 1.94 |
| Transcription factor 4 | TCF4 | NM_003199 | chr18 | 1.80 | 3.11 |
| Serine/threonine kinase 35 | STK35 | NM_080836 | chr20 | 2.29 | 4.98 |
| ATP-binding cassette, sub-family C (CFTR/MRP), member 4 | ABCC4 | NM_005845 | chr13 | 2.17 | 1.75 |
| BCL2-like 1 | BCL2L1 |
NM_138578 NM_001191 |
chr20 | 3.80 | 2.25 |
| Preferentially expressed antigen in melanoma | PRAME |
NM_206953 NM_006115 |
chr22 | 5.57 | 5.78 |
| ATP-binding cassette, sub-family A (ABC1), member 4 | ABCA4 | NM_000350 | chr1 | 3.42 | 8.32 |
| Interleukin 13 receptor, alpha 1 | IL13RA1 | NM_001560 | chrX | ||
| Epithelial cell transforming sequence 2 oncogene | ECT2 | NM_018098 | chr3 | 1.16 | 2.05 |
| Thyroid hormone receptor, beta (erythroblastic leukemia viral (v-erb-a) oncogene homolog 2, avian) | THRB | NM_000461 | chr3 | 2.89 | 4.64 |
| Tumor necrosis factor receptor superfamily, member 10b | TNFRSF10B |
NM_003842 NM_147187 |
chr8 | 1.31 | 3.07 |
| Spleen tyrosine kinase | SYK | NM_003177 | chr9 | 1.05 | 3.97 |
| RB1 retinoblastoma 1 | RB1 | NC_000013 | chr13 | 1.97 | 2.77 |
| v-myb myeloblastosis viral oncogene homolog (avian)-like 2 | MYBL2 | NC_000020 | chr20 | 1.27 | 3.24 |
| Nuclear receptor corepressor 1 | NCoR1 | NC_000017 | chr17 | 1.28 | 2.04 |
| Phosphatase and tensin homolog | PTEN | NC_000010 | chr10 | 1.57 | 2.27 |
Comparison of IC50 of chemotherapeutics in PRAME transfected versus untransfected RB cells
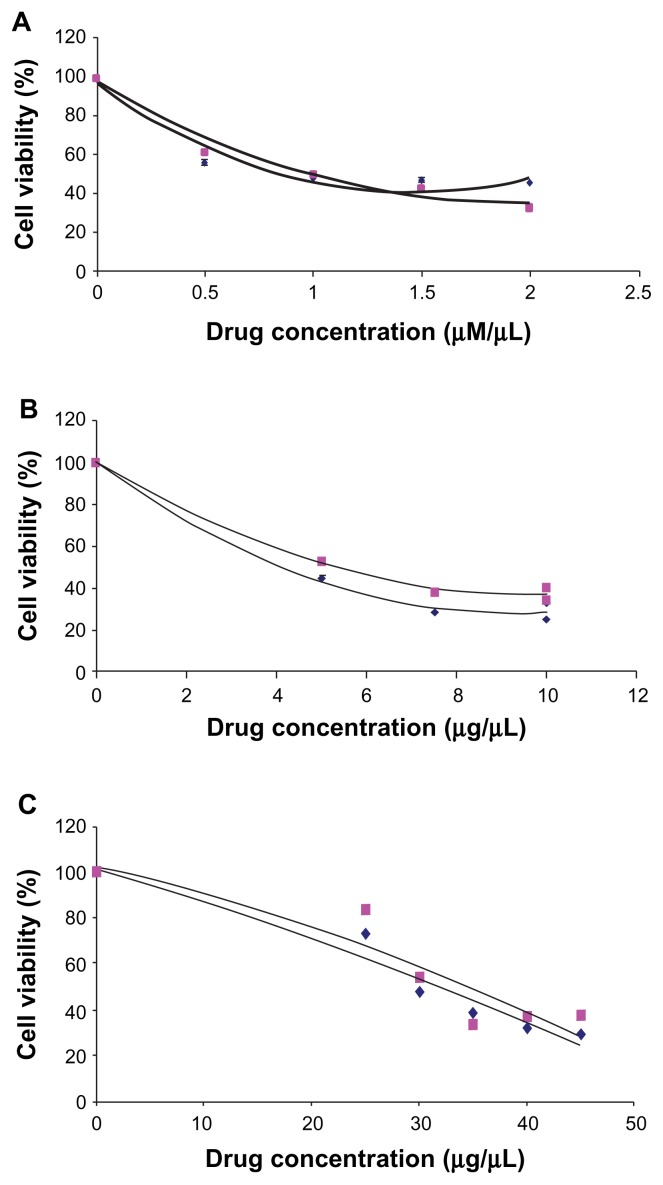
By polynomial regression analysis, the IC50 of 3 anticancer drugs were computed in both PRAME transfected and untransfected RB (Y79) cells. The IC50 of the carboplatin, vincristine, and etoposide in the transfected cells was 31.93 μg/mL, 0.86 μM/mL, and 4.13 μg/mL, respectively, and, in untransfected cells, the respective IC50 was 34.53 μg/mL, 0.97 μM/mL, and 5.23 μg/mL, respectively. The transfected and untransfected cells showed no significant change in the percentage of cell survival upon the 3 anticancer drugs treatment groups (vincristine: P value = 0.77; etoposide: P value = 0.20; and carboplatin: P value = 0.71) (Fig. 8A–C).
Figure 8.
(A) IC50 determination of vincristine in PRAME over expressed and control RB (Y79) cells. (B) IC50 determination of etoposide in PRAME overexpressed and control RB (Y79) cells. (C) IC50 determination of carboplatin in PRAME overexpressed and control RB (Y79) cells.
Discussion
Drug resistance in tumor is a complex phenomenon
Tumors can be intrinsically resistant to chemotherapy (even before treatment), or some chemo-sensitive tumors turn resistant due to chemotherapy (acquired chemotherapy resistance).30,31 This reflects the existence of some multifactorial components involving drug sensitivity, acceleration of drug efflux, activation, or inactivation of drugs, modification in drug targets and DNA methylation that contribute to drug resistance property.32 In order to address the drug resistance challenge observed in the clinical management of RB, there is an urgent need to identify the responsible genes in order to aid the prognostic stratification. The microarray assay, being a high throughput screening technology, was used here to understand the various gene alterations in post-chemotherapy RB.
The present study included the gene expression analysis of 2 RB tumor samples corresponding to 2 children who were subjected to 11 and 9 cycles of chemotherapy respectively (to represent the lack of chemotherapy sensitivity), and 1 RB tumor sample of a child who was not subjected to preoperative chemotherapy. These 2 experimental groups were compared with normal retinal gene expression to identify genes that could play a role in drug resistance in RB. Genes with a P value of ≤0.05 and log fold change of 2.0 or more for upregulation and log fold change of 2.0 and below for downregulation were considered for differential expression analysis.
Key regulatory genes in post-chemotherapy RB tumors
After normalization with donor retina, we observed 1419 genes in common between prechemotherapy and post-chemotherapy RB tumor tissues. In addition, we observed about 413 differentially expressed genes specific to post-chemotherapy RB tumors (Fig. 2C). By following a stringent criteria of statistical significance (P value ≤ 0.05, q-value ≤ 0.05, z score = >2), the biological pathway analysis revealed major cellular functions, namely apoptotic pathways, cell cycle check points, negative regulation of retinoic acid receptor signaling pathway, PLK1 signaling events, EGF/EGFR Signaling Pathway and Ras mediated pathway were dys-regulated. These pathways were known to be regulated by about 239 genes (determined by using the gene ontology data base). From this gene list, the biological analysis network (BAN) was modeled by mapping the key pathways, and intramolecular interaction data involving 75 genes was derived using cytoscape V 8.0 (Fig. 3A and B). Table 2 gives the list of few dysregulated genes significantly in the prechemotherapy and post-chemotherapy RB tumor tissues.
Earlier studies on differential gene expression between the normal retina and RB, and their canonical pathways, have implicated numerous genes as potential anticancer targets.13,14 Deregulation of PI3K/AKT/mTOR (insulin signaling) pathways has been reported.13 However, at present, not much information is available on drug resistance genes in post-chemotherapy RB tumors using cDNA gene expression analysis. Here, we observed the deregulation of the key genes involved in cell cycle (CCNA1, CCNA2, CCNB1, CCNB2, CCND2, CCNE2, CDC25C, CDC6, CDC25A, CDC25C), the cell cycle regulators (PLK1, PLK2, PLK4, PTEN), proapoptosis (survivin [BIRC5]), tumour suppressors (BUB1), and oncogenes (SYK, MYBL2, STMN1, and KRAS). Figure 3A and B (derived using cytoscape V 8.0) demonstrate the interacting nodes of all the above mentioned genes in both nonchemotherapy treated and chemotherapy treated RB. Taken together, the activation of cell cycle and inhibition of apoptotic cell death may form the basis for the cancer cell survival in resistant RB.
Multidrug resistance genes in RB
Previous studies have shown the expression of various drug resistant proteins such as P-gp, MRP1, and LRP in RB primary tumors.6 Reports indicate the expression of SRPK1 (a cisplatin-sensitivity-related protein), ABCG2, and MCM2 in RB chemotherapy resistance.9,10 In this context, various therapeutic approaches have been attempted by oncologists including the use of cyclosporine A (CSA), a drug resistance modulator, in their chemotherapy protocols for RB.2 Among the upregulated genes in the present study, the genes with a reported role in regulating drug resistance include ABCC4,33 spleen tyrosine kinase (SYK),34PRAME,35 and Ect2.36
While ABCC4 and SYK have reported implications in RB, there is no current evidence for the roles of PRAME, and Ect2 in RB. The ABCC4 gene encodes for the protein, which is a member of the superfamily of ATP-binding cassette (ABC) transporters. These ABC proteins transport various molecules across extracelluar and intracellular membranes. ABC genes are divided into 3 distinct subfamilies (ABC1, MDR/TAP, MRP, ALD, OABP, GCN20, and WHITE), and this protein is a member of MRP family, which is involved in multidrug resistance. ABCC4 gene expression in RB has been reported earlier.25 The (SYK), a proto-oncogene has been reported as one of the most upregulated kinase gene by the integrative analysis in RB by Zhang et al.34 In their study, strong expression of SYK (100%) in RB primary tumors was reported. Further, the treatment of RB cell lines (Weri Rb 1 and RB 355) with SYK inhibitors (BAY 61-3606 or R406) had resulted in the caspase mediated cell death, suggesting that the SYK could be a target for chemotherapeutic interventions in RB management.34,37
In the present study, response of Ect2 and PRAME was validated by qRT-PCR in the primary RB tumors (n = 9, post-chemotherapy, and n = 12, pre-chemotherapy). Surprisingly, there was no significant association of PRAME expression with chemotherapy status as observed in other childhood cancers such as leukemia.35 In order to rule out any direct effect of PRAME in drug response, comparative IC50 studies were carried out. Here again, the IC50 in PRAME overexpressed (transfected) RB cells was not significantly different from nontransfected RB cells. Following this confirmation, we set out to explore the interactive pathways associated with PRAME in order to identify any other role of PRAME, as it was localized in the cell nucleus.
Association of Ect2 and chemotherapy
Briefly, epithelial cell transforming sequence 2 (Ect2) functions as a guanine nucleotide exchange factor (GEF) 3 for Rho family (RhoA, Rac1, and Cdc42), regulating the cytokinesis.38–41 In normal cells, Ect2 is inactive, and it is activated during mitosis and cytokinesis by the presence of N-terminal regulatory domain that modulates its functional activity.39,40–44 Recent reports showed the overexpression of Ect2 among several human tumors and their differential role in cellular transformation and cytokinesis.45,46 In the current study, we observed an upregulation of Ect2 in the chemotherapy treated RB. Further, on validation of Ect2 expression, the study revealed 42.87% Ect2 expression in 9/21 RB tumor samples. There are reports that indicate the activation of Ect2 by genotoxic stress in other cancer types. Srougi et al36 have reported the increase in Rho B activity along with Ect2 after genotoxic stress in breast cancer cell lines, which have resulted in cell death. Further, Srougi et al36 have also reported that despite the presence of genotoxic stress, when there is loss of Ect2 expression along with reduced Rho B activity, there is a reduction in apoptosis. This confirms the pivotal role of Ect2 in accelerating cell death after cellular stress (induced by therapy). So the existence of higher expression of Ect2 (77%) in the RB tumor tissues (n = 9 post-chemotherapy treated) suggests the activation of Ect2 in these tumors, which may contribute to the chemotherapy induced cell death. In contrast, the prechemotherapy RB tumor tissue revealed Ect2 overexpression in 2 out of 12 tumors only (16.66%), as shown in Figure 7. Thus, these results prompt further study of Ect2’s role in mediating chemo sensitivity in RB.
Figure 7.
Schematic representation of Ect2 mRNA levels in retinoblastoma tumor tissues (green spheres represent post-chemotherapy RB tumor tissues, red spheres represent prechemotherapy RB tissues, and the blue line indicates fold change ± 2.0).
PRAME expression and RB
PRAME (preferentially expressed antigen in melanoma) was first detected as a tumor antigen in cells isolated from melanoma. High PRAME expression has been detected in 88% to 95% of primary melanomas.47 Previous studies have reported PRAME gene expression and its role in drug resistance in various tumors such as non-small cell cancer,48 breast cancer,49 leukemia,35 and melanoma,47 but its role in RB was not known. In the present study, PRAME gene was found to be upregulated in the RB tumor samples (prechemotherapy and post-chemotherapy RB tumor tissues) as revealed by microarray and qRT-PCR analysis. Immunohistochemistry revealed PRAME protein overexpression that was variable/heterogeneous in the primary tumor samples between the chemotherapy treated and non-chemotherapy treated groups. The expression of PRAME has been reported to be low or absent in normal tissues.50 We also observed lack of PRAME expression in normal cadaveric retina (Fig. 4D). No significant association of PRAME protein expression with respect to tumor invasion and chemotherapy status was observed.
Wilson et al25 showed 50% expression of MRP1 in RB samples. MRP1 is one of the MDR related genes. The present study revealed no significant correlation between PRAME and MRP1 expression (Fig. 6). To clearly define the role (if any) of PRAME in drug resistance, we determined IC50 of vincristine, etoposide, and carboplatin in RB cells overexpressed with PRAME gene. There was no marked change in the IC50 values in the PRAME overexpressed versus control RB cells (Y79), suggesting that PRAME does not have a direct role in drug resistance in RB. However, nuclear localization of the PRAME protein suggests that they could act as a transcription factor. To evaluate this, BAN analysis was performed as discussed below.
Network regulation of PRAME involving MYBL2 gene
Interaction of MYBL2 with RB1 and NCOR1
The biological process clustering (Fig. 3A and B) reveals that there exists a binding interaction between the PRAME and PRAME family with NCoR1 (nuclear receptor corepressor 1). The level of NCoR1 expression has increased in the post-chemotherapy RB compared with the prechemotherapy RB. The translocation of NCoR1 from nucleus to cytoplasm resulting in the transcriptional repression of its target genes in RB and human retinal progenitor cells (hRPCs) was discussed earlier by Nazha et al.51 Its role in cellular differentiation and tumorigenesis has been deciphered in few of the earlier studies.51,52 Earlier studies have reported the corepressor interaction between MYBL2 (B-Myb) and N-CoR1. In the present study, we could observe the downregulation of MYBL2, which may have resulted due to the activation of NCoR1 in the in the chemo-treated RB.53 Interestingly, we could observe the activation of RB1 in the absence/low levels of MYBL2 in the post-chemotherapy RB tumor tissues. In this linearity, the suppression of MYBL2 with activation of RB1 could be one of the molecular targets to be established. Our results corroborate with an earlier study on the MYBL2 inhibition contributing it as an important adjuvant to treatment of human hepatocellular carcinoma.54 Further studies on these molecules, NCoR1, MYBL2, and RB1, could explain their role at cellular level and their o be corrected as “interaction with each other molecules in contributing to RB tumorigenesis. The network analysis (Fig. 3A and B) also reveals a signaling interlinking between MYBL2 and JAK/STAT (JAK1, JAK2, STAT1, and STAT3). STAT1 and STAT3 are known for their dual role in tumorigenesis.55
Signaling interaction between PRAME family and EZH2 in retinoic acid receptors mediated pathway
EZH2 is known to be overexpressed in various cancers such as prostrate and breast and for its interaction with PRAME and TRAIL, enhancing the imatinib sensibility in CML.56 The silencing of EZH2 in uveal melanoma had resulted in the arrest of cell migration and invasion.57 In the current study, we observed the downregulation of EZH2, which acts as a key signaling regulator of PRAME and PRAME family (Fig. 3A and B). So the downregulation of EZH2 and PRAME family but not of PRAME in the post-chemotherapy RB tumor tissues strongly points towards further research on the role of PRAME in sensitising the RB cells to chemotherapy.
Conclusion
Differential gene analysis between post-chemotherapy and pre-chemotherapy treated RB tumors revealed several anti-apoptotic and procell survival gene expressions. The expressions of key genes namely MYBL2, NCoR1, STAMN, CHD9, CRY2, RHOC, and STAT1/STAT3 in the postchemotherapy RB tissues are reported. These results would widen the area of research in these gene regulations contributing either to chemotherapy resistance or to RB tumorigenesis. Further, the positive correlation between Ect2 and drug response modulation in RB reported here offers potential for further explorations at the molecular level. The overexpressed PRAME does not directly influence response of RB tumors to chemotherapy, which is substantiated by the lack of marked upregulation of MRP1 in PRAME overexpressed RB cell line and also by the lack of a substantial change in IC50 doses of standard chemotherapeutic drugs. The nuclear localization of overexpressed PRAME protein possibly implicates its role in gene regulation. The network analysis performed here presents some evidence for the regulatory role of PRAME in RB.
Supplementary File 1
The Microsoft Excel file provides the differentially expressed gene list and the significant biological categories revealed by BAN modeling.
Footnotes
Author Contributions
Conceived and designed the experiments: VN, SK, RS. Analyzed the data: VN, SK, PRD, MV. Wrote the first draft of the manuscript: VN, SK, PRD, MV. Contributed to the writing of the manuscript: VN, SK, PRD, MV, RS. Agree with manuscript results and conclusions: VN, SK, PRD, MV, RS, VK. Jointly developed the structure and arguments for the paper: SK, PRD, VN. Made critical revisions and approved final version: SK, PRD, VN, MV. All authors reviewed and approved of the final manuscript.
Competing Interests
Author(s) disclose no potential conflicts of interest.
Disclosures and Ethics
As a requirement of publication the authors have provided signed confirmation of their compliance with ethical and legal obligations including but not limited to compliance with ICMJE authorship and competing interests guidelines, that the article is neither under consideration for publication nor published elsewhere, of their compliance with legal and ethical guidelines concerning human and animal research participants (if applicable), and that permission has been obtained for reproduction of any copyrighted material. This article was subject to blind, independent, expert peer review. The reviewers reported no competing interests.
Funding
This work was funded by research grants from the Department of Biotechnology (DBT), India (Grant Identification Number: 102/IFD/PR1621/2008-2009) and Indian Council of Medical Research (ICMR), India (Grant Identification Number: 5/4/6/3/NE/06-II).
References
- 1.Dhar SU, Chintagumpala M, Noll C, Chevez-Barrios P, Paysse EA, Plon SE. Outcomes of integrating genetics in management of patients with retinoblastoma. Arch Ophthalmol. 2011;129(11):1428–34. doi: 10.1001/archophthalmol.2011.292. [DOI] [PubMed] [Google Scholar]
- 2.Friedman DL, Himelstein B, Shields CL, et al. Chemoreduction and local ophthalmic therapy for intraocular retinoblastoma. J Clin Oncol. 2000;18(1):12–7. doi: 10.1200/JCO.2000.18.1.12. [DOI] [PubMed] [Google Scholar]
- 3.Anteby I, Ramu N, Gradstein L, Miskin H, Pe’er J, Benezra D. Ocular and orbital complications following the treatment of retinoblastoma. Eur J Ophthalmol. 1998;8(2):106–11. doi: 10.1177/112067219800800210. [DOI] [PubMed] [Google Scholar]
- 4.Chan HS, DeBoer G, Thiessen JJ, et al. Combining cyclosporin with chemotherapy controls intraocular retinoblastoma without requiring radiation. Clin Cancer Res. 1996;2(9):1499–508. [PubMed] [Google Scholar]
- 5.Chan HS, Thorner PS, Haddad G, Gallie BL. Multidrug-resistant phenotype in retinoblastoma correlates with P-glycoprotein expression. Ophthalmology. 1991;98(9):1425–31. doi: 10.1016/s0161-6420(91)32134-1. [DOI] [PubMed] [Google Scholar]
- 6.Krishnakumar S, Mallikarjuna K, Desai N, et al. Multidrug resistant proteins: P-glycoprotein and lung resistance protein expression in retinoblastoma. Br J Ophthalmol. 2004;88(12):1521–6. doi: 10.1136/bjo.2004.047928. [DOI] [PMC free article] [PubMed] [Google Scholar]
- 7.Kase S, Parikh JG, Rao NA. Expression of alpha-crystallin in retinoblastoma. Arch Ophthalmol. 2009 Feb;127(2):187–92. doi: 10.1001/archophthalmol.2008.580. [DOI] [PMC free article] [PubMed] [Google Scholar]
- 8.Kase S, Parikh JG, Rao NA. Expression of heat shock protein 27 and alpha-crystallins in human retinoblastoma after chemoreduction. Br J Ophthalmol. 2009;93(4):541–4. doi: 10.1136/bjo.2008.145508. [DOI] [PMC free article] [PubMed] [Google Scholar]
- 9.Mohan A, Kandalam M, Ramkumar HL, Gopal L, Krishnakumar S. Stem cell markers: ABCG2 and MCM2 expression in retinoblastoma. Br J Ophthalmol. 2006;90(7):889–93. doi: 10.1136/bjo.2005.089219. [DOI] [PMC free article] [PubMed] [Google Scholar]
- 10.Krishnakumar S, Mohan A, Kandalam M, Ramkumar HL, Venkatesan N, Das RR. SRPK1: a cisplatin sensitive protein expressed in retinoblastoma. Pediatr Blood Cancer. 2008;50(2):402–6. doi: 10.1002/pbc.21088. [DOI] [PubMed] [Google Scholar]
- 11.Sudhakar J, Venkatesan N, Lakshmanan S, Khetan V, Krishnakumar S, Biswas J. Hypoxic tumor environment in advanced retinoblastoma. Pediatr Blood Canc. 2013 doi: 10.1002/pbc.24599. In press. [DOI] [PubMed] [Google Scholar]
- 12.Mitra M, Kandalam M, Sundaram CS, et al. Reversal of stathmin-mediated microtubule destabilization sensitizes retinoblastoma cells to a low dose of antimicrotubule agents: a novel synergistic therapeutic intervention. Invest Ophthalmol Vis Sci. 2011;52(8):5441–8. doi: 10.1167/iovs.10-6973. [DOI] [PubMed] [Google Scholar]
- 13.Chakraborty S, Khare S, Dorairaj SK, Prabhakaran VC, Prakash DR, Kumar A. Identification of genes associated with tumorigenesis of retinoblastoma by microarray analysis. Genomics. 2007;90(3):344–53. doi: 10.1016/j.ygeno.2007.05.002. [DOI] [PubMed] [Google Scholar]
- 14.Ganguly A, Shields CL. Differential gene expression profile of retinoblastoma compared to normal retina. Mol Vis. 2010;16:1292–303. [PMC free article] [PubMed] [Google Scholar]
- 15.Schultz KR, Ranade S, Neglia JP, Ravindranath Y. An increased relative frequency of retinoblastoma at a rural regional referral hospital in Miraj, Maharashtra, India. Cancer. 1993;72(1):282–6. doi: 10.1002/1097-0142(19930701)72:1<282::aid-cncr2820720149>3.0.co;2-a. [DOI] [PubMed] [Google Scholar]
- 16.Murphree AL, Villablanca JG, Deegan WF, 3rd, et al. Chemotherapy plus local treatment in the management of intraocular retinoblastoma. Arch Ophthalmol. 1996;114(11):1348–56. doi: 10.1001/archopht.1996.01100140548005. [DOI] [PubMed] [Google Scholar]
- 17.Rodriguez-Galindo C, Wilson MW, Haik BG, et al. Treatment of metastatic retinoblastoma. Ophthalmology. 2003;110(6):1237–40. doi: 10.1016/S0161-6420(03)00258-6. [DOI] [PubMed] [Google Scholar]
- 18.Gallie BL, Budning A, DeBoer G, et al. Chemotherapy with focal therapy can cure intraocular retinoblastoma without radiotherapy. Arch Ophthalmol. 1996;114(11):1321–8. doi: 10.1001/archopht.1996.01100140521001. [DOI] [PubMed] [Google Scholar]
- 19.Schueler AO, Jurklies C, Heimann H, Wieland R, Havers W, Bornfeld N. Thermochemotherapy in hereditary retinoblastoma. Br J Ophthalmol. 2003;87(1):90–5. doi: 10.1136/bjo.87.1.90. [DOI] [PMC free article] [PubMed] [Google Scholar]
- 20.Uusitalo MS, Van Quill KR, Scott IU, Matthay KK, Murray TG, O’Brien JM. Evaluation of chemoprophylaxis in patients with unilateral retinoblastoma with high-risk features on histopathologic examination. Arch Ophthalmol. 2001;119(1):41–8. [PubMed] [Google Scholar]
- 21.Kingston JE, Hungerford JL, Madreperla SA, Plowman PN. Results of combined chemotherapy and radiotherapy for advanced intraocular retinoblastoma. Arch Ophthalmol. 1996;114(11):1339–43. doi: 10.1001/archopht.1996.01100140539004. [DOI] [PubMed] [Google Scholar]
- 22.Shields CL, Honavar SG, Shields JA, Demirci H, Meadows AT, Naduvilath TJ. Factors predictive of recurrence of retinal tumors, vitreous seeds, and subretinal seeds following chemoreduction for retinoblastoma. Arch Ophthalmol. 2002;120(4):460–4. [PubMed] [Google Scholar]
- 23.Shields CL, Shelil A, Cater J, Meadows AT, Shields JA. Development of new retinoblastomas after 6 cycles of chemoreduction for retinoblastoma in 162 eyes of 106 consecutive patients. Arch Ophthalmol. 2003;121(11):1571–6. doi: 10.1001/archopht.121.11.1571. [DOI] [PubMed] [Google Scholar]
- 24.Goldie JH. Drug resistance in cancer: a perspective. Cancer Metastasis Rev. 2001;20(1–2):63–8. doi: 10.1023/a:1013164609041. [DOI] [PubMed] [Google Scholar]
- 25.Wilson MW, Fraga CH, Rodriguez-Galindo C, Hagedorn N, Leggas ML, Stewart C. Expression of the multi-drug resistance proteins and the pregnane X receptor in treated and untreated retinoblastoma. Curr Eye Res. 2009;34(5):386–94. doi: 10.1080/02713680902859621. [DOI] [PubMed] [Google Scholar]
- 26.Linn Murphree A. Intraocular retinoblastoma: the case for a new group classification. Ophthalmol Clin North Am. 2005;18(1):41–53. viii. doi: 10.1016/j.ohc.2004.11.003. [DOI] [PubMed] [Google Scholar]
- 27.Sastre X, Chantada GL, Doz F, et al. Proceedings of the consensus meetings from the International Retinoblastoma Staging Working Group on the pathology guidelines for the examination of enucleated eyes and evaluation of prognostic risk factors in retinoblastoma. Arch Pathol Lab Med. 2009;133(8):1199–202. doi: 10.5858/133.8.1199. [DOI] [PubMed] [Google Scholar]
- 28.Li W. Volcano plots in analyzing differential expressions with mRNA microarrays. J Bioinform Comput Biol. 2012;10(6):1231003. doi: 10.1142/S0219720012310038. [DOI] [PubMed] [Google Scholar]
- 29.Detre S, Saclani Jotti G, Dowsett M. A “quickscore” method for immunohistochemical semiquantitation: validation for oestrogen receptor in breast carcinomas. J Clin Pathol. 1995;48(9):876–8. doi: 10.1136/jcp.48.9.876. [DOI] [PMC free article] [PubMed] [Google Scholar]
- 30.Kerbel RS, Kobayashi H, Graham CH. Intrinsic or acquired drug resistance and metastasis: are they linked phenotypes? J Cell Biochem. 1994;56(1):37–47. doi: 10.1002/jcb.240560108. [DOI] [PubMed] [Google Scholar]
- 31.Longley DB, Johnston PG. Molecular mechanisms of drug resistance. J Pathol. 2005;205(2):275–92. doi: 10.1002/path.1706. [DOI] [PubMed] [Google Scholar]
- 32.Wilson TR, Longley DB, Johnston PG. Chemoresistance in solid tumours. Ann Oncol. 2006;17(Suppl 10):x315–24. doi: 10.1093/annonc/mdl280. [DOI] [PubMed] [Google Scholar]
- 33.Wilson MW, Fraga CH, Fuller CE, et al. Immunohistochemical detection of multidrug-resistant protein expression in retinoblastoma treated by primary enucleation. Invest Ophthalmol Vis Sci. 2006;47(4):1269–73. doi: 10.1167/iovs.05-1321. [DOI] [PubMed] [Google Scholar]
- 34.Zhang J, Benavente CA, McEvoy J, et al. A novel retinoblastoma therapy from genomic and epigenetic analyses. Nature. 2012;481(7381):329–34. doi: 10.1038/nature10733. [DOI] [PMC free article] [PubMed] [Google Scholar]
- 35.Goellner S, Steinbach D, Schenk T, et al. Childhood acute myelogenous leukaemia: association between PRAME, apoptosis- and MDR-related gene expression. Eur J Cancer. 2006;42(16):2807–14. doi: 10.1016/j.ejca.2006.06.018. [DOI] [PubMed] [Google Scholar]
- 36.Srougi MC, Burridge K. The nuclear guanine nucleotide exchange factors Ect2 and Net1 regulate RhoB-mediated cell death after DNA damage. PLoS One. 2011;6(2):e17108. doi: 10.1371/journal.pone.0017108. [DOI] [PMC free article] [PubMed] [Google Scholar]
- 37.Murphree AL, Triche TJ. An epigenomic mechanism in retinoblastoma: the end of the story? Genome Med. 2012;4(2):15. doi: 10.1186/gm314. [DOI] [PMC free article] [PubMed] [Google Scholar]
- 38.Hara T, Abe M, Inoue H, et al. Cytokinesis regulator ECT2 changes its conformation through phosphorylation at Thr-341 in G2/M phase. Oncogene. 2006;25(4):566–78. doi: 10.1038/sj.onc.1209078. [DOI] [PubMed] [Google Scholar]
- 39.Niiya F, Tatsumoto T, Lee KS, Miki T. Phosphorylation of the cytokinesis regulator ECT2 at G2/M phase stimulates association of the mitotic kinase Plk1 and accumulation of GTP-bound RhoA. Oncogene. 2006;25(6):827–37. doi: 10.1038/sj.onc.1209124. [DOI] [PubMed] [Google Scholar]
- 40.Niiya F, Xie X, Lee KS, Inoue H, Miki T. Inhibition of cyclin-dependent kinase 1 induces cytokinesis without chromosome segregation in an ECT2 and MgcRacGAP-dependent manner. J Biol Chem. 2005;280(43):36502–9. doi: 10.1074/jbc.M508007200. [DOI] [PubMed] [Google Scholar]
- 41.Tatsumoto T, Xie X, Blumenthal R, Okamoto I, Miki T. Human ECT2 is an exchange factor for Rho GTPases, phosphorylated in G2/M phases, and involved in cytokinesis. J Cell Biol. 1999;147(5):921–8. doi: 10.1083/jcb.147.5.921. [DOI] [PMC free article] [PubMed] [Google Scholar]
- 42.Cook DR, Solski PA, Bultman SJ, et al. The ect2 rho Guanine nucleotide exchange factor is essential for early mouse development and normal cell cytokinesis and migration. Genes Cancer. 2011;2(10):932–42. doi: 10.1177/1947601912437035. [DOI] [PMC free article] [PubMed] [Google Scholar]
- 43.Justilien V, Jameison L, Der CJ, Rossman KL, Fields AP. Oncogenic activity of Ect2 is regulated through protein kinase C iota-mediated phosphorylation. J Biol Chem. 2011;286(10):8149–57. doi: 10.1074/jbc.M110.196113. [DOI] [PMC free article] [PubMed] [Google Scholar]
- 44.Kim JE, Billadeau DD, Chen J. The tandem BRCT domains of Ect2 are required for both negative and positive regulation of Ect2 in cytokinesis. J Biol Chem. 2005;280(7):5733–9. doi: 10.1074/jbc.M409298200. [DOI] [PubMed] [Google Scholar]
- 45.Salhia B, Tran NL, Chan A, et al. The guanine nucleotide exchange factors trio, Ect2, and Vav3 mediate the invasive behavior of glioblastoma. Am J Pathol. 2008;173(6):1828–38. doi: 10.2353/ajpath.2008.080043. [DOI] [PMC free article] [PubMed] [Google Scholar]
- 46.Sano M, Genkai N, Yajima N, et al. Expression level of ECT2 proto-oncogene correlates with prognosis in glioma patients. Oncol Rep. 2006;16(5):1093–8. [PubMed] [Google Scholar]
- 47.Ikeda H, Lethe B, Lehmann F, et al. Characterization of an antigen that is recognized on a melanoma showing partial HLA loss by CTL expressing an NK inhibitory receptor. Immunity. 1997;6(2):199–208. doi: 10.1016/s1074-7613(00)80426-4. [DOI] [PubMed] [Google Scholar]
- 48.Bankovic J, Stojsic J, Jovanovic D, et al. Identification of genes associated with non-small-cell lung cancer promotion and progression. Lung Cancer. 2010;67(2):151–9. doi: 10.1016/j.lungcan.2009.04.010. [DOI] [PubMed] [Google Scholar]
- 49.Epping MT, Hart AA, Glas AM, Krijgsman O, Bernards R. PRAME expression and clinical outcome of breast cancer. Br J Cancer. 2008;99(3):398–403. doi: 10.1038/sj.bjc.6604494. [DOI] [PMC free article] [PubMed] [Google Scholar]
- 50.Szczepanski MJ, DeLeo AB, Luczak M, et al. PRAME expression in head and neck cancer correlates with markers of poor prognosis and might help in selecting candidates for retinoid chemoprevention in pre-malignant lesions. Oral Oncol. 2013;49(2):144–51. doi: 10.1016/j.oraloncology.2012.08.005. [DOI] [PMC free article] [PubMed] [Google Scholar]
- 51.Nazha B, Granner T, Maloney S, Odashiro AN, Antecka E, Burnier MN., Jr Aberrant Nuclear Repressor Coreceptor 1 Localization in Human Retinoblastoma. Ophthalmic Res. 2013;49(4):171–6. doi: 10.1159/000345535. [DOI] [PubMed] [Google Scholar]
- 52.Jepsen K, Hermanson O, Onami TM, et al. Combinatorial roles of the nuclear receptor corepressor in transcription and development. Cell. 2000;102(6):753–63. doi: 10.1016/s0092-8674(00)00064-7. [DOI] [PubMed] [Google Scholar]
- 53.Li X, McDonnell DP. The transcription factor B-Myb is maintained in an inhibited state in target cells through its interaction with the nuclear corepressors N-CoR and SMRT. Mol Cell Biol. 2002;22(11):3663–73. doi: 10.1128/MCB.22.11.3663-3673.2002. [DOI] [PMC free article] [PubMed] [Google Scholar]
- 54.Calvisi DF, Simile MM, Ladu S, et al. Activation of v-Myb avian myeloblastosis viral oncogene homolog-like2 (MYBL2)-LIN9 complex contributes to human hepatocarcinogenesis and identifies a subset of hepatocellular carcinoma with mutant p53. Hepatology. 2011;53(4):1226–36. doi: 10.1002/hep.24174. [DOI] [PubMed] [Google Scholar]
- 55.Sara Pensa GR, Boselli Daniela, Novelli Francesco, Polianou Valeria. STAT1 and STAT3 in Tumorigenesis: Two Sides of the Same Coin? Landes Bioscience; 2009. [Google Scholar]
- 56.De Carvalho DD, Binato R, Pereira WO, et al. BCR-ABL-mediated upregulation of PRAME is responsible for knocking down TRAIL in CML patients. Oncogene. 2011;30(2):223–33. doi: 10.1038/onc.2010.409. [DOI] [PubMed] [Google Scholar]
- 57.Chen X, He D, Dong XD, et al. MicroRNA-124a is epigenetically regulated and acts as a tumor suppressor by controlling multiple targets in uveal melanoma. Invest Ophthalmol Vis Sci. 2013;54(3):2248–56. doi: 10.1167/iovs.12-10977. [DOI] [PubMed] [Google Scholar]
Associated Data
This section collects any data citations, data availability statements, or supplementary materials included in this article.


