Abstract
This paper presents the design, fabrication, and testing of a magnetophoretic bioseparation chip for the rapid isolation and concentration of CD4 + T cells from the peripheral blood. In a departure from conventional magnetic separation techniques, this microfluidic-based bioseperation device has several unique features, including locally engineered magnetic field gradients and a continuous flow with a buffer switching scheme to improve the performance of the separation process. Additionally, the chip is capable of processing significantly smaller sample volumes than conventional methods and sample losses are eliminated due to decreased handling. Furthermore, the possibility of sample-to-sample contamination is reduced with the disposable format. The overall dimensions of the device were 22 mm by 60 mm by 1 mm, approximately the size of a standard microscope slide. The results indicate a cell purity of greater than 95% at a sample flow rate of 50 ml/h and a cell recovery of 81% at a sample flow rate of 10 ml/h. The cell purity was found to increase with increasing the sample flow rate. However, the cell recovery decreases with an increase in the flow rate. A parametric study was also performed to investigate the effects of channel height, substrate thickness, magnetic bead size, and number of beads per cell on the cell separation performance.
INTRODUCTION
Magnetic separation is one of the effective ways to separate specific biological entities from their native environment for subsequent downstream analysis. The process involves the labeling of the desired biological entity with magnetic beads followed by separating the tagged entities via a magnetic separation device. The surface of the magnetic beads is usually coated with biocompatible molecules such as dextran, streptavidin, biotin, carboxyl groups, or amino groups. The target biological entity is then labeled by antibodies which specifically bind to their matching antigen on the cell surface and functionalized groups on the bead surface. Both biocompatible magnetic nanoparticles and microparticles can be used. These particles consist of a core of small iron oxide particles that are encapsulated by a polymer shell. The particles show superparamagnetic behavior. A superparamagnetic particle has no magnetic hysteresis loop, meaning that magnetization curves overlap when the magnetic field is increased or decreased. In the presence of an applied magnetic field, superparamagnetic particles are magnetized and experience an attractive force towards the magnetic field. However, when the external magnetic field is removed, the superparamagnetic particles behave like a non-magnetic material. Superparamagnetic particles are commercially available with many different types of biomolecules already immobilized on their surface. Biological entities such as DNA/RNA, proteins, bacteria, and cells can be attached to the bead surface.
Effective sorting of mammalian cells is important in many medical and biotechnological applications, and several methods for their isolation have been developed.1, 2, 3, 4, 5, 6, 7, 8 Magnetic separation can be used to isolate a particular cell for downstream analysis, or to enrich a cell type in preparation for flow cytometry.1 Additionally, magnetic separation has been successfully used to concentrate and detect target cells when the number of target cells in a sample is low.2 There are currently two main commercial methods for magnetic cell separation. Both technologies employ mixing cells with paramagnetic or superparamagnetic beads. Antibodies are used to tag cells of interest with micro/nano magnetic particles (e.g., Invitrogen, Miltenyi Biotec). In the tube-based method, magnetically labeled cells are retained on the inner wall of a tube by applying an external magnet, while the supernatant is decanted off. Removing the tube from the magnetic field enables resuspension of the labeled cells. In the column-based method, the sample is processed through a column that generates a magnetic field that retains magnetically labeled cells, while non-labeled cells flow through the column. Removal of the column from the magnetic field allows the retained cells to be eluted. Although widely used, there are limitations to the conventional magnetic cell separation techniques. For example, there is a significant cell loss due to multiple sample handling, washing, and transfer. In addition, manual cell separation systems are labor intensive and their effectiveness is user-dependent. Furthermore, the batch mode separation platforms cannot be integrated with other diagnostic systems.
While much research has been focused on developing magnetic cell separators at the macroscale level, microfluidic-based magnetic cell separation is relatively new. In the past few years, several microfluidic based magnetic sorting concepts have been investigated to capture magnetic beads or magnetically labeled cells.9, 10, 11, 12, 13, 14, 15, 16, 17, 18, 19, 20, 21, 22, 23 However, these devices are generally hampered by complex fabrication processes and low volumetric throughputs. In many earlier studies, flow rates were limited to less than 1 ml/h,9, 10 which are not practical for many real-world applications. The low flow rates in these studies were partially due to smaller channel dimensions and weaker magnetically induced flow velocities. In recent years, more sophisticated configurations have been employed that allow processing of larger flow rates comparable to the device developed in the present work. The cell isolation chip developed in this study offers better performance than the macroscale technologies. In addition, the throughput of the chip is significantly higher than the recently developed microfluidic devices.9, 10 Furthermore, other unique features of our chip, such as microscale field gradients and continuous flow with a buffer switching scheme enhance the purity and recovery of the target cells. Similar approaches have been demonstrated to locally concentrate the gradient of the applied magnetic field by integrating an array of NiFe (80% Ni and 20% Fe) microneedles24 and Ni microstructures25 to one side of a microfluidic channel. The use of microfluidic chips has been also demonstrated to measure the bladder cancer biomarker APOA1 in human urine26 and to enrich live cardiomyocytes from adult mouse hearts.27 Donolato et al.28 have recently described an on-chip magnetic particle conveyor for transport and separation of magnetic particles.
Integration of this microfluidic-based separation device with on-chip, downstream analysis modules could result in many unprecedented benefits. For instance, sample losses can be eliminated due to decreased handling and the possibility of sample-to-sample contamination is reduced with the disposable format. While the authors have not performed a quantitative sample loss analysis, in general, the use of a continuous flow on-chip cell separation can significantly reduce sample losses and simplify the system operation since multiple sample transfer, pipetting, and washes (associated with conventional tube-based systems) are eliminated. In addition, microfluidics allows for the use of smaller sample volumes and reagents which may be desirable in some settings and assay times are decreased, allowing for quicker decision-making. The present device can handle sample volumes as small as 50 μl, whereas the conventional tube-based systems often require a sample volume of 1 ml or more. Another advantage of the device is the ability to interface directly into a Lab-on-a-Chip (LOC) system with on-chip polymerase chain reaction (PCR) and detection systems. This can lead to a disposable bioseparation and detection system for point-of-care diagnostic testing and add value to the medical diagnostics, food safety, and biohazard industries, to name just a few.
THEORETICAL BACKGROUND
Figure 1 shows a schematic illustration of a magnetically labeled cell traveling through a microfluidic channel. In the presence of an external magnetic field, the cell experiences the hydrodynamic drag force (Fd), the gravitational force (Fg), and the magnetic force (Fm). Assuming that the magnetically labeled cell is spherical, the hydrodynamic drag force is given by Stokes' law
| (1) |
where η is the viscosity of the medium, Rp is the particle radius, and and are the velocities of the particle and fluid, respectively. The gravitational force is given by
| (2) |
where is the density of the particle, is the density of the fluid, and is the volume of the particle.
Figure 1.

Schematic illustration of the forces acting on a magnetic particle flowing through a channel in the presence of an applied magnetic field. If the magnetic force is greater than the hydrodynamic drag force, the labeled cell will be trapped and retained on the bottom of the channel.
The magnetic force acting on a magnetic particle in the presence of an applied magnetic field is given by29
| (3) |
where is the magnetic dipole moment of the particle and is the magnetic field. In a weakly diamagnetic medium such as a buffer solution, the dipole moment on the particle can be written as29
| (4) |
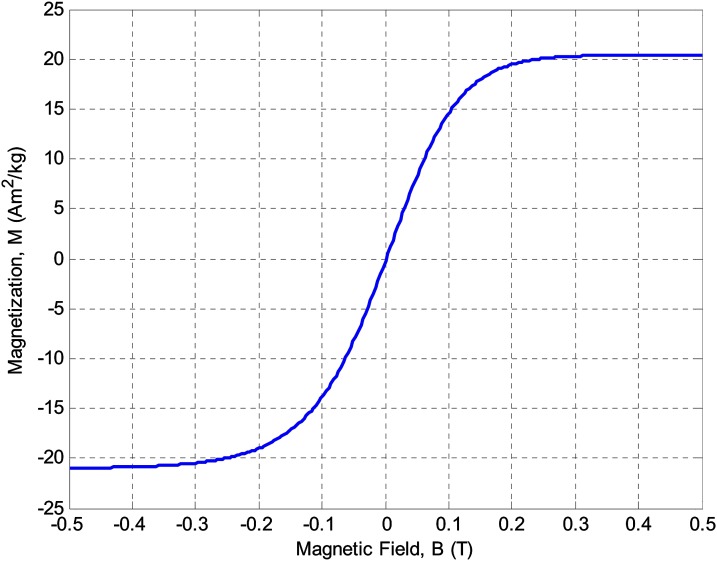
where is the volumetric magnetization of the particle. In general, the magnetization of the particle is a function of the applied magnetic field. However, as shown in Fig. 2, superparamagnetic particles such as magnetic beads are saturated at high magnetic fields (greater than 0.2 T) and their magnetization is independent of the applied magnetic field.30, 31 The magnetization data depicted in Fig. 2 correspond to Dynabeads (Invitrogen Corporation) used in the experiments. Dynabeads are superparamagnetic materials and do not have magnetic hysteresis. Thus, magnetization is nearly constant in the saturation regime and the magnetophoretic force can be approximated as
| (5) |
where is the volumetric saturation magnetization of the particle. If we apply Newton's second law of motion to a magnetic particle flowing through the channel, we can write:
| (6) |
where mp is the mass of the particle, is the magnetic force, is the gravitational force, and is the viscous drag force.
Figure 2.
Schematic illustration of specific magnetization of superparamagnetic beads as a function of applied magnetic field. The magnetic beads are saturated at approximately 0.2 T.
DEVICE PHYSICS AND DESIGN
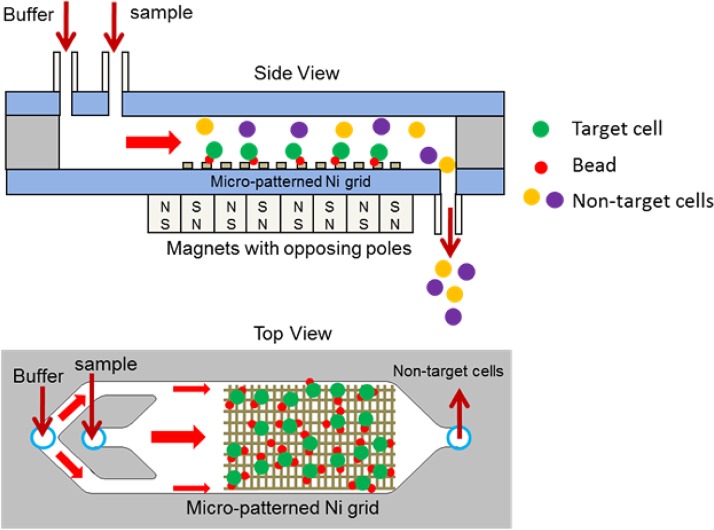
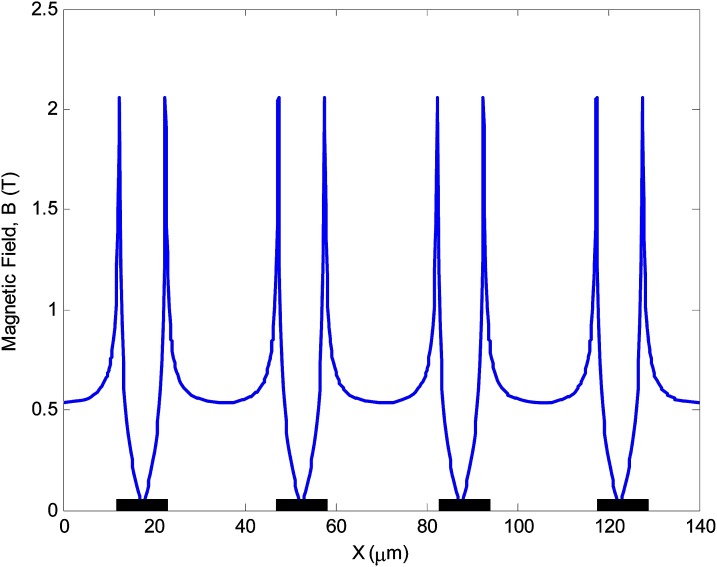
Figure 3 depicts a schematic representation of the magnetic separation chip. A sample containing magnetically labeled target cells and a buffer are introduced into the separation channel. The direction and magnitude of the force on a superparamagnetic particle are governed by the gradient of the magnetic flux. Thus, precise control of this parameter in the vicinity of the magnetic particle is crucial in order to achieve efficient and reproducible magnetophoretic separation. In this work, the precise control of the magnetic force is achieved by depositing and patterning an array of thin nickel stripes on a glass substrate to produce micro field gradients. Since nickel has a much higher permeability compared to its surroundings, a strong gradient is created at the edges of the nickel stripes when an external magnetic field is applied. Figure 4 depicts how magnetic field strength is engineered near the nickel stripes to locally shape the magnetic field gradients. The magnetic field simulations were performed in COMSOL Multiphysics. Since a large array of nickel stripes are patterned along the separation channel, only a representative segment, consisting of four stripes was simulated. The width and thickness of each stripe were 10 μm and 0.2 μm, respectively. The gap between the stripes was 25 μm. The simulation results show that the magnetic field increases by up to four-fold at the edges of the nickel stripes. Thus, the magnetically labeled particles are selectively pulled down from the stream and immobilized on the nickel stripes. The unlabeled cells do not interact with the stripes and flow through the separation channel. Once the entire sample is separated, a high-flow rate buffer flush is used to rinse and elute the concentrated target cells from the trapping region to a collection tube. This device has several key features, including the use of micro field gradients. When the labeled cells approach the nickel stripes, the micro field gradients impose an attractive magnetic force and enable uniform spreading of the captured cells at the edges of the nick grid. In addition, an array of external magnets with opposing poles is placed on the bottom side of the chip. This arrangement creates a large non-uniform magnetic field at the edges and interface of the magnets. Furthermore, the chip utilizes a buffer switching scheme to achieve a higher purity. The continuous buffer flow prevents cells from sticking to the channel wall and also acts as an adjustable parameter to improve purity by focusing the sample on the center region of the channel.
Figure 3.
Schematic of a magnetic cell separation chip. An array of thin nickel stripes is deposited and patterned on a glass substrate to produce micro field gradients. A sample containing target cell-bead complex, non-target cells, beads, and buffer are introduced into the chip. The target cell-bead complex and unattached beads are trapped at the edges of the nickel stripes while the non-target cells flow to a waste collection tube. A washing buffer is then flowed through the chip to dislodge and elute unbound non-target species.
Figure 4.
Magnetic field strength above nickel stripes. The nickel stripes are 10 μm wide, 0.2 μm thick, and 25 μm apart. Since nickel possesses a much higher permeability compared to the buffer solution, a strong gradient is created at the edges of nickel stripes.
DEVICE FABRICATION AND ASSEMBLY
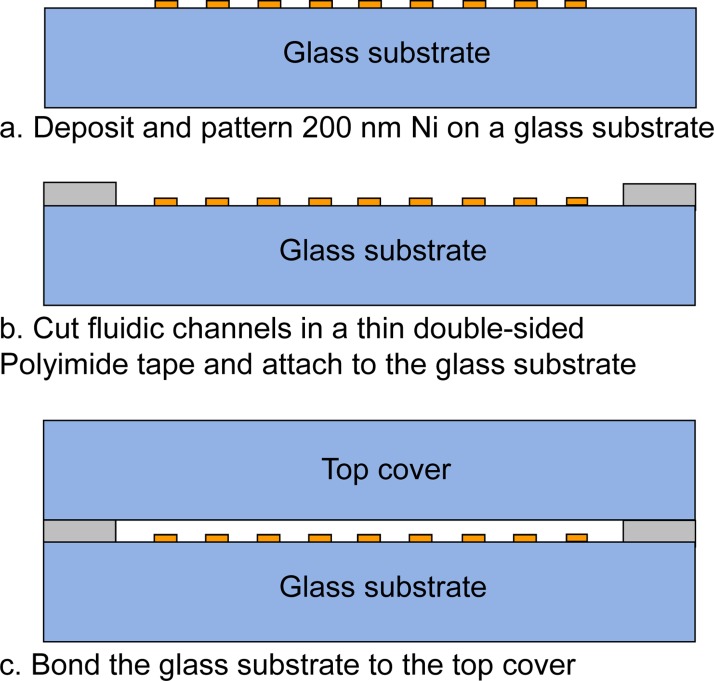
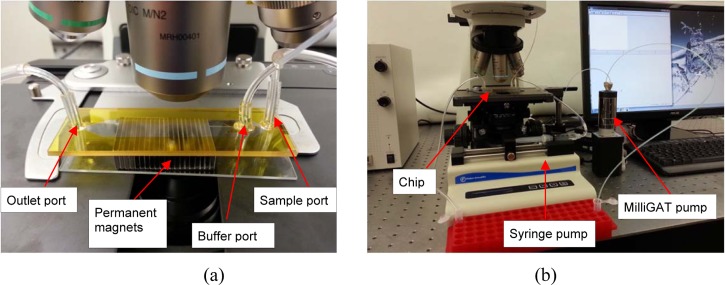
The bioseperation chips were fabricated by depositing a thin nickel (Ni) film onto a borosilicate glass wafer. Briefly, a liftoff pattern of photoresist was deposited, exposed, and developed. A 200-nm nickel film was then deposited on a borosilicate glass. The remaining photoresist was rinsed off to define Ni stripes (Fig. 5a). In conventional microfabrication techniques, glass channel patterning and channel sealing are normally performed using wet etching of glass in a hydrofluoric acid (HF) solution followed by thermal fusion bonding at temperatures exceeding 600 °C. Both of these steps are relatively difficult, slow, and expensive to scale. Thus, we explored the use of xurography to replace these difficult and time consuming steps in the chip fabrication. Xurography uses a commercially available high-resolution plotter to cut thin sheets of a laminate-type material.32 The laminate is then used to bond the top and bottom substrates either adhesively or thermally, producing a sealed microfluidic structure. The unique fabrication capability of the xurography facilitates rapid prototyping and design changes in a wide variety of materials without requiring a micro fabrication facility or a cleanroom environment. The microfluidic channel patterns were drawn in AutoCAD and plotted on a 100 μm thick double-sided Polyimide tape (Fig. 5b) using a Graphtec CraftRobo Pro plotter (Graphtec USA, Santa Ana, CA). The microfluidic channel inlet and outlet ports were drilled into a coverslip using a micro milling machine. After dicing, the glass substrate containing the nickel stripes and the top cover were cleaned and bonded using the Polyimide adhesive tape (Fig. 5c). The fluidic connections were made using epoxy. Photographs of the assembled chip and test setup are shown in Fig. 6. The overall dimensions of the chip were 22 mm × 60 mm × 1 mm and the trapping region (Ni grid) was approximately 10 mm × 20 mm. The dimensions of the array of permanent magnets were 24 mm × 19 mm × 6.35 mm. The Ni grid was completely overlapped by the permanent magnets. A bidirectional milliGAT pump (Global FIA, Inc. WA) with a MicroLynx controller was used to dispense the sample and a syringe pump (Fisher Scientific) was used for the buffer.
Figure 5.
Fabrication process of the microfluidic chip.
Figure 6.
(a) A photograph of an assembled chip with two inlet ports for sample and buffer and an outlet port for sample collection. An array of external magnets with opposing poles is placed on the bottom side of the chip. This arrangement creates a fairly large non-uniform magnetic field at the edges and interface of the magnets. (b) A photograph of the test setup.
METHODS
To characterize the performance of our chip, CD4 + T lymphocytes were isolated from human blood. CD4 + T lymphocytes are of particular interest since their count is an important surrogate marker for the clinical course of Human Immunodeficiency Virus (HIV) infection. Mononuclear cells (MNCs) were obtained from fresh human blood. A MNC is defined as any blood cell with a round nucleus such as lymphocytes, monocytes, and macrophages. Briefly, a 20 ml of blood was diluted with an equal volume of freshly prepared isolation buffer and mixed by gentle rotation. The isolation buffer consisted of phosphate buffered saline (PBS) with 0.1% bovine serum albumin (BSA) and 2 mM ethylenediaminetetraacetic acid (EDTA). A 4 ml of well mixed Ficoll-Paque PLUS (GE Healthcare Life Sciences) was dispensed into a 15 ml Falcon tube. A 8 ml diluted blood was then carefully layered on the Ficoll-Paque PLUS using a pipette. This process was repeated until all the diluted blood was used. The tubes were then centrifuged for 35 min at 800 g and 4 °C. After centrifugation, MNCs were carefully removed using a sterile pipette and transferred to a sterile micro centrifuge tube. The MNCs were then suspended in 1 ml isolation buffer, centrifuged at 300 g for 10 min, and supernatant was removed. This process was repeated 3 times. To determine the number of MNCs, a 1:100 dilution sample was prepared and counted on a hemocytometer. A portion of the cells was removed as a pre-isolation sample and used for an initial CD4 + cell count before separation. To label CD4 cells, a 25 μl FlowComp™ Human CD4 antibody (Invitrogen Corporation) was added to the sample, mixed well, and incubated for 10 min at 4 °C. CD4 Antibody (mouse IgG1 antibody against human CD4) binds to antigens on the surface of the target cells. The cells were washed with cold isolation buffer and centrifuged at 350 g for 8 min. Supernatant was removed and the cells were resuspended in 500 μl isolation buffer. A 75 μl Dynabeads (Invitrogen Corporation) was then added to the sample to attach the antibody-labeled CD4 + T cells to the magnetic beads. Dynabeads are superparamagnetic materials that are coated with a thin polymer shell to encase the magnetic material. The surface of the bead is functionalized with specific affinity to the antibody-labeled CD4 + T cells. The sample was mixed well and incubated under gentle rotation for 15 min at room temperature.
Prior to cell separation, the chip and tubing were washed with deionized water and soaked with 20% bovine serum albumin (BSA) for 30 min and rinsed with isolation buffer. Next, a 100 μl of the sample was withdrawn into the tubing using a bidirectional milliGAT pump and the tubing was connected to the sample inlet port. The sample flow rate was set to a predetermined value. The buffer flow rate was set to 5 ml/h using a syringe pump. Once the entire sample was isolated, the buffer flow rate was increased to 20 ml/hr for 2 min to wash the isolated cells. The magnets were then removed from the chip and the isolated cells were eluted to a collection tube by increasing the buffer flow rate. After cell isolation, magnetic beads were detached from the cells using a FlowComp Release Buffer (Invitrogen Corporation) by incubation and rotation for 10 min at room temperature.
The isolated target collections were then analyzed on a FACSAria (BD Biosciences) flow cytometer. A 20 μl of CD3-FITC/CD4-PE antibody (BD Biosciences) was added to the isolated cells and incubated by rotation at room temperature for 30 min. CD3-FITC/CD4-PE is a two-color fluorescence reagent for determining percentages of T-lymphocytes. It contains fluorescein isothiocyanate (FITC)-labeled CD3 and phycoerythrin (PE)-Labeled CD4. When CD3/CD4 reagent is added to the cells, the fluorochrome-labeled antibodies bind specifically to antigens on the surface of the cells. The samples were then centrifuged for 8 min at 350 g. Supernatant was carefully removed and the pellet was resuspended in 200 μl isolation buffer. All isolated target samples and pre-isolation samples were individually analyzed on a flow cytometer (BD FACSAria) to obtain CD4 + cell purity and recovery data.
RESULTS AND DISCUSSION
In general, there are three key parameters by which the performance of a particular cell sorting technique is evaluated. The first parameter is purity, which is defined as the ratio of the number of target cells over the total number of cells in the sample. The second parameter is recovery, which is defined as the ratio of the number of recovered target cells over the number of target cells in the original sample. The third parameter is throughput, defined as the number of cells processed per unit time.
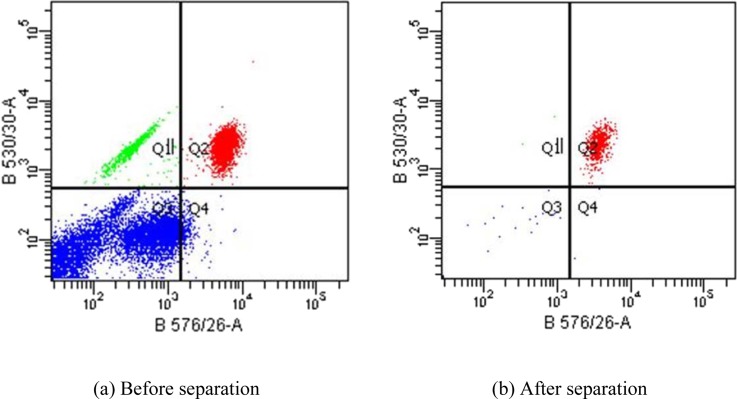
Figure 7 shows a representative flow cytometric dot plot of the sample before and after separation. The dot plot provides a two-parameter display of data and is divided into four sections to distinguish populations that are considered negative, single positive, or double positive. The x and y coordinates represent the wavelength of fluorescent signals measured by the flow cytometer detectors. The B576/26 (x-axis) and B530/30 (y-axis) correspond to the CD4-PE and CD3-FITC fluorescent signals. CD4 + T cells are identified as positive for both CD3-FITC and CD4-PE which is represented by the Q2 quadrant on the dot plot. The Q3 quadrant displays events that are negative for both CD3-FITC/CD4-PE parameters. The Q1 quadrant contains events that are positive for CD3-FITC while the Q4 quadrant contains events that are positive for CD4-PE parameter. Therefore, regions Q1, Q3, and Q4 represent non-target cell populations. For this particular run, the purity of CD4 + cells was 17.2% before the isolation and increased to 96.6% after the isolation, indicating an extremely high purity performance. The sample and buffer flow rates were set to 30 ml/h and 5 ml/h, respectively. Each test was repeated at least three times to ensure repeatability.
Figure 7.
Flow cytometric analysis of CD4 + cell isolation. The concentration of the CD4 + cells prior to isolation was 17.2% as indicated by the Q2 quadrant on the dot plot. Q1, Q3, and Q4 quadrant represent non-target cell populations. After isolation, the purity of the CD4 + cells was increased to 96.6%.
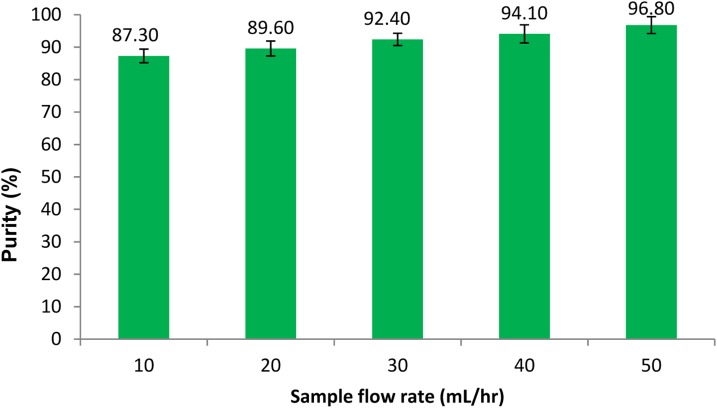
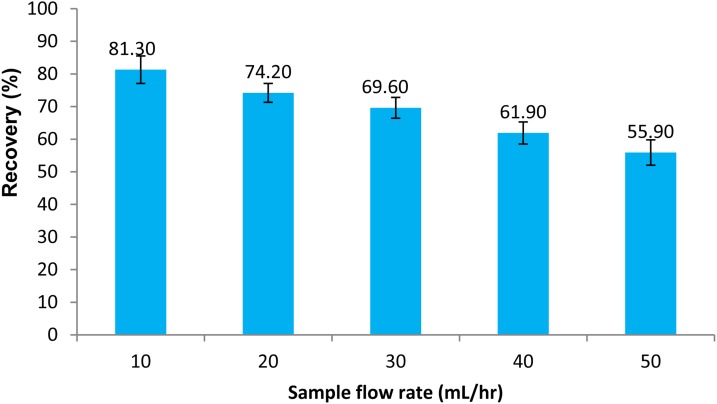
To investigate the effect of sample flow rate on cell purity and recovery, the sample flow rate was varied from 10 ml/h to 50 ml/h in 10 ml/h increments. The buffer flow rate was set to 5 ml/hr during all cell isolation experiments. Each test was repeated three times and average values and standard deviations of CD4 + cell purity and recovery were calculated. Figures 89 depict percent purity and recovery of the CD4 + cells at various sample flow rates. The results indicate that the cell purity increases with increasing the sample flow rate while the cell recovery decreases. The total number of cells in each isolation test ranged from 1 to 5 × 10⁶ cells and the percentage of CD4 cell were between 16–30%. The cell purity was found to be slightly higher when the percentage of CD4 cells in mononuclear cell extracts was higher, while a larger total number of cells in a sample resulted in a higher cell recovery. Visual observation of the trapped cells within the microfluidic channel showed that the magnetically labeled cells were uniformly spread along the nickel stripes. A higher purity performance is believed to be due to a combination of continuous flow and uniform trapping, which is a unique feature of our device. Continuous flow separation reduces non-specific trapping of not-target cells, while the use of micro field gradients results in uniform distribution of the cells on the surface of the chip. Both of these features improve the purity performance. Maximum flow rates within a magnetic cell separation depend on many factors including, the magnetic field strength, separation channel dimensions, and the magnetic response of the cell. For a given magnetic field strength and a given type of magnetic particle, the hydrodynamic force overcomes the magnetic force if the sample flow rate exceeds a certain threshold. As a result, the target cells do not have sufficient time to be pulled down from the stream and flow through the separation channel without being trapped. Thus, the cell recovery deteriorates with an increase in the sample flow rate. However, as discussed in the parametric study section, the cell recovery can be improved by increasing the length of the trapping region, increasing the number of beads per cell, and decreasing the substrate thickness.
Figure 8.
Purity of CD4 + cells at various sample flow rates. The buffer flow rate was kept at 5 ml/h. Three samples were separated in each experiment.
Figure 9.
Recovery of CD4 + cells as a function of sample flow rate. The buffer flow rate was kept at 5 ml/h. Three samples were separated in each experiment.
PARAMETRIC STUDY
While we have demonstrated an effective isolation of CD4 + cells from the peripheral blood using our microfluidic device, we have not sufficiently explored the parameter space for optimizing chip's separation performance. There are several parameters which can be optimized to improve purity, recovery, and throughput. Thus, a parametric study was performed to examine the effects of varying channel height, substrate thickness, magnetic bead size, number of beads per cell, and sample flow rate. The current device described in the design and fabrication section is capable of trapping CD4 + cells with a purity of greater than 95%, but the recovery deteriorates as the sample flow rate is increased. To create a separation platform that will be amenable to rapid separation of larger volumes (such as 5–10 ml) in 5–10 min, the device must have a volumetric processing capability of approximately 60 ml/h. This flow rate is necessary if the system is to be adapted to processing clinical blood samples in a rapid timeframe. Given the large number of parameters to be systematically varied, we performed analytical and computational modeling to investigate the effects of geometrical and operational parameters on the cell capture and trapping within the microfluidic device. The analysis provides information on the time and length that a cell travels before it is trapped.
In order to use Eq. 6 to predict the particle motion, the effective mass, density, and volume of the cell-bead particle are required. However, cell labeling is a complex process and depends on many factors such as cell type, antibody, incubation time, etc. Thus, the exact number of beads per cell is unknown. A visual inspection of the cells under a microscope showed that the number of beads that were attached to the cell surface ranged from 3 to 10. Assuming that N magnetic beads are attached to each cell, the effective mass, volume, density, and radius of the cell-bead complex were estimated using the approach proposed by Safaryk et al.33
| (7) |
| (8) |
| (9) |
| (10) |
where N is the number of beads, and subscripts p, c, and b denote cell-bead complex, cell, and bead, respectively. Since the magnetic force is proportional to the number of magnetic beads attached to the cell, Eq. 5 must be multiplied by the number of beads
| (11) |
The particle's equation of motion (Eq. 6) in x and y directions can be written as follows:
x-direction:
| (12) |
y-direction:
| (13) |
Magnetic field simulations were performed in COMSOL Multiphysics and exported to MATLAB for magnetic force calculations. The above equations were solved to determine the particle trapping time and length. The trapping length is a horizontal distance that a cell travels along the separation channel before it traps on the bottom of the channel. To ensure that most of the magnetic particles can be trapped within the microfluidic channel, the trapping time and length were calculated for an extreme case where the particles travel along the top surface of the channel. The magnetic field gradient was assumed to be constant within the channel with its lowest value along the top surface of the channel was used in the analysis. The fluid density and viscosity were assumed to be those of pure water. Three different superparamagnetic bead sizes with diameters of 1 μm, 2.8 μm, and 4.5 μm were studied. Table TABLE I. summarizes the properties of these commercially available beads manufactured by Invitrogen Corporation. The configuration and material of the external magnets affect the trapping length as well. However, in this analysis, the configuration of the external magnets was fixed and only one type of magnet was used. Thus, the magnetic field gradient is only a function of the distance between the surface of the magnet and the cell-bead particle. The external magnets were grade N52 permanent neodymium iron boron (NdFeB) magnets (K&J Magnetics, Inc.) The dimensions of the magnets were 19 mm × 1.6 mm × 6.35 mm and were magnetized through the 6.35 mm dimension.
TABLE I.
Properties of superparamagnetic beads.
| Diameter (μm) | Saturation magnetization (Am2/kg) | Magnetic susceptibility (m3/kg) | Density (g/cm3) |
|---|---|---|---|
| 1.0 | 24 | 8 × 10⁻⁴ | 1.7 |
| 2.8 | 13 | 6 × 10⁻⁴ | 1.6 |
| 4.5 | 19 | 10 × 10−4 | 1.6 |
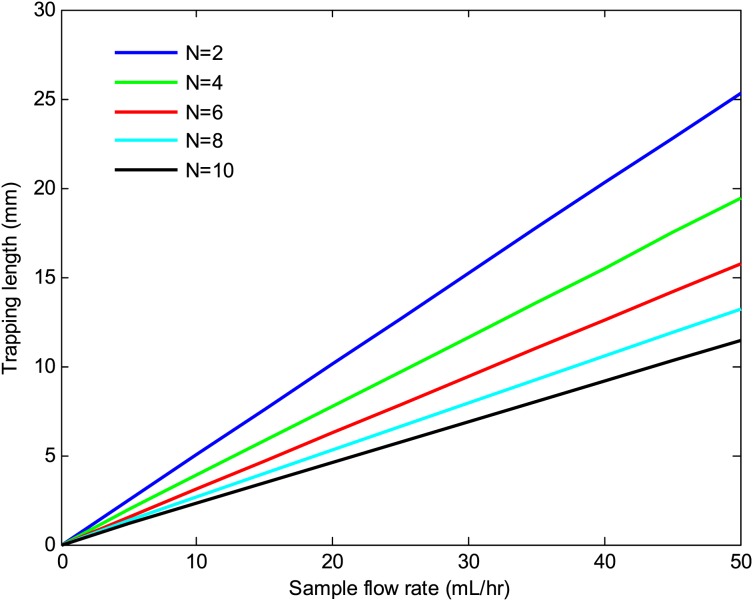
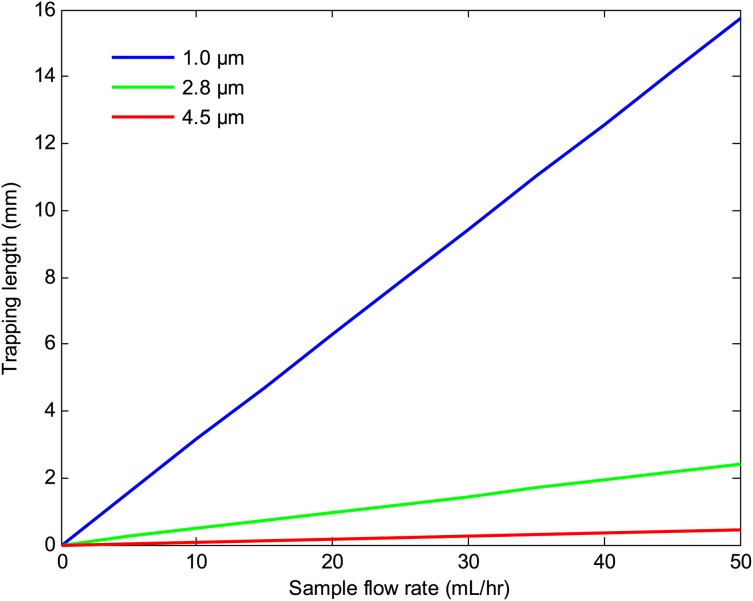
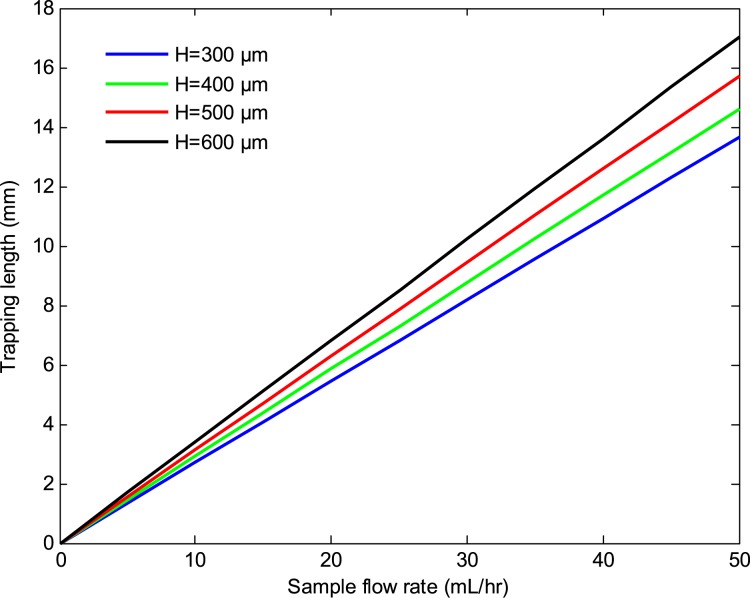
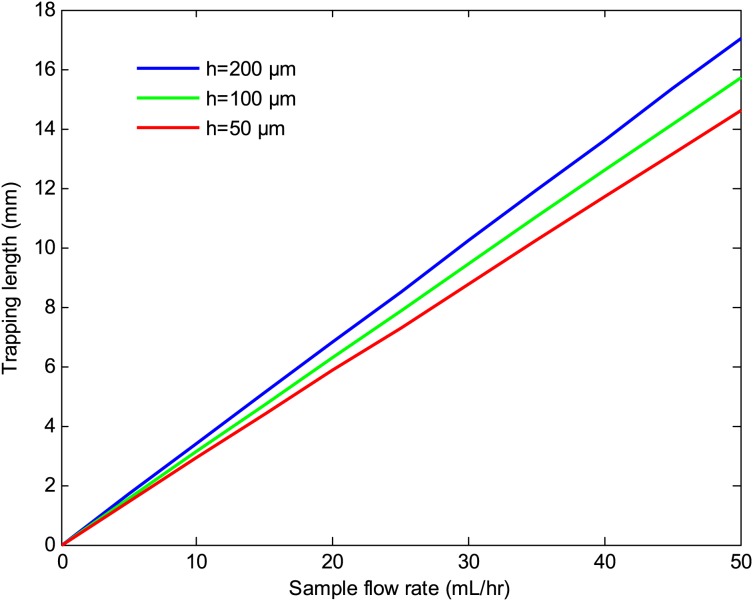
Figures 1011 depict the trapping length as a function of the sample flow rate at various number of beads per cell and bead sizes. The results indicate that the trapping length decreases with increasing the number of beads per cell and bead size. This is due to the fact that the magnetic force is proportional to the volume of the magnetic beads and the number of beads per cell. Thus, a larger bead size or a higher number of beads per cell result in a shorter trapping length. The effects of the substrate thickness and channel height on the trapping length are depicted in Figs. 1213. As seen there, the trapping length increases with increasing the substrate thickness and the channel height. This is because the magnitude of the magnetic field gradient decreases with increasing the substrate thickness and channel height, resulting in a lower magnetic force, which in turn increases the trapping length. However, for a given sample velocity, increasing the channel height results in a higher flow rate which in turn reduces the separation time. Thus, a larger channel height may be preferred if faster separation time or larger volume throughputs are desired.
Figure 10.
Trapping length versus sample flow rate at various number of beads per cell. The channel height, substrate thickness, and bead size were 100 μm, 500 μm, and 1 μm, respectively.
Figure 11.
Trapping length versus sample flow rate at various bead sizes. The channel height, substrate thickness, and number of beads per cell were 100 μm, 500 μm, and 6, respectively.
Figure 12.
Trapping length versus sample flow rate at various substrate thicknesses. The channel height, bead size, and the number of beads per cells were 100 μm, 1 μm, and 6, respectively.
Figure 13.
Trapping length versus sample flow rate at different channel heights. The substrate thickness, bead size, and number of beads per cell were 500 μm, 1 μm, and 6, respectively.
CONCLUSIONS
In this study, a magnetophoretic cell separation chip was developed for the isolation of mammalian cells. A purity of greater than 90% and a recovery of nearly 80% were successfully demonstrated in a single stage by isolation of CD4 + T cells from the peripheral blood. To obtain a comparable performance with conventional tube-based systems, multiple separations and washes (at least 3 times) and a large number of cells (greater than 5 × 10⁷ cells) are required. Considering that the separation was performed in a single stage and nearly an order of magnitude less cells were used, this microfluidic-based magnetic separation device offers better performance than conventional magnetic separators. A higher purity performance was due to a combination of uniform trapping and continuous flow, which are unique features of our device. The use of micro field gradients resulted in the even spreading of the magnetically labeled cells on the surface of the chip which in turn improved the separation performance. However, the cell recovery decreased with increasing the sample flow rate, indicating that the target cells did not have sufficient time to be pulled down from the stream and trapped on the bottom of the chip. This continuous flow bioseparation chip is more versatile than batch mode separation and can be a valuable biomedical and research tool for separation of rare cells from biological samples. For example, rapid isolation of rare malignant cells from human blood for downstream analysis in clinical laboratories would revolutionize cancer diagnosis and treatment monitoring. With a multitude of possible on-chip detection, this technology can make a significant impact on biomedical research, diagnostics, and pathogen detection.
ACKNOWLEDGMENTS
This work was partially supported by startup funds from SIUE and a STEP grant from the SIUE Office of Research and Projects.
References
- Kato K. and Radbruch A., Cytometry 14, 384–392 (1993). 10.1002/cyto.990140407 [DOI] [PubMed] [Google Scholar]
- Pyle B. H., Broadaway S. C., and Mcfeters G. A., Appl. Environ. Microbiol. 65(5), 1966–1972 (1999); available at http://aem.asm.org/content/65/5/1966. [DOI] [PMC free article] [PubMed] [Google Scholar]
- Semple J. W., Allen D., Chang W., Castaldi P., and Freedamn J., Cytometry 14, 955–960 (1993). 10.1002/cyto.990140816 [DOI] [PubMed] [Google Scholar]
- Hansel T. T., De-Vries I. J., Iff T., Rihs S., Wandzilak M., Betz S., Blaser K., and Walker C., J. Immunol. Methods 145, 105–110 (1991). 10.1016/0022-1759(91)90315-7 [DOI] [PubMed] [Google Scholar]
- Schmitz B., Radbruch A., Kummel T., Wickenhauser C., Korb H., Hansman M. L., Thiele J., and Fischer R., Eur. J. Haematol. 52, 267–275 (1994) 10.1111/j.1600-0609.1994.tb00095.x. [DOI] [PubMed] [Google Scholar]
- Miltenyi S., Muller W., Weichel W., and Radbruch A., Cytometry 11, 231–238 (1990). 10.1002/cyto.990110203 [DOI] [PubMed] [Google Scholar]
- Waldrop S. L., Pitcher C., Peterson D. M., Maino V. C., and Picker L. J., J. Clin. Invest. 99, 1739–1750 (1997). 10.1172/JCI119338 [DOI] [PMC free article] [PubMed] [Google Scholar]
- Brosterhus H., Brings S., Leyendeckers H., Manz R. A., Miltenyi S., Radbruch A., Assenmacher M., and Schimtz J., Eur. J. Immunol. 29, 4053–4059 (1999). [DOI] [PubMed] [Google Scholar]
- Furdui V. I. and Harrison D. J., Lab Chip 4, 614–618 (2004). 10.1039/b409366f [DOI] [PubMed] [Google Scholar]
- Inglis D. W., Riehn R., Austin R. H., and Sturm J. C., Appl. Phys. Lett. 85, 5093–5095 (2004). 10.1063/1.1823015 [DOI] [Google Scholar]
- Wirix-Speetjens R., Fyen W., De Boeck J., and Borghs G., J. Appl. Phys. 99, 103903 (2006). 10.1063/1.2195899 [DOI] [Google Scholar]
- Liu C., Lagae L., and Borghs G., Appl. Phys. Lett. 90, 184109 (2007). 10.1063/1.2736278 [DOI] [Google Scholar]
- Bu M., Christensen T. B., Smistrup K., Wolff A., and Hansen M. F., Sens. Actuators A 145–146, 430–436 (2008); available at http://www.sciencedirect.com/science/article/pii/S0924424707008953. [Google Scholar]
- Estes M. D., Ouyang B., Ho S., and Ahn C. H., J. Micromech. Microeng. 19, 095015 (2009). 10.1088/0960-1317/19/9/095015 [DOI] [Google Scholar]
- Pratt E. D., Huang C., Hawkins B. G., Gleghorn J. P., and Kirby B. J., Chem. Eng. Sci. 66, 1508–1522 (2011) 10.1016/j.ces.2010.09.012. [DOI] [PMC free article] [PubMed] [Google Scholar]
- Pamme N. and Wilhelm C., Lab Chip 6, 974–980 (2006). 10.1039/b604542a [DOI] [PubMed] [Google Scholar]
- Bhagat A. A. S., Bow H., Hou H. W., Tan S. J., Han J., and Lim C. T., Med. Biol. Eng. Comput. 48, 999–1014 (2010). 10.1007/s11517-010-0611-4 [DOI] [PubMed] [Google Scholar]
- Peyman S. A., Iles A., and Pamme N., Lab Chip 9, 3110–3117 (2009). 10.1039/b904724g [DOI] [PubMed] [Google Scholar]
- Zborowski M. and Chalmers J. J., Anal. Chem. 83, 8050–8056 (2011). 10.1021/ac200550d [DOI] [PMC free article] [PubMed] [Google Scholar]
- Hoyos M., Moore L., Williams P. S., and Zborowski M., J. Magn. Magn. Mater. 323, 1384–1388 (2011). 10.1016/j.jmmm.2010.11.051 [DOI] [PMC free article] [PubMed] [Google Scholar]
- Robert D., Pamme N., Conjeaud H., Gazeau F., Iles A., and Wilhelm C., Lab Chip 11, 1902–1910 (2011). 10.1039/c0lc00656d [DOI] [PubMed] [Google Scholar]
- Schneider T., Karl S., Moore L. R., Chalmers J. J., Williams P. S., and Zborowski M., Analyst 135, 62–70 (2010). 10.1039/b908210g [DOI] [PMC free article] [PubMed] [Google Scholar]
- Hoshino K., Huang Y.-Y., Lane N., Huebschman M., Uhr J. W., Frenkel E. P., and Zhang X., Lab Chip 11, 3449–3457 (2011). 10.1039/c1lc20270g [DOI] [PMC free article] [PubMed] [Google Scholar]
- Shen F., Hwang H., Hahn Y. K., and Park J.-K., Anal. Chem. 84, 3075–3081 (2012). 10.1021/ac201505j [DOI] [PubMed] [Google Scholar]
- Xia N., Hunt T. P., Mayers B. T., Alsberg E., Whitesides G. M., Westervelt R. M., and Ingber D. E., Biomed. Microdevices 8, 299–308 (2006). 10.1007/s10544-006-0033-0 [DOI] [PubMed] [Google Scholar]
- Lin Y.-H., Chen Y.-J., Lai C.-S., Chen Y.-T., Chen C.-L., Yu J.-S., and Chang Y.-S., Biomicrofluidics 7, 024103 (2013). 10.1063/1.4794974 [DOI] [PMC free article] [PubMed] [Google Scholar]
- Sofla A., Cirkovic B., Hsieh A., Miklas J. W., Filipovic N., and Radisic M., Biomicrofluidics 7, 014110 (2013). 10.1063/1.4791649 [DOI] [PMC free article] [PubMed] [Google Scholar]
- Donolato M., Dalslet B. T., and Hansen M. F., Biomicrofluidics 6, 024110 (2012). 10.1063/1.4704520 [DOI] [PMC free article] [PubMed] [Google Scholar]
- Purcell E. M., Electricity and Magnetism (McGraw-Hill, Inc., New York, NY, 1985). [Google Scholar]
- Jackson J. D., Classical Electrodynamics (John Wiley and Sons, Inc., Hoboken, NJ, 1999). [Google Scholar]
- Bleaney B. I. and Bleaney B., Electricity and Magnetism (Oxford University Press, Oxford, 1989). [Google Scholar]
- Bartholomeusz D. A., Boutte R. W., and Andrade J. D., J. Microelectromech. Syst. 14, 1364–1374 (2005). 10.1109/JMEMS.2005.859087 [DOI] [Google Scholar]
- Safaryk I. and Safarykova M., Scientific and Clinical Applications of Magnetic Carriers, edited by Hafeli U., Schutt W., Teller J., and Zborowski M. (Plenum Press, New York, 1997). [Google Scholar]


