

Abstract
PURPOSE
To demonstrate diffuse optical tomography (DOT) corrected fluorescence molecular tomography (FMT) for quantitatively imaging tumor-targeted contrast agents in a 4T1 mouse mammary tumor model.
PROCEDURES
In the first set of experiments, we validated our DOT corrected FMT method using subcutaneously injected 4T1 cells pre-labeled with a near-infrared (NIR) Cy 5.5 dye labeled recombinant amino-terminal fragment (ATF) of the receptor binding domain of urokinase plasminogen activator (uPA), which binds to uPA receptor (uPAR) that is highly expressed in breast cancer tissues. Next, we apply the DOT corrected FMT method to quantitatively evaluate the ability of sensitive tumor imaging after systemic delivery of new uPAR-targeted optical imaging probes in the mice bearing 4T1 mammary tumors. These uPAR-targeted optical imaging probes are ATF peptides labeled with a newly developed NIR-830 dye being conjugated to magnetic iron oxide nanoparticles (IONPs).
RESULTS
Our results have shown that DOT corrected FMT can accurately quantify and localize the injected imaging probe labeled 4T1 cells. Following systemic delivery of the targeted imaging nanoprobes into the mice bearing orthotopic mammary tumors, specific accumulation of the imaging probes in the orthotopic mammary tumors was detected in the mice that received uPAR targeted NIR-830-ATF-IONP probes but not in the mice injected with non-targeted NIR-830-mouse serum albumin (MSA)-IONPs. Additionally, DOT corrected FMT also enables the detection of both locally recurrent tumor and lung metastasis in the mammary tumor model 72 hrs after systemic administration of the uPAR-targeted NIR-830-labeled ATF peptide imaging probes.
CONCLUSIONS
DOT corrected FMT and uPAR-targeted optical imaging probes have great potential for detection of breast cancer, recurrent tumor and metastasis in small animals.
Keywords: DOT fluorescence tomography targeted contrast agents
1. Introduction
Optical imaging based on fluorescent probes represents a next generation tool for molecular imaging. It is a promising imaging approach because of its high sensitivity, portability and low cost. To date various non-targeted and targeted fluorescent probes have been studied for molecular imaging in animal models and in humans [1-6]. While the imaging methods used in these studies are easy to implement for the purpose of demonstrating the usefulness of the imaging probes, previous optical imaging methods are surface-weighted that is unable to provide depth information and have a poor spatial resolution at depths beyond one mean transport free length (~1 mm), leading to inaccurate localization of imaging agents.
Fluorescence molecular tomography (FMT) can overcome the limitations associated with the surface weighted or planar imaging methods by providing 3D imaging with a spatial resolution of ~500 μm given a ~10–20 mm tissue depth [7]. In FMT, the 3D spatial distribution of fluorescent probes is recovered through a mathematical inverse algorithm using tomographically measured optical data along the boundary of the object. Research conducted by several groups has shown the impact of optical property distribution in phantoms [8-12] and hybrid methods with MRI and micro-CT have been reported to improve image quality of FMT in the presence of heterogeneities FMT for mouse [13-15]. Using well-controlled phantom experiments, we have previously shown that the quantitative accuracy of FMT reconstruction can be considerably improved when the optical property distribution of turbid media obtained by diffuse optical tomography (DOT) is used as correction [16,17]. In this study, we used near infrared (NIR) dye labeled optical imaging probes that are targeted to a urokinase plasminogen activator receptor (uPAR) to enhance the sensitivity of DOT-corrected FMT in breast cancer applications. To our best knowledge, this represents the first demonstration of DOT-Corrected FMT in a mouse tumor model.
Urokinase plasminogen activator (uPA) is a serine protease that regulates multiple pathways involved in matrix degradation, cell motility, metastasis and angiogenesis. Interaction of the amino-terminal fragment (ATF) of uPA with its cellular receptor (uPAR) results in the conversion of plasminogen to a serine protease, which is a central regulator in the activation of other proteases including matrix metalloproteinases (MMPs) [18]. In the majority of normal tissues or organs, the level of uPAR is very low or undetectable except for a low level in macrophages, granulocytes, the uterus, thymus, kidney and spleen [19]. However, a high level of uPAR is found in 60 to 90% of invasive breast cancer tissues but not in normal breast tissues [20]. The highest level of uPAR is usually found at the invasive edge of the tumor lesions [20,21]. Previously, we have developed uPAR-targeted optical and MRI dual imaging probes by conjugation of Cy5.5 NIR dye labeled recombinant amino-terminal fragment (ATF) of uPA, the receptor binding domain for uPAR to magnetic iron oxide nanoparticles (IONPs) [22]. Those dual modality imaging probes can specifically target to the tumors, allowing 2-dimensional optical imaging and MRI of breast cancers [23]. Recently, we developed a new NIR 830 dye labeled and uPAR-targeted IONP probe as shown in Fig. 1. Results of our study demonstrated that selective accumulation of these targeted optical imaging probes into tumors following systemic delivery enables 3D DOT corrected FMT detection of primary as well as local recurrent and distant metastatic tumors in an orthotopic mouse mammary tumor model.
Fig. 1.
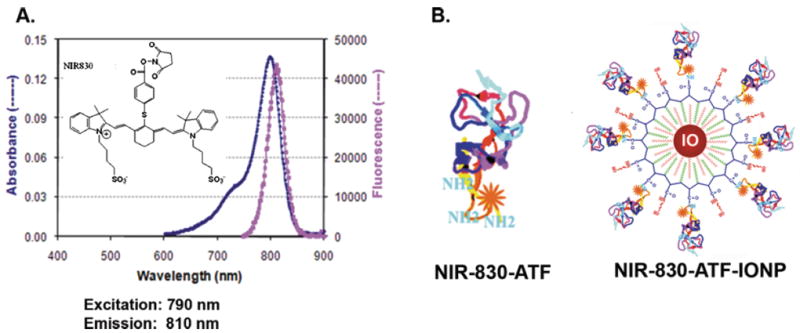
A: NIR-830’s fluorescence spectrum in PBS solution and the insert is the chemical structure. B: molecular structure of NIR-830-ATF and NIR-830-ATF-IONP. (Colours are visible in the online version of the article; http://dx.doi.org/10.3233/XST-130365
2. Experimental system and method
The experimental system used is shown in Fig. 2A. In this system, the excitation light is directly delivered to the mouse at specific points with given coordinates of X and Z axis via linear stages. For each source position, emission and excitation data from the opposite side of the mouse are recorded by a 1024×1024 pixels CCD camera (Princeton Instrument, Trenton, NJ) without or with a bandpass filter for DOT and FMT data collection, respectively. Our system has been constructed such that multi-angle transmission light can be collected, which is realized by rotating the mouse three 90° in order to collect transmission light at four directions. A Visual C++ controlling program is used to control the entire data acquisition. The well-known shape-from-silhouette 3D recovery approach was used to render the 3D model of the actual mouse used and silhouette acquisition procedure was detailed in our previous study [17]. A 3D finite element mesh of the 3D model was then generated using Amira 3.1 (inclusion of Fig. 2A). There was also a need to map the photon density read from the CCD camera (actually the virtual detector along the focal plane of the CCD camera) onto the arbitrarily shaped surface of the mouse. We have adopted a method where a Lambert’s cosine law and solid angle based light propagation model is established that correlates the photon density at the virtual detector and the animal surface. With this model, given the relative geometric relationship between the virtual detector and the phantom surface, the numerical aperture of the virtual detectors and the visibility factor that can be experimentally calibrated, one can accurately convert the read out from the CCD into the photon density at the mouse surface for actual image reconstruction.
Fig. 2.
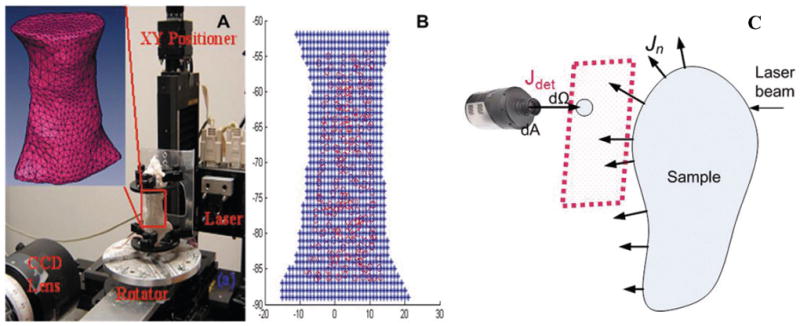
A. Photography of the experimental system, where the insert is the 3D finite element mesh of the region of interest from a mouse. B. The source node distribution of a typical sagittal projection. Blue stars are the voxels from the 3D mouse model and red circles are the projected source nodes from the finite element mesh. C. Scattering geometry for a diffusive object surrounded by air. The red rectangle indicates the focus plane of CCD camera and dΩ is a virtual detector on the focus plane of CCD to actually acquire signal from an arbitrarily shaped sample. (Colours are visible in the online version of the article; http://dx.doi.org/10.3233/XST-130365)
Briefly, for each angle, the source and detector nodes in the finite element mesh were automatically chosen to cover the region of interest and their absolute coordinates were mapped automatically towards CCD pixel grid; as in a typical 3D scan of a mouse in average size, signals from a total of 238 source and 284 detector positions were collected. For each angle, XY-positioner delivered laser beam to the animal surface according to the coordinates of source nodes and the CCD collected transmission signal from the opposite site of the animal. We used a finite element mesh of 3855 nodes and 17999 tetrahedron elements. The model for describing the collect of optical signal from arbitrarily shaped objects in free space is described previously [24,25], we implemented and applied the model to map the CCD pixel values to the photon field emerging from arbitrarily surface in previous study with satisfactory results [4, 17]. The total reconstruction time for a typical mouse was ~6 hours in a 3 GHz 64 bit PC.
Targeted contrast agents of DOT corrected FMT experiments, the recombinant mouse amino terminal fragment (ATF) of uPA, was produced from a bacterial expressing system using our established protocol [23]. To determine sensitivity of the imaging approach and correlation of the DOT-corrected imaging with the number of imaging probe-labeled cells, mouse ATF peptides were firstly labeled with NIR Cy 5.5 dye (GE Healthcare. Piscataway, NJ) using manufacture’s protocol. 4T1 mouse mammary tumor cells were pre-incubated with NIR Cy5.5 dye-ATF peptides in vitro for 4 hrs and unbound Cy 5.5-ATF peptides were washed thoroughly by centrifugation. Cells were counted and specific numbers of cells (100,000, 200,000, and 500,000 cells) were injected subcutaneously into the mice. 2-D optical imaging was performed immediately to determine the injection sites and NIR signal intensity. DOT-corrected FMT imaging was performed later on the mice. Experiments were conducted with no filter for DOT and a 710 nm bandpass filter for FMT at an excitation wavelength of 660 nm (25 mW).
To determine the feasibility of quantitative detection of the optical image probes in the tumor by DOT-corrected FMT, we used a newly developed NIR-830 dye (C49H54N3O10S3, Molecular Weight 940.3), synthesized by our group from a Sigma Aldrich (Sigma-Aldrich, St. Louis, MO) NIR 783 dye product (CAS Number 115970-66-6, Molecular Weight: 749.35) in two steps in a manner described before [26, 17], to label ATF peptides. NIR dye 830 has peak absorption at 790 nm and an emission wavelength of 810 nm as a free dye or 825 nm as a conjugated dye (Fig. 1A). The NIR-830 dye yields much higher signal-to-noise ratio with less absorption than Cy 5.5. Mouse ATF peptides are labeled to NIR 830 dye through its maleimide or NHS functional group. NIR-830-ATF peptide itself can be used as a peptide optical imaging probe. It can also be conjugated to magnetic iron oxide nanoparticles to produce dual optical and MR imaging probes (Fig. 1B). The nanoparticle imaging probe NIR-830-ATF-IONP was produced by conjugating NIR-830-ATF to amphiphilic polymer IONPs with a core size of 10 nm (Ocean Nanotech, LLC, Springdale, AR).
To establish an orthotopic mouse mammary tumor model, 2×10⁶ of luciferase gene positive mouse mammary tumor 4T1 cells (kindly provided by Dr. Mark W. Dewhirst at Duke University) were injected into the mammary fat pad of 6 to 8 week old female Balb/c mice. When the mammary tumors grew to 5 to 8 mm in 10 to 15 days, 100 pmol of targeted NIR-830-ATF-IONPs or non-targeted NIR-830-mouse serum albumin (MSA)-IONP nanoparticle imaging probes were injected via the tail vein of the mice. DOT-corrected FMT was performed 6 days following the probe administration. To determine if the optical image approach is able to detect local tumor recurrence and distant metastasis, orthotopic mammary tumors of the mice were resected under anesthesia.
3. Results
3.1. 3D whole body optical property distribution of mouse and quantification of Cy 5.5 -ATF peptide labeled tumor cells
Reconstructed 3D optical property images of a mouse are given in Fig. 3. The absorption and scattering images (Figs 3A and B) show that the lung (the upper part) and liver (the lower part) are clearly visible with high absorption and scattering coefficient values. The highly heterogeneous optical property distribution shown here in a mouse indicates that DOT will play a critical role for accurate recovery of fluorescent probes. The optical property distribution obtained from DOT is then input into the FMT reconstruction as a priori information.
Fig. 3.
Reconstructed 3D absorption and scattering images of a typical mouse under study (40 pmol of NIR-830 injections 4 days after administration: arrows indicate lungs and heart region, rectangle area indicates liver and spleen region). The adjacent organs are not separated due to the resolution limitation of diffuse optical tomography (DOT). A, B are the isosurface plot with 60% of the maximum value as threshold for absorption and scattering images. C, D are quantitative plot of absorption and scattering properties, units = mm−1. (Colours are visible in the online version of the article; http://dx.doi.org/10.3233/XST-130365)
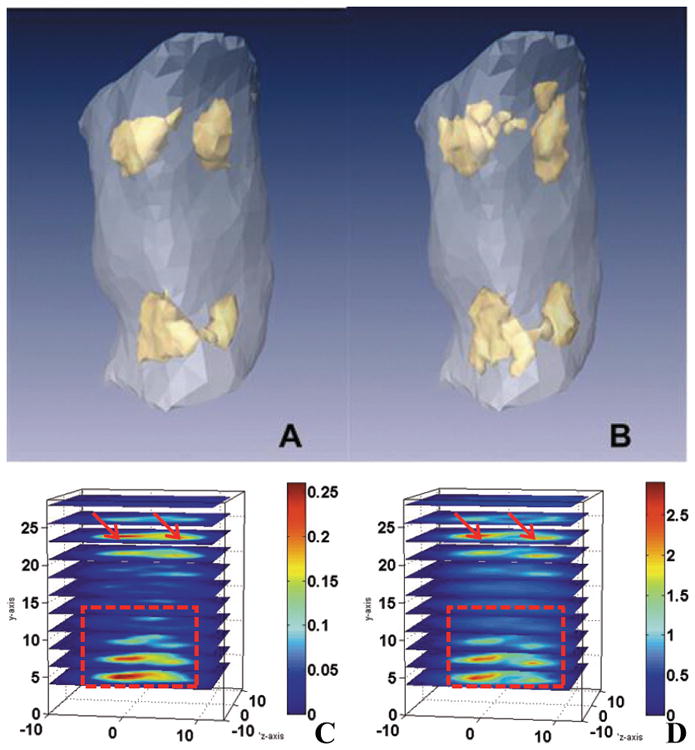
To determine if DOT-corrected FMT is able to accurately locate positive tumor cells and whether the signal intensity correlates with the number of NIR dye positive cells, we examined the FMT image from the mice that received subcutaneous injections of the mouse mammary tumor cells pre-labeled with a commercial NIR dye Cy5.5-conjugated ATF peptide probes. Figure 4 shows the recovered 3D fluorescence images (with or without the DOT) of a mouse with three different volume/numbers of the cells injected subcutaneously at three locations. We found that the fluorescence tumor image is most accurately reconstructed when DOT correction is used in terms of the volume (which is proportional to the tumor cell number) and the position (partially overlapped with the exact injection position). In contrast, the FMT without DOT correction produced unsatisfactory fluorescent reconstruction where the recovered target positions are shifted from the exact positions and the recovered sizes are not proportional to the tumor cell number.
Fig. 4.
Recovered 3D FMT images for a mouse displayed in sagittal A and coronal B projection. The exact tumor location (red mesh), and the isosurface plot of the fluorescent target recovered with (in golden) or without (in blue) DOT correction are shown for comparison. 2-D optical imaging using the Kodak FX in vivo imaging system immediately following injections shows location of injected tumor cells and intensity of NIR signal in each injected site (c). (Colours are visible in the online version of the article; http://dx.doi.org/10.3233/XST-130365)
3.2. Detection of target specificity of NIR-830-ATF-IONP imaging probes and sensitivity of the DOT-corrected FMT imaging
We here use DOT corrected FMT to characterize targeted delivery of NIR-830-ATF-IONPs in specificity and sensitivity for tumor imaging. Quantification of the amount of optical imaging probes in the tumor and normal organs and tissues after systemic delivery into a tumor bearing mouse can be used to evaluate specificity of the probe. Specificity and the amount of imaging probes bound to targeted organs or tumors in a mouse are the key parameters to validate the imaging probes in preclinical applications. We tentatively utilized quantitative FMT to evaluate specific binding of the NIR-830-ATF-IONP imaging probes by comparing the reconstructed concentration value of NIR-830 dye with or without ATF targeting.
We administrated non-targeted NIR-830-MSA-IONP and uPAR targeted NIR-830-ATF-IONP via the tail vein of the tumor-bearing mice. DOT corrected FMT was conducted for both the MSA (non-targeted) and ATF (targeted). The ATF-targeting remarkably increased the fluorescent concentration accumulated in the tumors over non-targeted NIR-830-MSA-IONPs with a difference about 10 folds, as shown in Fig. 5.
Fig. 5.
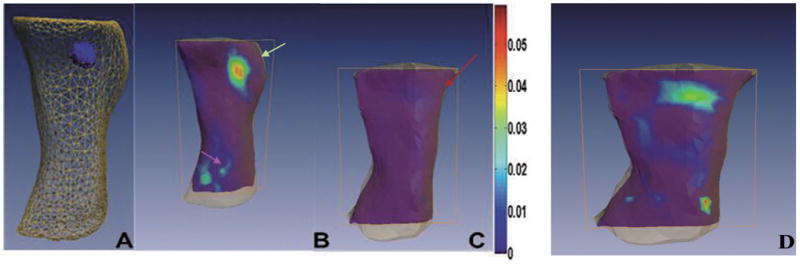
Comparison of reconstructed fluorescence images of the mice bearing the mammary tumors following systemic delivery of targeted or non-targeted optical imaging probes. The tumor bearing mice that received the tail vein delivery of 40 pmol of uPAR-targeted NIR-830-ATF-IONPs or non-targeted NIR-830-MSA-IONPs 6 days after administration of the probes. A. 3-D view of reconstructed whole body imaging by DOT corrected FMT method. Positive orthotopic mammary tumor is located on the upper right mammary gland of the mouse. B. Slice view of the mouse that received NIR-830-ATF-IONPs injection. Strong fluorescent signal is detected in the mammary tumor (green arrow, upper right) but not in most of normal tissue/organs. Weak fluorescent signals are also detected in the bladder, suggesting that the imaging probes can be eliminated through the kidney (Pink arrow, low left). C. Slice view of the mouse that received non-targeted NIR-830-MSA-IONP under the same color bar as B with the maximum value of 0.06. Fluorescent signal is low and not discernible in the mammary tumor located on the upper right mammary gland of the mouse (red arrow). D. Slice view of a mouse that received non-targeted NIR-830-MSA-IONP under a color bar with the maximum value of 0.006; non-targeted NIR 830 had biodistribution in many parts of body and was relatively more concentrated in liver region than targeted NIR 830. (Colours are visible in the online version of the article; http://dx.doi.org/10.3233/XST-130365)
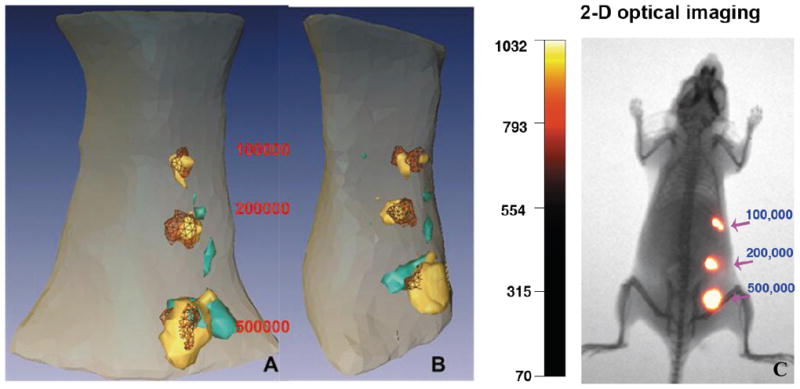
Targeting NIR-830-ATF-IONPs to the tumor has potential to greatly increase the imaging sensitivity, making it possible to detect early stage, recurrent or metastatic tumors. To determine whether NIR-830-ATF-IONPs are able to target to and accumulate in locally recurrent mammary tumors and lung metastasis, the primary mammary tumor in the mice was surgically resected. Two weeks following surgery, the mice developed locally recurrent tumor in the mammary fat pad and lung metastasis as determined by bioluminescence imaging (Fig. 6A). The mouse then received the tail vein delivery of 2.35 nmol of NIR-830 ATF peptides. 72 hrs after administration of the probes, FMT measurements detected the locally recurrent tumor and lung metastasis (Fig. 6B). Since our DOT corrected FMT method collects both excitation and emission signals of all projections and offers optical images through a mathematical inverse algorithm, the image shown in Figs 6B and C provides a 3D distribution with true depth information and quantitative value of the targeted contrast agents.
Fig. 6.
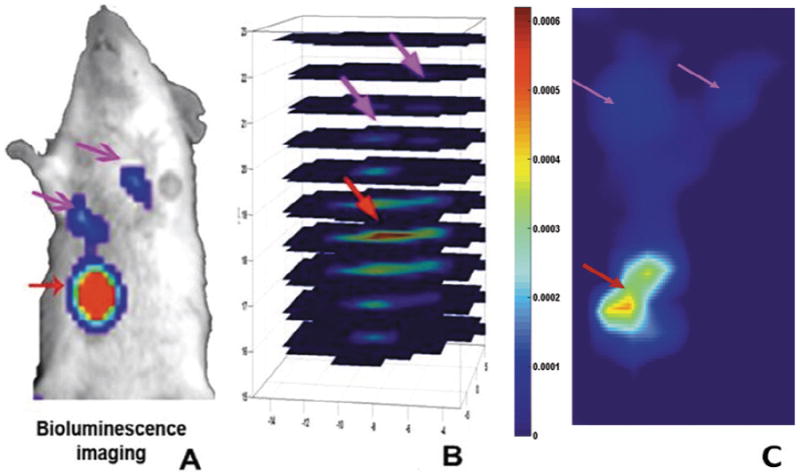
Detection of locally recurrent mammary tumor and lung metastasis using DOT-corrected FMT coupled with uPAR targeted NIR-optical imaging probes. The primary mammary tumor of the tumor-bearing mouse was surgically removed two weeks before the imaging procedure. A. Bioluminescence imaging revealed the presence of a locally recurrent tumor on the chest wall and two lung metastatic lesions. B. The mouse received the tail vein injection of 2.35 nmol of NIR-830-ATF peptides 72 hrs after administration of the probes. Reconstructed 3D image by DOT corrected FMT shows that the locally recurrent tumor and lung metastasis can be detected with depth information. C. A Coronal Slice indicate locally recurrent tumor (red arrow) and lung metastasis (pink arrow). (Colours are visible in the online version of the article; http://dx.doi.org/10.3233/XST-130365)
4. Conclusions
Recently, fluorescence tomography has been improved with other imaging modalities. For example, X-ray computed tomography (CT) is used as a structural guidance to FMT reconstruction for improved resolution as well as quantification accuracy; X-ray fluorescence is also becoming a promising analysis tool which greatly expands applications of fluorescence imaging; X-ray Luminescence Optical Tomography is emerging as a new method to improve resolution of Fluorescence Molecular Tomography (FMT) [28-30]. As a hybrid approach to improve FMT, the current DOT corrected FMT can be conveniently applied to all existing fluorescent imaging systems to improve FMT resolution and quantification without the need of extra hardware implementation.
We have shown that DOT corrected FMT is able to quantitatively image targeted contrast agents after systemic administration in a mouse mammary tumor model. The DOT corrected FMT method also allows the study of specificity of the targeted contrast agents. The stability of the NIR-830-ATF-IONP probe is also a great advantage for molecular imaging: The probe remains detectable 6 days after administration (Fig. 5) for tumor imaging. We believe that the combination of DOT corrected FMT and uPAR-targeted optical imaging probes has great potential for the development of novel molecular imaging approaches for early detection of breast cancer and intraoperative evaluation of tumor, recurrent tumor and metastasis.
In a previous study, we investigated early diagnosis of osteoarthritis based on an optic fiber-based DOT prototype [31-33]. While DOT can reveal changes in tissue optical properties in diseased joints, the contrast would be much lower than that available using FMT especially at early stages of the disease. The study presented herein used DOT Corrected FMT to provide enhanced target contrast in preclinical small animals with a CCD camera-based free space system. The methodology described here can also be used for clinical applications such as early diagnosis and chemotherapy monitoring of breast cancer.
Acknowledgments
This research was supported in part by a grant from the NIH (R01 CA133722). We would like to thank Dr. Mark W. Dewhirst for kindly providing us with luciferase gene stable 4T1 cell line.
References
- 1.Ntziachristos V. Going deeper than microscopy: The optical imaging frontier in biology. Nat Methods. 2010;7:603–614. doi: 10.1038/nmeth.1483. [DOI] [PubMed] [Google Scholar]
- 2.Montet X, Figueiredo JL, Alencar H, Ntziachristos V, Mahmood U, Weissleder R. Tomographic fluorescence imaging of tumor vascular volume in mice. Radiology. 2007;242:751–758. doi: 10.1148/radiol.2423052065. [DOI] [PubMed] [Google Scholar]
- 3.Deliolanis NC, Dunham J, Wurdinger T, Figueiredo JL, Tannous BA, Ntziachristos V. In-vivo imaging of murine tumors using complete-angle projection fluorescence molecular tomography. J Biomed Opt. 2009;14:030509. doi: 10.1117/1.3149854. [DOI] [PMC free article] [PubMed] [Google Scholar]
- 4.Tan Y, Novo M, Yao L, Zhou L, Jiang H. In Vivo monitoring of stem cells in drosophila pupae using the radiative transfer equation-based fluorescence molecular tomography. Mol Imaging and Bio. 2011;13:868–873. doi: 10.1007/s11307-010-0434-6. [DOI] [PubMed] [Google Scholar]
- 5.Massoud T, Gambhir S. Molecular imaging in living subjects: Seeing fundamental biological processes in a new light. Gene Dev. 2003;17:545–580. doi: 10.1101/gad.1047403. [DOI] [PubMed] [Google Scholar]
- 6.Weissleder R. Molecular imaging in cancer. Science. 2006;312:1168–1171. doi: 10.1126/science.1125949. [DOI] [PubMed] [Google Scholar]
- 7.Graves E, Ripoll J, Weissleder R, Ntziachristos V. A submillimeter resolution fluorescence molecular imaging system for small animal imaging. Med Phys. 2003;30:901–911. doi: 10.1118/1.1568977. [DOI] [PubMed] [Google Scholar]
- 8.Ntziachristos V, Hielscher A, Yodh A, Chance B. Diffuse optical tomography of highly heterogeneous media. IEEE Trans Med Imaging. 2001;20:470–478. doi: 10.1109/42.929613. [DOI] [PubMed] [Google Scholar]
- 9.Roy R, Godavarty A, Sevick-Muraca E. Fluorescence-enhanced optical tomography using referenced measurements of heterogeneous media. IEEE T Med Imaging. 2003;22:824–836. doi: 10.1109/TMI.2003.815072. [DOI] [PubMed] [Google Scholar]
- 10.Milstein A, Oh S, Webb K, Bouman C, Zhang Q, Boas D, Millane R. Fluorescence optical diffusion tomography. Appl Optics. 2003;42:3081–3094. doi: 10.1364/ao.42.003081. [DOI] [PubMed] [Google Scholar]
- 11.Barber WC, Lin Y, Nalcioglu O, Iwanczyk JS, Hartsough NE, Gulsen G. Combined fluorescence and x-ray tomography for quantitative in vivo detection of fluorophore, technol. Cancer Res Treat. 2010;9:45–52. doi: 10.1177/153303461000900105. [DOI] [PMC free article] [PubMed] [Google Scholar]
- 12.Naser MA, Patterson MS. Improved bioluminescence and fluorescence reconstruction algorithms using diffuse optical tomography, normalized data, and optimized selection of the permissible source region. Biomed Opt Express. 2011;2:169–184. doi: 10.1364/BOE.2.000169. [DOI] [PMC free article] [PubMed] [Google Scholar]
- 13.Niedre M, Ntziachristos V. Elucidating structure and function in vivo with hybrid fluorescence and magnetic resonance imaging. P IEEE. 2008;96:382–396. [Google Scholar]
- 14.Zhang X, Badea CT, Johnson GA. Three-dimensional reconstruction in free-space whole-body fluorescence tomography of mice using optically reconstructed surface and atlas anatomy. J Biomed Opt. 2009;14:064010. doi: 10.1117/1.3258836. [DOI] [PMC free article] [PubMed] [Google Scholar]
- 15.Freyer M, Ale A, Schulz RB, Zientkowska M, Ntziachristos V, Englmeier KH. Fast automatic segmentation of anatomical structures in x-ray computed tomography images to improve fluorescence molecular tomography reconstruction. J Biomed Opt. 2010;15:036006. doi: 10.1117/1.3431101. [DOI] [PubMed] [Google Scholar]
- 16.Tan Y, Jiang H. Diffuse optical tomography guided quantitative fluorescence molecular tomography. Appl Opt. 2008;47:2011–2016. doi: 10.1364/ao.47.002011. [DOI] [PubMed] [Google Scholar]
- 17.Tan Y, Jiang H. DOT guided fluorescence molecular tomography of arbitrarily shaped objects. Med Phys. 2008;35:5703–5707. doi: 10.1118/1.3020594. [DOI] [PubMed] [Google Scholar]
- 18.Blasi F, Carmeliet P. uPAR: A versatile signaling orchestrator. Nat Cancer Rev. 2002;3:932–943. doi: 10.1038/nrm977. [DOI] [PubMed] [Google Scholar]
- 19.Solberg H, Ploug M, Hoyer-Hansen G, Nielsen BS, Lund LR. The murine receptor for urokinase-type plasminogen activator is primarily expressed in tissues actively undergoing remodeling. J Histochem Cytochem. 2001;49:237–246. doi: 10.1177/002215540104900211. [DOI] [PubMed] [Google Scholar]
- 20.Hemsen A, Riethdorf L, Brunner N, Berger J, Ebel S, Thomssen C, Janicke F, Pantel K. Comparative evaluation of urokinase-type plasminogen activator receptor expression in primary breast carcinomas and on metastatic tumor cells. Int J Cancer. 2003;107:903–909. doi: 10.1002/ijc.11488. [DOI] [PubMed] [Google Scholar]
- 21.Nielsen BS, Rank F, Illemann M, Lund LR, Dano K. Stromal cells associated with early invasive foci in human mammary ductal carcinoma in situ coexpress urokinase and urokinase receptor. Int J Cancer. 2007;120:2086. doi: 10.1002/ijc.22340. [DOI] [PubMed] [Google Scholar]
- 22.Huai Q, Mazar AP, Kuo A, Parry GC, Shaw DE, Callahan J, Li Y, Yuan C, Bian C, Chen L, Furie B, Furie BC, Cines DB, Huang M. Structure of human urokinase plasminogen activator in complex with its receptor. Science. 2006;311:656–659. doi: 10.1126/science.1121143. [DOI] [PubMed] [Google Scholar]
- 23.Yang L, Peng X, Wang Y, Wang X, Cao Z, Ni C, Karna P, Zhang X, Wood W, Gao X, Nie S, Mao H. Receptor-targeted nanoparticles for in vivo imaging of breast cancer. Clin Cancer Res. 2009;15:4722–4732. doi: 10.1158/1078-0432.CCR-08-3289. [DOI] [PMC free article] [PubMed] [Google Scholar]
- 24.Ripoll J, Schulz RB, Ntziachristos V. Free-space propagation of diffuse light: Theory and experiments. Phys Rev Lett. 2003;91:103901, 1–4. doi: 10.1103/PhysRevLett.91.103901. [DOI] [PubMed] [Google Scholar]
- 25.Ntziachristos V, Graves E, Schultz R, Ripoll J. Fluorescence molecular tomography: New detection schemes for acquiring high information content measurements. IEEE International Symposium on Biomedical Imaging: From Nano to Macro; 2004. pp. 1475–1478. [Google Scholar]
- 26.Strekowski L, Mason CJ, Lee H, Gupta R, Sowell J, Patonay G. Synthesis of water-soluble near-infrared cyanine dyes functionalized with [(succinimido)oxy]carbonyl group. J Heterocycl Chem. 2003;40:913–916. [Google Scholar]
- 27.Lipowska M, Patonay G, Strekowski L. New near-infrared cyanine dyes, e.g. (l), for labeling of proteins. Synth Commun. 1993;23:3087–3094. [Google Scholar]
- 28.Gao F, Li J, Zhang W, Yi X, Wang X, Zhang L, Zhou Z, Zhao H. A CT-analogous scheme for time-domain diffuse fluorescence tomography. Journal of X-Ray Science and Technology. 2012;20:91–105. doi: 10.3233/XST-2012-0321. [DOI] [PubMed] [Google Scholar]
- 29.Ale A, Ermolayev V, Herzog E, Cohrs C, de Angelis MH, Ntziachristos V. FMT-XCT: In vivo animal studies with hybrid fluorescence molecular tomography – X-ray computed tomography. Nature Methods. 2012;9:615–620. doi: 10.1038/nmeth.2014. [DOI] [PubMed] [Google Scholar]
- 30.Wang F, Li Z, Qiao B. Rapid analysis of iron concentrates by x-ray fluorescence spectrometry with sol-gel sample preparation technology. Journal of X-Ray Science and Technology. 2011;19:417–421. doi: 10.3233/XST-2011-0301. [DOI] [PubMed] [Google Scholar]
- 31.Zhang J, Wang JZ, Yuan Z, Sobel ES, Jiang H. Computer-aided classification of optical images for diagnosis of osteoarthritis in the finger joints. Journal of X-Ray Science and Technology. 2011;19:531–544. doi: 10.3233/XST-2011-0312. [DOI] [PubMed] [Google Scholar]
- 32.Shives E, Xu Y, Jiang H. Fluorescence lifetime tomography of turbid media based on an oxygen-sensitive dye. Opt Express. 2002;10:1557–1562. doi: 10.1364/oe.10.001557. [DOI] [PubMed] [Google Scholar]
- 33.Zhang Q, Yin L, Tan Y, Yuan Z, Jiang H. Quantitative bioluminescence tomography assisted by diffuse optical tomography. Opt Express. 2008;16:1481–1486. doi: 10.1364/oe.16.001481. [DOI] [PubMed] [Google Scholar]