

Abstract
Recently, there has been much debate about the prospects of eliminating HIV from high endemic countries by a test-and-treat strategy. This strategy entails regular HIV testing in the entire population and starting antiretroviral treatment immediately in all who are found to be HIV infected. We present the concept of the elimination threshold and investigate under what conditions of treatment uptake and dropout elimination of HIV is feasible. We used a deterministic model incorporating an accurate description of disease progression and variable infectivity. We derived explicit expressions for the basic reproduction number and the elimination threshold. Using estimates of exponential growth rates of HIV during the initial phase of epidemics, we investigated for which populations elimination is within reach. The concept of the elimination threshold allows an assessment of the prospects of elimination of HIV from information in the early phase of the epidemic. The relative elimination threshold quantifies prospects of elimination independently of the details of the transmission dynamics. Elimination of HIV by test-and-treat is only feasible for populations with very low reproduction numbers or if the reproduction number is lowered significantly as a result of additional interventions. Allowing low infectiousness during primary infection, the likelihood of elimination becomes somewhat higher. The elimination threshold is a powerful tool for assessing prospects of elimination from available data on epidemic growth rates of HIV. Empirical estimates of the epidemic growth rate from phylogenetic studies were used to assess the potential for elimination in specific populations.
Keywords: HIV elimination, mathematical model, primary HIV infection, treatment coverage
Recently, there has been much debate about the prospects of eliminating HIV from high endemic countries by a test and treat strategy (1–6). The rationale of the test-and-treat strategy is to offer regular HIV testing to entire populations and immediate antiretroviral treatment (ART) to all those found positive. As viral loads decline to undetectable levels under ART, the probability of onward transmission is reduced to very low levels. The latter has been confirmed in discordant couples’ studies, where no transmission was observed in those couples of which the HIV-positive partner was on treatment (7, 8). The test-and-treat strategy is a particular form of the more general approach of “treatment as prevention” that emphasizes the impact of treatment on the transmission dynamics of HIV in populations, i.e., it is focused on the indirect effects of treatment. Treatment of large groups of an infected population may have substantial impact on numbers of HIV diagnoses, as a recent ecological study from Canada suggested (9), or on risk of HIV acquisition, as shown in a cohort study in South Africa (10). However, to judge the prospects of eventual elimination, we would like to know whether or not incidence will decrease to zero with a reasonable intervention effort. In addition, cost-effectiveness of treatment as prevention depends sensitively on whether or not elimination is feasible in the long run and how long it takes to reach that goal. If HIV remains endemic, continuous investments will be needed in the future, whereas in the case of elimination a point of zero costs may be achieved.
Mathematical modeling has played a key role in the discussion of the impact of treatment as prevention strategies, highlighted by the paper by Granich et al. (2), and followed up by others (11–14). These models all set out to assess the impact of treatment on population prevalence and incidence using simulations with parameter values estimated from various data sources. Although this approach is useful to compare quantitatively various intervention strategies or for cost-effectiveness analyses (14), it does not allow the answer to a more generic question, namely, under what conditions upon transmission rates is elimination possible at all (15)? To address the latter question an analytic approach is required.
We developed a modeling approach that allows assessment of the prospects of elimination given that some information is available on the initial phase of the epidemic. We generalized the model by Granich to allow for a more flexible description of the natural history of infection. We defined elimination as a threshold phenomenon and related the elimination threshold to the basic reproduction number R0. We showed how basic reproduction number and exponential growth rate are related given our knowledge on disease progression and transmission. We investigated how the feasibility of elimination depends on the distribution of infectivity during the infectious period. Finally, we used published estimates of epidemic growth rates from incidence data or genetic sequence data to judge the prospects of elimination thresholds in specific populations.
Methods
Model Formulation.
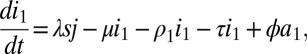
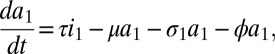
Our model is a direct generalization of the model in ref. 2 in that it allows for an arbitrary number of stages of infection with variable duration (Fig. 1 and SI Appendix). The model describes progression through n stages of infection, background mortality, additional mortality from HIV infection, and the uptake and dropping out of treatment. We formulated the model as a system of differential equations as follows:
 |
Fig. 1.

Flowscheme of the model.
 |
 |
 |
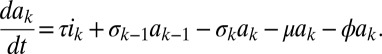 |
Here, s is the susceptible population, ik the infected population in stage k of the infection, and ak the population on ART who would revert to an infection of stage k (for k = 1,2,…,n) in case of treatment failure. The force of infection is determined by j, which is defined as
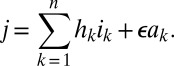 |
Here, parameter ϵ quantifies the reduced infectivity for an individual on ART, whereas the hk describe the infectivity in stage k of infection. The ρk and the σk denote transition rates from stage k to stage k+1 for untreated and treated individuals, respectively. The parameter τ represents the rate of moving from the untreated to the treated population, i.e., a combination of screening and treatment uptake. The parameter ϕ is the rate of moving from the treated back to the untreated population, i.e., the rate of dropping out of treatment. Finally, β denotes the recruitment into the population and μ the background mortality rate. A key parameter is λ, the transmission rate between susceptible and infected individuals. A summary of parameters and their default values are given in SI Appendix, Table S2. The model used by Granich is obtained from the above formulation by setting n = 4 and by assuming that ρk = ρ and σk = σ for all k (SI Appendix). Also, Granich’s model was formulated in terms of numbers and took varying population size into account, which we avoid by using population proportions. Finally, Granich’s model included a prevalence-dependent exponential term in the transmission parameter that served to capture density dependence and saturation effects for high prevalence. Density dependence does not play a role near threshold, so we simplified the model in that respect.
We then analyzed the threshold behavior of the model using theory described in refs. 16, 17. We showed that the threshold can be computed explicitly as a function of the model parameters for arbitrary values of n. We analyzed the threshold as a function of treatment-related parameters. In the absence of treatment, the threshold quantity is simply the basic reproduction number R0, whereas in the presence of treatment it defines the elimination threshold quantity Re. We parametrized the model for the case n = 4, because for this choice good estimates were available from literature on duration of stages and transmission rates per stage. We finally used the model to investigate how the elimination threshold depends on intervention parameters and how infectivity during primary infection impacts on possible intervention success. For details of the analysis we refer the reader to SI Appendix.
Natural History of Infection.
To parametrize the model we made use of investigations into progression rates from infection to death (18, 19) and estimates of the duration of stages with high and low infectivity, i.e., the (time-varying) potential for transmission given contact (20). Following Hollingsworth and colleagues we distinguished four stages of infection with varying duration and transmission rates, where the last two stages together defined the symptomatic AIDS stage. The AIDS stage is subdivided into an infectious and a noninfectious period (due to severe illness leading to cessation of sexual activity). The durations of the primary infection and the asymptomatic chronic stage were chosen based on estimated disease progression by CD4+ counts as estimated by the Concerted Action on SeroConversion to AIDS and Death in Europe (CASCADE) collaboration; these durations then determined the values of the progression rates between stages. Furthermore, we determined transmission rates for the different infectious stages from ref. 20 (Fig. 2 A and B). We assumed that disease progression is comparable across populations, i.e., that the same transition rates and infectivities can be used for different populations. The assumptions on progression rates were based on: the CASCADE study showing that progression did not differ by risk group, and only depended on the age at infection; a cohort study in Uganda, reporting progression rates in a sub-Saharan African population not to differ significantly from those in industrialized countries (21); and a metaanalysis (22), confirming the similarity in progression between those populations. Reliable estimates of per-contact transmission probabilities are only available for heterosexual couples. However, infectivity may be higher for unprotected anal intercourse, the main transmission route in men who have sex with men. We performed sensitivity analyses to investigate this possibility and other uncertainties (SI Appendix).
Fig. 2.

(A) Probability of being in a specific stage of infection as a function of time since infection (red: primary infection; green: chronic asymptomatic stage; blue: AIDS mild; magenta: AIDS severe); mean durations are stage 1: 0.271 y; stage 2: 8.31 y; stage 3: 1.18 y; stage 4: 1.32 y. (B) Infectivity of the different stages of infection. Stage 1 (red): 2.76/y; stage 2 (green): 0.106/y; stage 3 (blue): 0.64/y; stage 4 (magenta): 0.0/y. (C) Generation time distribution (blue shaded area) and cumulative fraction of secondary infections (red curve) as a function of time since infection.
In the model the stages of the population under treatment have no biological interpretation. They were chosen such that the survival probability has a distribution function that agrees with CASCADE data from the time period after introduction of ART. We made the additional assumption that individuals dropping out of treatment move into the corresponding nontreatment stage of infection. Therefore, for individuals under treatment the proportion of time spent in each stage is similar to that without treatment, but the absolute duration is longer as it is adjusted to the prolonged survival under treatment. With these assumptions we estimated the transition rates for individuals on treatment (for details see SI Appendix).
Basic Reproduction Number and Exponential Growth Rate.
The transmission parameter λ describes the speed of transmission between individuals and therefore determines the basic reproduction number R0. There are general methods for estimating R0 directly (23), but for HIV many of the assumptions usually made in estimation procedures are not fulfilled. On the other hand, estimates of incidence and/or exponential growth rates at the beginning of the HIV epidemic are more readily available and allow a more direct estimation of R0. Therefore, we made use of the following relationship between the basic reproduction number and the exponential growth rate:
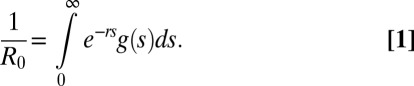 |
Here, g(s) denotes the generation time distribution, i.e., the probability density for the interval between the time of infection of an index and its secondary cases (24). The generation time distribution can be computed in terms of the parameters describing the progression through stages of infection and the transmission rates per stage (Fig. 2C). This means that if we can estimate the exponential growth rate r from data, the above formula gives us an estimate of R0 and therefore for λ. Once an estimate for λ is obtained, we have a formula for the elimination threshold depending on parameters τ and φ, which are determined by the program specifications, i.e., screening and treatment uptake and dropping out of treatment (SI Appendix). We plotted our results in terms of annual treatment uptake and annual dropout rate. To translate those results into results on coverage of treatment, we plotted the coverage as a function of annual treatment uptake for various values of the dropout rate. To do this, we assumed that coverage is at steady state with a constant force of infection.
So far, we have assumed that all underlying complexity of transmission patterns (i.e., heterogeneity in risk groups and contact patterns) can be subsumed under one parameter λ that links infectivity and exponential growth rate. To translate this assumption into a statement on elimination, we then start by assuming that these underlying transmission patterns have not substantially changed in between the onset of the epidemic (from when we derive an estimate of r) and the elimination phase. In other words, we assumed that risk behavior patterns and main risk groups have remained stable over the time of the epidemic. We then assessed elimination prospects with respect to the transmission potential in a population as witnessed by the speed of emergence at the onset of the epidemic. These assumptions can be relaxed to include behavioral heterogeneity and changes in risk behavior over time as detailed below.
To test the sensitivity of our results to assumptions on the distribution of infectivity over the infectious period, we varied the infectivity of the primary infection by shifting infectivity stepwise from primary infection to the chronic phase while retaining a constant total infectivity during the infectious lifetime. We analyzed how the elimination threshold changed with shifting infectivity.
Estimation of Exponential Growth Rates.
Exponential growth rates can be estimated directly from incidence data if available. However, for HIV, incidence rates are notoriously hard to estimate. There are estimates available for various populations based on back-calculation approaches (25, 26). These have also been used to derive basic reproduction numbers and doubling times of the epidemic (27). Other incidence estimates are derived from cohort studies (28) or from model fitting to prevalence and HIV surveillance data (29–31).
However, for many populations it is not possible to estimate incidence at the onset of the epidemic due to a lack of data from that time period. It is promising therefore to use estimates for the exponential growth rate based on phylogenetic analysis (32–35). In these studies, the evolution of genetic diversity of HIV is inferred from coalescent analysis. The coalescent is translated into a skyline plot showing how effective population size increased over time. Then a parametric demographic model is fitted to the skyline plot, allowing estimation of a population growth rate.
SI Appendix, Table S4 shows a compilation of estimates for the exponential growth rate r, basic reproduction number R0, and the doubling time d of the epidemic from various data sources. For studies that reported values for more than one quantity, we tested whether those estimates are compatible with our model of disease progression and infectivity. From the values reported for either r or R0 we computed the respective other quantity by making use of the relationship given in Eq. 1 and compared it to the reported value.
Heterogeneous Populations.
We extended our model to also take into account heterogeneity in sexual activity. This was done by subdividing the population into m subgroups of proportion qk with differing contact rates ck, k = 1,…,m. We assumed proportionate mixing between activity classes. As for the homogeneous population, the basic reproduction number and the elimination threshold can be computed explicitly. We investigated scenarios where the level of risk behavior in a small high-risk subpopulation decreased to a lower level as a consequence of behavior changes after onset of the epidemic. We studied the degree to which risk levels in the high-risk group need to decline in order for elimination to be attainable with a test and treat strategy.
Results
Natural History and Generation Time Distribution.
Fig. 2A shows the estimated survival, i.e., the probability to still be alive, together with the probabilities of remaining in a specific HIV disease stage as a function of time since infection based on the estimated transition rates for untreated individuals. The mean duration of primary infection is 0.27 y, of chronic infection 8.31 y, and the time from AIDS to death is 2.50 y. The mean survival is 11.08 y.
Fig. 2B depicts the infectivity in the four stages of infection as estimated in ref. 20. The infectivity in the last stage of infection is zero. Finally, in Fig. 2C these pieces of information are combined to obtain the generation time distribution and the fraction of secondary transmissions as a function of the time since infection under the assumption that the contact rate is constant during the infectious period. We observe that a large part of secondary transmissions are predicted to occur during the primary infection; almost 30% of secondary infections are produced in the first 6 mo and 36.4% of secondary infections are produced during the first year of infection. Our model predicts that even with annual screening a large part of these secondary infections will not be prevented by a test-and-treat strategy.
Together, variable infectivity and survival in various disease stages determine the relationship between epidemic growth rate r and basic reproduction number R0 (Fig. 3A). Similarly, this relationship can be shown in terms of the epidemic doubling time (Fig. 3B). An estimate for the epidemic growth rate or doubling time can now readily be translated into an estimate for the basic reproduction number.
Fig. 3.

(A) Relationship between epidemic growth rate and R0. (B) Relationship between epidemic doubling time and R0.
General Properties of the Elimination Threshold.
Feasibility of elimination is determined by the threshold quantity Re, which depends on all model parameters (SI Appendix). In Fig. 4A the elimination threshold is shown as a function of annual treatment uptake and the dropout rate for an exponential growth rate of 0.273 as in ref. 36. For those regions where Re< 1, i.e., where Re lies below the gray horizontal plane, elimination is possible.
Fig. 4.

(A) Elimination threshold Re as a function of annual treatment uptake and dropout rate for a population with an epidemic growth rate r of 0.273/y. (B) Relative threshold quantity Rf as a function of annual treatment uptake (blue) and dropout rate (red). The respective other parameter is kept constant: the blue curve assumes a dropout rate of 5%; the red curve assumes annual treatment uptake of 80%. Horizontal lines show where the elimination threshold is reached for different values of the exponential growth rate. The uppermost line denotes the threshold for r = 0.273, the lines below for multiples of that value. (C) Relationship between annual treatment uptake and the coverage at a steady state for different values of the dropout rate.
The relative elimination threshold Rf = Re/R0 depends only on disease progression with and without treatment, and on the infectivity in those stages, but not on λ (SI Appendix). Rf measures the transmission potential of HIV in a population under treatment with given treatment parameters, relative to the transmission potential of the untreated population. In other words, Rf describes the relative transmission potential in a treated population compared with the untreated population assuming that all is equal except the availability of treatment. Rf is always below 1 and is plotted in Fig. 4B as a function of annual treatment uptake and dropout rate, respectively, whereas the respective other parameter is kept constant. If an estimate of the exponential growth rate or of R0 is available, the required annual treatment uptake needed for elimination given a certain dropout rate can be found at the intersection of Rf with the constant level 1/R0. Fig. 4C then shows how coverage depends on annual treatment uptake for different dropout rates.
We investigated how the elimination threshold quantity Re changes with decreasing infectivity of primary infection (Fig. 5). The results shown here are computed for an exponential growth rate of 0.273/y as reported by Walker et al. (36) for sub-Saharan African countries and a 5% dropout rate per year. If infectivity is set at its baseline values (Fig. 2B), we found that annual treatment uptake of more 70% is needed for elimination which corresponds to a coverage above 85%. Lower values of treatment uptake suffice when infectivity is shifted to later stages of infection.
Fig. 5.

Impact of distribution of infectivity during the infectious period on the elimination threshold. The infectivity distribution from Fig. 2B leads to the upper red curve. Then infectivity is shifted stepwise from primary to chronic infection while retaining a constant total infectivity (coloring of curves shifting from red to green). With infectivity shifting to later stages of infection the required annual treatment uptake for elimination (dots) decreases. The epidemic growth rate is again set to 0.273/y and dropout rate is assumed to be 5% per year.
Elimination Thresholds Estimated from Exponential Growth Rates.
For some studies we found a discrepancy between the estimates for r and R0 (SI Appendix, Table S4) according to our disease progression model. In those studies, the estimated values of R0 are higher than would be expected from the reported exponential growth rate, possibly due to effects of underlying contact patterns. Interesting are the results reported in ref. 33, where exponential growth rates were estimated from genetic data for two HIV-1 subtypes. The two subtypes differed in their growth rates. If an infectious duration of 3 y was taken to compute the basic reproduction number, the estimates were similar to ours (SI Appendix, Table S4). Adopting a duration of infection of 10 y, the resulting estimated rates were much higher and inconsistent with ours. The underlying assumption in ref. 33 was that the probability of transmission did not change during the infectious period. When using reported exponential growth rates and model-derived values of R0 as a basis for comparison, we found that the values for R0 all lie within the range of 2.0 and 4.5 regardless of geographical location, population, and methodology of the study.
Elimination thresholds separate the parameter space defined by annual treatment uptake and dropout rates into the regions above the curves where elimination is possible, and below the curves, where elimination is not possible (Fig. 6A). With increasing R0 the conditions for elimination become more stringent. For the R0 values from SI Appendix, Table S1, elimination is possible for populations with R0 slightly above 2.0, increasingly difficult as R0 values approach 3.0, and impossible for populations with R0 > 3.0. However, even for the population with the lowest estimate of r (36), annual treatment uptake of more than 65% is required at a dropout rate of 5% corresponding to a coverage of more than 85%. If transmission probability under treatment is lower than our baseline value of 0.01 the elimination thresholds become more favorable (SI Appendix, Fig. S5). Lowering the reproduction rate by additional interventions shifts the thresholds downward; we computed the additional effort required (in terms of lowering the transmission rate) to reach elimination for a given treatment rate and dropout rate (SI Appendix, Fig. S6).
Fig. 6.

(A) Elimination threshold as function of annual treatment uptake and dropout rate for various values of the basic reproduction number R0. The two curves describe the threshold for R0 = 2.0 and R0 = 3.0. For parameter combinations above the lines, elimination is possible; for combinations below the curve it is not possible. (B) Elimination threshold in a heterogeneous population, where partner change rates declined between onset of the epidemic and start of prevention test-and-treat intervention. The epidemic growth rate at onset of the epidemic is 0.273/y. Elimination thresholds are shown as function of annual treatment uptake and dropout rate for various reduction percentages of the partner change rates of the high-risk population. For parameter combinations above the lines, elimination is possible; for combinations below the curve it is not possible.
Heterogeneous Populations.
For the type of contact pattern considered here, namely proportionate mixing among different subgroups of the population with differing contact rates, the heterogeneity in contact rates does not impact on the above analysis. In other words, the relationship between basic reproduction number and elimination threshold is not affected by heterogeneity. This result holds for heterogeneity in contact rates between individuals and certain forms of mixing. It does not carry over to situations where there is heterogeneity in how contacts are spaced in time, for example if there are long-term monogamous partnerships or if high risk occurs in episodic bursts (37, 38).
If there are differential changes in levels of risk between different risk groups, the relationship between the basic reproduction number and the elimination threshold changes. We used data from men who have sex with men (MSM) in the United Kingdom (39) as a basis for considering an example of a population where 80% have a low partner change rate (defined to be one new partner per year) and the remaining 20% have a higher rate (five new partners per year). We assumed an epidemic growth rate of 0.273 as in ref. 36, which corresponds to an R0 of around 2. If intervention succeeds in lowering the partner change rate of the 20% high-risk population, elimination will become more feasible, even if 80% of the population does not change their behavior. If the basic reproduction number is around 2 at the onset of the epidemic, a reduction of 50% in the partner change rate of the high-risk group brings elimination within reach (Fig. 6B). If the basic reproduction number is around 3, as is estimated for MSM populations in Western countries, more effort is needed in reducing risk levels in the high-risk group (SI Appendix, Fig. S7). This reflects the fact that the basic reproduction number is largely determined by small high-risk subgroups in the population. Note that we assume here that estimates of R0 from data––such as genetic sequence data––already implicitly incorporated heterogeneity in contact rates.
If there is heterogeneity between different strains or subtypes of the virus with respect to transmission probability and progression rates, the analysis can be made strain-specific. The overall basic reproduction number is then determined by the strain or subtype with the highest reproduction number.
Discussion
We designed a model reminiscent of Granich’s model, but better suited to describe the natural history and variable infectivity of HIV infection, to analyze the elimination threshold and its dependence on treatment-related variables (annual treatment uptake, dropping out of treatment, and reduction of infectiousness in treated persons) and transmission rate. The transmission parameter was estimated from exponential growth rates extracted from the literature. Assuming that exponential growth rates characterize the risk potential of a population, we assessed whether or not elimination is feasible in a population with a given growth rate. We found that elimination is only feasible in populations with very low basic reproduction number (around 2.0) and high annual treatment uptake, or if additional interventions substantially reduce the reproduction number.
In our modeling approach, basic reproduction number and elimination threshold both depend linearly on the transmission parameter, suggesting that both quantities are related to underlying contact patterns in the same way. This is confirmed by analysis of a model with different sexual activity levels and proportionate mixing. Further generalization of contact heterogeneity is possible along the same lines; however, for more general mixing patterns thresholds can only be computed numerically. Therefore, the ratio of basic reproduction number and elimination threshold is independent of transmission patterns. Moreover, the relationship between R0 and exponential growth rate is independent of the underlying model structure and solely reflects the distribution of infectivity over the infectious period. Our only assumption regarding contact patterns is that the rate of encountering new susceptible partners is time homogeneous. This may be violated for populations where a majority of individuals are in long-lasting monogamous partnerships or for so-called episodic risk (37). Including heterogeneity with respect to timing of contacts is more difficult and will be the subject of future research where we plan to combine our approach with models taking partnership duration into account as in refs. 40 or 41.
Our analysis––conducted for a model with four stages of infection and parameter values comparable to those in ref. 2–– extends the analysis by Granich et al. by taking variable infectivity into account. Incorporating these more realistic assumptions hugely influenced the results on feasibility of elimination. Our results demonstrated that assuming a uniform distribution of infectivity as in ref. 2 leads to much more optimistic expectations on the prospects of elimination. There is a debate on whether the estimates used in our model and originally reported by Hollingsworth exaggerate the infectivity of primary infection (14, 42), but we are reliant upon them in the absence of better alternatives. A further limitation is that these estimates were obtained from heterosexual couples and may therefore not be applicable for MSM or other risk populations. However, they represent the only relevant information available at this point. Assuming that Hollingsworth’s estimates correctly quantify the infectivity of primary infection, we conclude that in populations with a basic reproduction number >3 elimination is not feasible unless additional other interventions succeed in vastly reducing transmission or if substantial reduction of risk behavior has already occurred in the highest risk groups. If the basic reproduction number is 2.62, as computed on the basis of the reported epidemic doubling time in South Africa (2), elimination will be very hard to achieve taking into account the high annual treatment uptake of at least 80% and low dropout rate needed, which correspond to a coverage of more than 90%. In comparison, the World Health Organization estimates that by late 2010 in Africa 49% (confidence interval 46–52%) of people eligible for treatment were receiving ART (43).
A requirement for the application of the modeling approach is the availability of information on the exponential growth rate of the epidemic in its initial phase. The rationale of this approach can be compared with the concept of the critical vaccination coverage for vaccine-preventable diseases, where information from prevaccination epidemiology is used to determine the vaccination coverage needed for elimination of a disease in the future. We suggest the use of HIV sequence data to estimate early growth rates of the epidemic in specific populations. Some such estimates are available from coalescent analysis and may become more reliable if demographic processes of the host population are also taken into account (44). We expect that rapid development of sequencing methods and mathematical tools to use sequence data to gain insight into infection dynamics will become more important for public health in the future (45).
There are various directions in which the modeling approach laid out here can be extended. Various other types of population heterogeneity can be taken into account, such as age dependency and specific transmission risk groups. Also, if there is evidence for differences in transmission potential between different HIV subtypes, the model could be applied to those subtypes separately if estimates for exponential growth rates can be obtained. Such extensions would be useful for analyzing situations where treatment coverage is heterogeneously distributed or where treatment is targeted to specific population subgroups or HIV subtypes. The main conclusions from the work presented here are that elimination as a threshold phenomenon can be studied using information from the beginning of the epidemic, and that information from phylogenic analyses may be helpful for assessing the prospects of elimination. More research is needed to derive quantitative predictions that can be used for the design of effective and cost-effective intervention strategies.
Supplementary Material
Acknowledgments
P.J.B. and D.D.A. were supported by Medical Research Council, Unit Programme Number U105260566.
Footnotes
The authors declare no conflict of interest.
This article is a PNAS Direct Submission.
This article contains supporting information online at www.pnas.org/lookup/suppl/doi:10.1073/pnas.1301801110/-/DCSupplemental.
References
- 1.Velasco-Hernandez JX, Gershengorn HB, Blower SM. Could widespread use of combination antiretroviral therapy eradicate HIV epidemics? Lancet Infect Dis. 2002;2(8):487–493. doi: 10.1016/s1473-3099(02)00346-8. [DOI] [PubMed] [Google Scholar]
- 2.Granich RM, Gilks CF, Dye C, De Cock KM, Williams BG. Universal voluntary HIV testing with immediate antiretroviral therapy as a strategy for elimination of HIV transmission: A mathematical model. Lancet. 2009;373(9657):48–57. doi: 10.1016/S0140-6736(08)61697-9. [DOI] [PubMed] [Google Scholar]
- 3.Garnett GP, Baggaley RF. Treating our way out of the HIV pandemic: Could we, would we, should we? Lancet. 2009;373(9657):9–11. doi: 10.1016/S0140-6736(08)61698-0. [DOI] [PubMed] [Google Scholar]
- 4.Check Hayden E. ‘Seek, test and treat’ slows HIV. Nature. 2010;463(7284):1006. doi: 10.1038/4631006a. [DOI] [PubMed] [Google Scholar]
- 5.Wagner BG, Kahn JS, Blower S. Should we try to eliminate HIV epidemics by using a ‘Test and Treat’ strategy? AIDS. 2010;24(5):775–776. doi: 10.1097/QAD.0b013e3283366782. [DOI] [PMC free article] [PubMed] [Google Scholar]
- 6.Cambiano V, Rodger AJ, Phillips AN. ‘Test-and-treat’: The end of the HIV epidemic? Curr Opin Infect Dis. 2011;24(1):19–26. doi: 10.1097/QCO.0b013e3283422c8c. [DOI] [PubMed] [Google Scholar]
- 7.Cohen MS, et al. HPTN 052 Study Team Prevention of HIV-1 infection with early antiretroviral therapy. N Engl J Med. 2011;365(6):493–505. doi: 10.1056/NEJMoa1105243. [DOI] [PMC free article] [PubMed] [Google Scholar]
- 8.Donnell D, et al. Partners in Prevention HSV/HIV Transmission Study Team Heterosexual HIV-1 transmission after initiation of antiretroviral therapy: A prospective cohort analysis. Lancet. 2010;375(9731):2092–2098. doi: 10.1016/S0140-6736(10)60705-2. [DOI] [PMC free article] [PubMed] [Google Scholar]
- 9.Montaner JS, et al. Association of highly active antiretroviral therapy coverage, population viral load, and yearly new HIV diagnoses in British Columbia, Canada: A population-based study. Lancet. 2010;376(9740):532–539. doi: 10.1016/S0140-6736(10)60936-1. [DOI] [PMC free article] [PubMed] [Google Scholar]
- 10.Tanser F, Bärnighausen T, Grapsa E, Zaidi J, Newell ML. High coverage of ART associated with decline in risk of HIV acquisition in rural KwaZulu-Natal, South Africa. Science. 2013;339(6122):966–971. doi: 10.1126/science.1228160. [DOI] [PMC free article] [PubMed] [Google Scholar]
- 11.Dodd PJ, Garnett GP, Hallett TB. Examining the promise of HIV elimination by ‘test and treat’ in hyperendemic settings. AIDS. 2010;24(5):729–735. doi: 10.1097/QAD.0b013e32833433fe. [DOI] [PMC free article] [PubMed] [Google Scholar]
- 12.Eaton JW, et al. HIV treatment as prevention: Systematic comparison of mathematical models of the potential impact of antiretroviral therapy on HIV incidence in South Africa. PLoS Med. 2012;9(7):e1001245. doi: 10.1371/journal.pmed.1001245. [DOI] [PMC free article] [PubMed] [Google Scholar]
- 13. Walensky RP, et al. (2010) Test and treat DC: Forecasting the impact of a comprehensive HIV strategy in Washington DC. Clin Inf Dis. 51(4):392–400. [DOI] [PMC free article] [PubMed]
- 14.HIV Modelling Consortium Treatment as Prevention Editorial Writing Group HIV treatment as prevention: Models, data, and questions—towards evidence-based decision-making. PLoS Med. 2012;9(7):e1001259. doi: 10.1371/journal.pmed.1001259. [DOI] [PMC free article] [PubMed] [Google Scholar]
- 15.Kretzschmar ME, van der Loeff MF, Coutinho RA. Elimination of HIV by test and treat: A phantom of wishful thinking? AIDS. 2012;26(2):247–248. doi: 10.1097/QAD.0b013e32834e1592. [DOI] [PubMed] [Google Scholar]
- 16.Diekmann O, Heesterbeek JA, Roberts MG. The construction of next-generation matrices for compartmental epidemic models. J R Soc Interface. 2010;7(47):873–885. doi: 10.1098/rsif.2009.0386. [DOI] [PMC free article] [PubMed] [Google Scholar]
- 17.van den Driessche P, Watmough J. Reproduction numbers and sub-threshold endemic equilibria for compartmental models of disease transmission. Math Biosci. 2002;180:29–48. doi: 10.1016/s0025-5564(02)00108-6. [DOI] [PubMed] [Google Scholar]
- 18.CASCADE Collaboration Time from HIV-1 seroconversion to AIDS and death before widespread use of highly-active antiretroviral therapy: A collaborative re-analysis. Collaborative Group on AIDS Incubation and HIV Survival including the CASCADE EU Concerted Action. Concerted Action on SeroConversion to AIDS and Death in Europe. Lancet. 2000a;355(9210):1131–1137. [PubMed] [Google Scholar]
- 19.CASCADE Collaboration Survival after introduction of HAART in people with known duration of HIV-1 infection. The CASCADE Collaboration. Concerted Action on SeroConversion to AIDS and Death in Europe. Lancet. 2000b;355(9210):1158–1159. [PubMed] [Google Scholar]
- 20.Hollingsworth TD, Anderson RM, Fraser C. HIV-1 transmission, by stage of infection. J Infect Dis. 2008;198(5):687–693. doi: 10.1086/590501. [DOI] [PubMed] [Google Scholar]
- 21.Morgan D, et al. HIV-1 infection in rural Africa: Is there a difference in median time to AIDS and survival compared with that in industrialized countries? AIDS. 2002;16(4):597–603. doi: 10.1097/00002030-200203080-00011. [DOI] [PubMed] [Google Scholar]
- 22.Todd J, et al. Time from HIV seroconversion to death: A collaborative analysis of eight studies in six low and middle-income countries before highly active antiretroviral therapy. AIDS. 2007;21(Suppl 6):S55–S63. doi: 10.1097/01.aids.0000299411.75269.e8. [DOI] [PMC free article] [PubMed] [Google Scholar]
- 23.Diekmann O, Heesterbeek JA, Britton T. Mathematical Tools for Understanding Infectious Diseases Dynamics. Princeton: Princeton Univ Press; 2012. [Google Scholar]
- 24.Wallinga J, Lipsitch M. How generation intervals shape the relationship between growth rates and reproductive numbers. Proc Biol Sci. 2007;274(1609):599–604. doi: 10.1098/rspb.2006.3754. [DOI] [PMC free article] [PubMed] [Google Scholar]
- 25.Downs AM, Heisterkamp SH, Brunet JB, Hamers FF. Reconstruction and prediction of the HIV/AIDS epidemic among adults in the European Union and in the low prevalence countries of central and eastern Europe. AIDS. 1997;11(5):649–662. doi: 10.1097/00002030-199705000-00013. [DOI] [PubMed] [Google Scholar]
- 26.Gran JM, Wasmuth L, Amundsen EJ, Lindqvist BH, Aalen OO. Growth rates in epidemic models: Application to a model for HIV/AIDS progression. Stat Med. 2008;27(23):4817–4834. doi: 10.1002/sim.3219. [DOI] [PubMed] [Google Scholar]
- 27.Nishiura H. Correcting the actual reproduction number: A simple method to estimate R(0) from early epidemic growth data. Int J Environ Res Public Health. 2010;7(1):291–302. doi: 10.3390/ijerph7010291. [DOI] [PMC free article] [PubMed] [Google Scholar]
- 28.van Griensven GJ, de Vroome EM, Goudsmit J, Coutinho RA. Changes in sexual behaviour and the fall in incidence of HIV infection among homosexual men. BMJ. 1989;298(6668):218–221. doi: 10.1136/bmj.298.6668.218. [DOI] [PMC free article] [PubMed] [Google Scholar]
- 29.Bezemer D, et al. A resurgent HIV-1 epidemic among men who have sex with men in the era of potent antiretroviral therapy. AIDS. 2008;22(9):1071–1077. doi: 10.1097/QAD.0b013e3282fd167c. [DOI] [PubMed] [Google Scholar]
- 30.van Sighem A, et al. Swiss HIV Cohort Study Resurgence of HIV infection among men who have sex with men in Switzerland: Mathematical modelling study. PLoS ONE. 2012;7(9):e44819. doi: 10.1371/journal.pone.0044819. [DOI] [PMC free article] [PubMed] [Google Scholar]
- 31.Birrell PJ, et al. HIV incidence in men who have sex with men in England and Wales 2001–10: A nationwide population study. Lancet Infect Dis. 2013;13(4):313–318. doi: 10.1016/S1473-3099(12)70341-9. [DOI] [PMC free article] [PubMed] [Google Scholar]
- 32.Bello G, et al. Demographic history of HIV-1 subtypes B and F in Brazil. Infection, genetics and evolution. Infect Genet Evol. 2007;7(2):263–270. doi: 10.1016/j.meegid.2006.11.002. [DOI] [PubMed] [Google Scholar]
- 33.Salemi M, de Oliveira T, Ciccozzi M, Rezza G, Goodenow MM. High-resolution molecular epidemiology and evolutionary history of HIV-1 subtypes in Albania. PLoS ONE. 2008;3(1):e1390. doi: 10.1371/journal.pone.0001390. [DOI] [PMC free article] [PubMed] [Google Scholar]
- 34.Robbins KE, et al. U.S. Human immunodeficiency virus type 1 epidemic: Date of origin, population history, and characterization of early strains. J Virol. 2003;77(11):6359–6366. doi: 10.1128/JVI.77.11.6359-6366.2003. [DOI] [PMC free article] [PubMed] [Google Scholar]
- 35.Yusim K, et al. Using human immunodeficiency virus type 1 sequences to infer historical features of the acquired immune deficiency syndrome epidemic and human immunodeficiency virus evolution. Philos Trans R Soc Lond B Biol Sci. 2001;356(1410):855–866. doi: 10.1098/rstb.2001.0859. [DOI] [PMC free article] [PubMed] [Google Scholar]
- 36.Walker PR, Pybus OG, Rambaut A, Holmes EC. Comparative population dynamics of HIV-1 subtypes B and C: Subtype-specific differences in patterns of epidemic growth. Infection, genetics and evolution. Infect Genet Evol. 2005;5(3):199–208. doi: 10.1016/j.meegid.2004.06.011. [DOI] [PubMed] [Google Scholar]
- 37.Alam SJ, et al. Detectable signals of episodic risk effects on acute HIV transmission: Strategies for analyzing transmission systems using genetic data. Epidemics. 2013;5(1):44–55. doi: 10.1016/j.epidem.2012.11.003. [DOI] [PMC free article] [PubMed] [Google Scholar]
- 38.Romero-Severson EO, Alam SJ, Volz E, Koopman J. Acute-stage transmission of HIV: Effect of volatile contact rates. Epidemiology. 2013;24(4):516–521. doi: 10.1097/EDE.0b013e318294802e. [DOI] [PubMed] [Google Scholar]
- 39.Mercer CH, et al. Increasing prevalence of male homosexual partnerships and practices in Britain 1990-2000: Evidence from national probability surveys. AIDS. 2004;18(10):1453–1458. doi: 10.1097/01.aids.0000131331.36386.de. [DOI] [PubMed] [Google Scholar]
- 40.Xiridou M, Geskus R, De Wit J, Coutinho R, Kretzschmar M. The contribution of steady and casual partnerships to the incidence of HIV infection among homosexual men in Amsterdam. AIDS. 2003;17(7):1029–1038. doi: 10.1097/00002030-200305020-00012. [DOI] [PubMed] [Google Scholar]
- 41.Leung KY, Kretzschmar ME, Diekmann O. Dynamic concurrent partnership networks incorporating demography. Theor Popul Biol. 2012;82(3):229–239. doi: 10.1016/j.tpb.2012.07.001. [DOI] [PubMed] [Google Scholar]
- 42.Cohen MS, et al. HIV treatment as prevention: Debate and commentary—will early infection compromise treatment-as-prevention strategies? PLoS Med. 2012;9(7):e1001232. doi: 10.1371/journal.pmed.1001232. [DOI] [PMC free article] [PubMed] [Google Scholar]
- 43.WHO Antiretroviral therapy (ART) coverage among all age groups. Available at www.who.int/gho/hiv/epidemic_response/ART_text/. Accessed November 4, 2012.
- 44.Volz EM. Complex population dynamics and the coalescent under neutrality. Genetics. 2012;190(1):187–201. doi: 10.1534/genetics.111.134627. [DOI] [PMC free article] [PubMed] [Google Scholar]
- 45.Kretzschmar M, Gomes MG, Coutinho RA, Koopman JS. Unlocking pathogen genotyping information for public health by mathematical modeling. Trends Microbiol. 2010;18(9):406–412. doi: 10.1016/j.tim.2010.06.008. [DOI] [PubMed] [Google Scholar]
Associated Data
This section collects any data citations, data availability statements, or supplementary materials included in this article.