

Significance
We show that monkeys display similar risk preferences and rationality to those of humans, suggesting that despite concerns raised by earlier reports, they can serve as a model for human behavior. Standard experimental economic techniques have long allowed us to evaluate human risk attitudes, but we do not know how they relate to wealth levels, a critical variable in economic models. We find thirsty monkeys to be more risk averse and discuss implications for the role of wealth in human decision making.
Keywords: utility, satiety
Abstract
Experimental economic techniques have been widely used to evaluate human risk attitudes, but how these measured attitudes relate to overall individual wealth levels is unclear. Previous noneconomic work has addressed this uncertainty in animals by asking the following: (i) Do our close evolutionary relatives share both our risk attitudes and our degree of economic rationality? And (ii) how does the amount of food or water one holds (a nonpecuniary form of “wealth”) alter risk attitudes in these choosers? Unfortunately, existing noneconomic studies have provided conflicting insights from an economic point of view. We therefore used standard techniques from human experimental economics to measure monkey risk attitudes for water rewards as a function of blood osmolality (an objective measure of how much water the subjects possess). Early in training, monkeys behaved randomly, consistently violating first-order stochastic dominance and monotonicity. After training, they behaved like human choosers—technically consistent in their choices and weakly risk averse (i.e., risk averse or risk neutral on average)—suggesting that well-trained monkeys can serve as a model for human choice behavior. As with attitudes about money in humans, these risk attitudes were strongly wealth dependent; as the animals became “poorer,” risk aversion increased, a finding incompatible with some models of wealth and risk in human decision making.
What We Know About Humans.
Significant headway has been made toward understanding human choice behavior under risk. At a theoretical level, any logically consistent chooser behaves as if he consults a continuous monotonic internal representation of utility. Choice is then the process of maximizing utility (see ref. 1 for a review). At an empirical level, consistent human choosers are typically somewhat risk averse, maximizing a weakly compressive utility function. Logically inconsistent choosers do not reflect such a maximization process (2–5), in principle.
Less headway has been made in understanding how wealth level affects risk attitudes. Although a consensus view is that choosers should become less risk averse as wealth levels increase (6–8), solid empirical data have been difficult to obtain because wealth levels are hard to systematically manipulate in humans.
What We Know About Animals.
The risk attitudes of many species have been assessed, both with and without confirmation that choosers are logically consistent (9–11), with variable and sometimes controversial results (12). Caraco and colleagues (13), for example, found that sparrows were risk averse over food choices in a manner similar to that of humans, but that this depended on how many calories the subjects had already stored internally—a form of primitive consumption-related “wealth” shared by all animals and premonetary humans. When the birds were heavily food deprived (low caloric stores for future consumption or wealth), they became risk seeking. However, later studies in starlings challenged this conclusion, suggesting persistent risk aversion across a broad range of food “wealth levels” (14).
Studies in laboratory monkeys, a standard neurobiological model for human choice, have been equally confusing. Some widely cited studies even suggest that rhesus monkeys are hugely and consistently risk seeking under typical experimental conditions (11, 15), preferences that lie far outside the range observed in humans and have been used to challenge the notion that monkeys are an appropriate model for the study of human choice behavior.
The Present Study.
To engage these issues we tested three sequential hypotheses: (i) Are trained rhesus macaques consistent in their behavioral choices in the technical economic sense? (ii) If they are consistent, are they risk averse or risk neutral like humans or are they necessarily massively risk seeking? And (iii) if they are consistent and risk averse or risk neutral, can we assess how nonmonetary wealth (how much water they have stored internally, measured as hydration state) affects risk preference?
We therefore examined choice behavior in monkeys performing a gambling task for fluid rewards. After significant training, our monkeys began to show consistent maximization behavior, allowing meaningful assessment of risk preferences, using both nonparametric and model-based methods. Like humans, our animals were weakly risk averse (following economic definition we define weak risk aversion as preferences that cannot be statistically differentiated from risk aversion or risk neutrality). Examined as a function of the amount of water the subjects possessed before choice trials [quantified by measuring blood osmolality (16)], subjects “richer” in terms of water were less risk averse over identically sized rewards. They showed diminishing absolute risk aversion over a consumable reward.
Summary.
Our results differ from earlier studies suggesting that rhesus monkeys cannot show human-like preferences and support the hypothesis that trained rhesus monkeys can be consistent weakly risk-averse choosers like their human counterparts. Our empirical study of wealth levels with regard to a consumable reward may raise questions about the applicability of some standard economic models of wealth and choice to consumable rewards.
Results
To determine whether monkeys are, like humans, roughly consistent in their choices and to measure risk attitudes, we trained monkeys to perform a visual gambling task, similar to previous experiments with human subjects (17). After monkeys fixated on a central spot (Fig. 1A), risky and certain options were presented to the left and right of fixation. Monkeys made choices by shifting their gaze to one of the options. The magnitude of the certain option was randomly varied across four different blocks (“payoff conditions,” Fig. 1B, rows). The magnitude of the certain reward within each block was indicated on each trial by a pie chart. Five risky options, offering a 50% chance of no reward and a 50% chance of a reward larger than the certain option (except in three pairings), were presented in random order from trial to trial (Fig. 1B, columns). Each block began with 36 forced-choice trials (Fig. 1C), during which the monkey sampled each certain option and the five risky options six times. These were followed by 50 free-choice trials, during which the monkey reported its preferences. Once these 86 trials were completed, the payoff condition changed and the process repeated until all four payoff conditions had been sampled (20 lotteries, total of 344 trials). On individual days, monkeys completed this process one to three times.
Fig. 1.

Task. (A) The sequence of events in free- and forced-choice trials. In the forced-choice trials, monkeys were required to choose color-matched targets. Positions of the risky and certain options were fixed during a payoff condition in a block. (B) Choice matrix: In each payoff condition the monkey would choose between a certain fixed amount of juice and a lottery that would deliver a reward with 50% probability (five different risky reward magnitudes per condition). For example, in payoff condition 1, the certain 60-μL reward was represented by a 1/10th-filled pie chart and the risky option by a pie chart ranging from empty to 4/10th full. Risky options with expected value equal to the certain option are shown in blue. (C) Example payoff condition sequence (randomly selected without replacement until all four payoffs were presented).
Effects of Training on Consistency of Choice Behavior.
To assess whether monkeys understood the task and behaved consistently in the technical economic sense (whether they were maximizing something with their choices), we embedded two “control” choice problems in the second payoff condition (Fig. 1B, row 2) from the beginning of the training. The first of these control problems offered a choice between a certain 120-μL reward and a 50% chance of a 120-μL reward. In this choice, the certain reward first-order stochastically dominates the risky reward (18): Any subject who has a weakly monotonic utility function of any kind must choose the certain reward in this situation. Subjects who do not consistently choose the certain reward in these trials cannot be said to be maximizing anything with their behavior, cannot be described as choosing according to a utility function of any kind, and cannot be described using standard economic models (19). Importantly, making a statement about the technical risk attitude of a chooser who violates first-order stochastic dominance is not, in principle, possible (4). Inclusion of this choice problem thus allows us to verify that statements about risk attitudes are meaningful in a given dataset.
The second of these control problems offered a certain 120-μL reward or a 50% chance of a 360-μL reward. Given the difference in the expected values of these rewards (120 μL vs. 180 μL), we assumed that monkeys with reasonable risk preferences would select the risky option and thus used this lottery as a further test that the monkeys understood the experimental conditions.
To navigate both these two control problems and the other experimental choices, monkeys needed to (i) associate the pie charts with reward magnitude, (ii) learn that the probability of receiving the risky reward was always 50%, and (iii) learn which target was associated with the certain and risky rewards within each block. To train the monkeys, we initially presented only the two control problems described above. During the first 5 d of training, monkeys chose among the two options randomly irrespective of risky offer magnitude (Fig. 2), appearing to poorly understand the task. Over the next 10 d, monkeys began to discriminate between offers and quickly learned to choose the risky option when the risky option offered a larger reward than the certain option (Fig. 2A). However, during this time, monkeys did not choose the better certain option frequently in the stochastic dominance test (Fig. 2B), as required of any maximizing agent. The considerable frequency of these “mistakes” suggests an initial failure of subjects to understand the probability representation in our task. These mistakes were highly prevalent for up to 20 d of training. Monkeys did, however, gradually shift to an efficient maximization behavior like that shown by humans under these conditions (20, 21), choosing the nondominated option only 2.91% ± 0.85% (monkey HU) and 4.53% ± 1.37% (monkey DE) of the time after training was complete (combining data from the first and second epochs) (SI Methods and Table S1).
Fig. 2.

Effect of training on monkeys’ choice. (A and B) Plots of the percentage of risky (A) and certain (B) lottery choices through all epochs of the experiment. Data include choices from two control trial types only (white, 100%, 120 μL vs. 50%, 360 μL; and dark gray, 100%, 120 μL vs. 50%, 120 μL). (Insets) “EV Diff” is the difference in expected value between risky and certain lottery. Horizontal lines indicate a chooser who prefers the higher expected value option 70% of the time.
Once animals consistently preferred a very high expected value to a low expected value (Fig. 2A) and consistently preferred a high probability of a 120-μL reward to a low probability of a 120-μL reward (Fig. 2B), we used two analytic strategies to assess their risk attitudes. First, we used a purely nonparametric (model-free) approach. Second, we used a simple and widely used model-based approach, expected utility theory, to estimate a parametric utility function as a simple tool for quantifying risk attitude. It should be noted that although these two methods do differ, they rank order the set of all possible risk attitudes identically. We note that because we examined only choices that offered gains (as opposed to losses) at a single probability (0.5), expected utility theory and prospect theory are identical in their predictions and features for the purposes of this analysis. One could certainly refer to the model we used, expected utility, as loss-free probability-restricted prospect theory.
Nonparametric Risk Attitude Assessment.
How do overall risk attitudes change with training? How are they related to the violations of utility theory observed early in training? To assess this nonparametrically we computed, for each daily dataset for each subject, the percentage of trials in which the risky option was chosen. Although precise definitions of risk attitude require a parametric model, all such models identify a subject who always chooses the risky option in our choice set as more risk seeking than one who chooses the risky option rarely. As a benchmark, we use the number of times a risk-neutral chooser would select the risky option. We adopt here the standard definition of risk-neutral chooser who is indifferent between risky and riskless options that have equal expected value. Fig. 3A plots daily risk attitude in this manner for the two monkey subjects, with the dotted line showing the behavior of a risk-neutral chooser (50% risky choice). Comparing Figs. 2B and 3A (which share a common x axis), we can see that as monkey choosers become consistent, as indexed by obeying first-order stochastic dominance, they approach risk neutrality and even weak risk aversion. Thus, monkey subjects, at least in this task, serve as reasonable models of human decision makers with regard to both their consistency and their risk attitudes. Further, compliance with first-order stochastic dominance means that, in principle, this observed behavior can be adequately modeled with a utility-function style analysis (4, 7, 22, 23). Utility-function analyses are, of course, controversial. Many have pointed out (e.g., refs. 22–24) that these analyses can be highly misleading when choosers show inconsistent behavior. It is essential to note, however, that once our monkeys show consistent behavior after training, their behavior is specifically of the type utility theory was designed to describe. One can, of course, argue that these parametric analyses are of no interest but one cannot in this case argue that these analyses are misleading or inaccurate. That they are accurate under these conditions is a matter of mathematical proof (4).
Fig. 3.

Day-by-day risk sensitivity throughout training and first and second epochs. (A) Nonparametric analysis, percentage of risky choices. (B) Parametric analysis, daily values of α. Large plots exclude days with α > 3 (all data presented in Insets). Error bars show SEM. Dashed lines in A and B indicate risk neutrality. (C) Values of β (stochasticity in choice) estimated for each day. In A–C, the values were estimated after monkeys had experienced at least three different types of trials (100%, 120 μL vs. 50%, 120 μL, 240 μL, and 360 μL in payoff condition 2; days 13 and 15 for monkeys HU and DE, respectively).
Parametric Risk Attitude Assessment.
To parametrically quantify risk attitude, we estimated each monkey’s risk attitude on a daily basis, using a simple model common to expected utility theory and prospect theory: 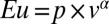 with a logistic function for choice (see Methods and Fig. 4A for model fitting). In this model, an exponent (α) greater than 1 indicates risk seeking, an α = 1 indicates risk neutrality, and an α < 1 indicates risk aversion. We found that monkeys were risk seeking early in training, but this risk-seeking behavior (α > 1) became risk neutral (α statistically indiscriminable from 1.0) and then slightly risk averse (α < 1) as the monkeys gained experience (Fig. 3B). Notably, this shift to a risk-neutral or a risk-averse estimate closely paralleled the monkey’s shift toward consistency as indexed by obeying first-order stochastic dominance (Fig. 2B). This suggests that when choice behavior is technically inconsistent (and utility models assuming monotonicity should not be applied), behavior erroneously appears risk seeking, using such analyses. When, however, monkeys shifted to effective maximization behavior and expected utility theory can be properly applied, the monkeys showed risk-neutral or risk-averse utility functions (Fig. 3B). Overall choice stochasticity (β: logistic choice function slope) (SI Methods) also changed through training; perhaps unsurprisingly, the choices of the monkeys became less stochastic as training continued (Fig. 3C).
Fig. 4.

Well-trained rhesus monkeys were slightly risk averse for fluid rewards. (A) Probability of risky choice plotted against reward magnitude in each payoff condition (indicated by color). Solid, colored choice curves were fitted using maximum-likelihood estimates of α and β. Dashed colored lines indicate where risky and certain options have equal expected value. (B) Plot of the estimated utility function for each monkey. (C) Estimated α in each of 34 d during the first and second epochs. Black arrowheads indicate means. Dashed black lines indicate risk neutrality.
Aggregate Choice Data After Training.
After our subjects had experienced all 20 lottery pairs and completed training (Figs. 2 and 3), we collected 10,517 and 7,501 free-choice trials in monkeys HU and DE, respectively, over the course of 34 d distributed over two nonsequential months (first and second epochs) (Methods). To assess risk attitudes, we first pooled data across conditions, yielding four datasets for each monkey corresponding to the four payoff conditions depicted in Fig. 1B. Each payoff condition thus yielded a single choice curve with a single indifference point (Fig. 4A). Five red points depict the average choices of monkeys HU and DE in payoff condition 1: a certain reward of 60 μL of water or a 50% chance of gaining 5, 60, 120, 180, or 240 μL of water. The dark blue points plot choices in payoff condition 2: a certain reward of 120 μL and a range of risky rewards (120–360 μL); similarly, the green and turquoise points plot choices in payoff conditions 3 and 4. Well-trained monkeys, like humans, lawfully transitioned to selecting the risky lottery as the value of the risky lottery grew. Additionally, as the magnitude of the certain reward grew, choice curves lawfully shifted to the right.
The solid lines in Fig. 4A plot the choices of the parametric utility model fitted simultaneously to the entire aggregate dataset. When the risky and certain options offer identical expected value, a risk-neutral chooser would be indifferent (vertical dashed lines). If the fitted curves are shifted to the left of the points where the P = 0.5 line crosses the colored dashed lines, the subject can be defined as risk seeking. Curves shifted to the right indicate risk aversion. The corresponding fitted utility functions are plotted in Fig. 4B.
Overall, the power utility function fitted the data well (Fig. 4A, maximal log-likelihoods = −4,354.1 and −3,314.5 in monkeys HU and DE, respectively), confirming that subjects behaved in a globally rational, or consistent, manner. Monkeys were slightly, but significantly, risk averse as assessed with this tool (log-likelihood–ratio test, P < 0.001, mean ± SEM: monkey HU, α = 0.921 ± 0.004, β = 0.081 ± 0.003, log-likelihood = −4,354.1; monkey DE, α = 0.953 ± 0.005, β = 0.060 ± 0.002, log-likelihood = −3,314.5).
Daily Choice Data After Training.
We also examined the risk attitudes of each monkey on each day to determine the degree of variability in risk preferences. The dataset for each of 34 d consisted of 200–600 free-choice trials collected in one to three repetitions of the four payoff condition blocks. A histogram of daily α-values for each subject (Fig. 4C) showed, on average, weak but significant risk aversion across days (one-sample t test: monkey HU, α = 0.929 ± 0.014, P < 0.001; monkey DE, α = 0.965 ± 0.013, P < 0.001).
Effect of Thirst on Risk Attitudes.
Unlike several previous studies, our monkeys were risk averse or risk neutral, like human subjects in similar tasks (17, 24). Could this discrepancy reflect a disparity between the metabolic state (the water wealth) of our subjects and the metabolic states of subjects in other studies? The controversial observation that birds become risk seeking as they get hungrier (13) might suggest that as our subjects become thirstier they should also become more risk seeking. To examine this prediction, we measured the relationship between daily blood serum osmolality [a physical index of water wealth (16)] and risk attitude for 17 d during the second epoch of our data collection. Blood was collected from each monkey each day about 30 min before testing began.
We found, perhaps surprisingly, that the level of risk aversion increased significantly as the total water that the monkey possessed decreased. As shown in Fig. 5A, the frequency of risky option selection (our nonparametric estimate of risk attitude) declined as water-wealth levels fell (linear regression in each monkey: monkey HU,  = −0.012 ± 0.02, P < 0.001; monkey DE,
  = −0.004 ± 0.001, P = 0.007). Parametric analysis yielded an identical result (Fig. 5B). As animals became more thirsty, they became more risk averse (linear regression in each monkey: monkey HU,
  = −0.013 ± 0.002, P < 0.001; monkey DE,
  = −0.007 ± 0.002, P = 0.001). To additionally characterize risk sensitivity as a function of water wealth, we fitted all of the data with a utility function of the form
 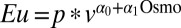 and a choice function of the form
  , which model risk attitude and choice stochasticity as comprising a constant component and an osmolality-dependent level. We found that risk attitude was negatively correlated with osmolality level (α1 = −0.0061 ± 0.0027, P = 0.024) whereas choice stochasticity was independent of osmolality level (β1 = −0.0018 ± 0.0017, P = 0.312). These data suggest that not only were our subjects weakly risk averse, but also thirstier monkeys are more risk averse. In the language of economics, our monkeys showed diminishing absolute risk aversion over water reward.
Fig. 5.

Hydration state correlated with risk attitude in each monkey. (A) Proportion of risky choices and (B) risk estimate (α) in each day of the second epoch are plotted against serum osmolality. Solid lines indicate regression lines.
This effect of thirst level on risk attitude was also evident in behavioral changes observed within single days (Fig. S1). We determined this by dividing each daily dataset from the first and second epochs in half, obtaining beginning-of-the-day and end-of-the-day halves. First and second half datasets (Fig. S1 A and B) produced significantly different estimates of α at P < 0.001 (two-sample t test, Fig. S1C). Monkeys were less risk averse when they were more hydrated within a day (less thirsty) (see ref. 16 for time course of hydration). Over the range of osmolalities we explored, increasing thirst (decreasing water wealth) made our animals more risk averse rather than more risk seeking.
Discussion
Risk Preferences of Monkeys.
Risk preferences have been measured previously in different species, using a variety of procedures and designs. The two most widely cited studies suggest that monkeys are, unlike humans, always quite risk seeking (11, 15). The degree of risk seeking proposed for these animals would, in fact, place them well outside the range ever observed in human decision makers [see, for example, Holt and Laury (17)] and might suggest that monkeys are a poor model for human choice behavior.
In one of these studies, McCoy and Platt (11) offered monkeys choices between a certain gain of 150 μL and a 50% chance of winning either more or less in a variable option, with the constraint that the high-variance option always had an expected value of 150 μL. Their monkeys preferred the variable option even when high variances were used. All trials offered to the monkeys, however, had equal expected values and all choices were offered many times. Thus, the choices of the animals had no significant impact on fluid consumed averaged over tens of trials. One might hypothesize that the animals in that study were thus under little pressure to behave consistently, in the economic sense, and we do not know if these animals obeyed the first-order stochastic dominance or monotonicity assumptions required for a utility-theoretic analysis. In the other study, O’Neill and Schultz (15), using a similar strategy while recording from orbitofrontal neurons, drew a similar conclusion.
In contrast to these two classic studies of monkey risk attitudes, classic estimates of human utility function curvature (17, 25) nearly always show weak to moderate risk aversion or at most risk neutrality, under conditions like ours where multiple choices are sequentially realized. Related studies of humans by our group have never observed a consistent chooser with an α greater than 1.2, with average choosers exhibiting an α of 0.7 (26). It is important to note that even human risk attitudes vary from study to study; Hayden and Platt (27) found that human choosers can show risk-seeking behavior for both juice and monetary rewards under some conditions.
One possible source of this discrepancy between our monkey data and the data in previous studies may be the larger range of payoff conditions we used. In McCoy and Platt (27), the largest reward ever offered was 250 μL. It may be the case that if the reward amount for the certain option is held to this specific range, subjects may be less interested in all certain options. Indeed, in a recent study, So and Stuphorn (28) found that monkeys appeared to prefer the risky option only when the certain outcome was small (less than 120 μL), a hypothesis for which there may be some evidence in the behavior of monkey DE (Fig. S2).
Risk-seeking behavior in rats has also been suggested both to occur and to disappear as the number of food pellets associated with a certain reward increases (29). These findings suggest that the range of reward magnitudes being offered may be a factor in determining risk attitude, but direct measurements of choice consistency are not available for these studies, making unambiguous interpretation with regard to economic risk attitudes difficult.
Effect of Satiety State on Risk Attitudes.
In this study, both monkeys showed weakly risk-averse behavior for water rewards that varied as a lawful function of hydration state. Day-to-day and within-day changes in risk attitudes were tightly correlated with blood osmolality, with thirstier (poorer) monkeys more risk averse and more satiated (richer) monkeys closer to risk neutral. This observation is inconsistent with the Caraco et al. study in birds (13). Although they did not estimate the overall form of the utility function for their subjects, Bateson and Kacelnik (30), studying starlings under similar conditions, showed a pattern of risk attitudes broadly similar to the one we observed.
Economic Models of Risk Attitudes as a Function of Wealth.
In the economics literature, the appropriate modeling assumptions for the study of decision making under risk have been a subject of ongoing debate, especially with regard to the relationship between financial wealth and risk attitude (8, 31–33), as well as the relationship between factors like satiety and risk attitude. Some of the unresolved issues are the following: Do people integrate their financial decisions with their current wealth level? If yes, to what extent? Do risk attitudes change as a function of wealth, as most normative theories require? Can biological stores of resources be treated as an evolutionarily primitive form of wealth in the economic sense or only as a form of state dependence? Answering these questions can inform our understanding of functional forms for the relationship between risk attitude and wealth in humans.
One reason these questions remain unanswered is that very few within-subject data on the relationship between wealth level and risk attitude are available in humans. Instead, existing studies usually rely on self-reported wealth measures compared across subjects (e.g., survey data), and these two constraints limit the accuracy and reliability of many existing datasets. Animal studies may thus shed light on the interaction between wealth and risk attitude at a level of detail that has not previously been possible in human subjects—if we can use the amount of a valuable resource, in this case water, possessed by a monkey as model for thinking about wealth.
Traditionally, satiety effects have been viewed in terms of state-dependent utility functions, and our results can be interpreted equally validly in this framework. However, we suggest that viewing physiological quantities such as energetic state or hydration status as forms of wealth may allow a broader understanding of wealth-related effects in both humans and animals. Like monetary wealth, total water level—even when it is stored within the interstitial spaces of the body rather than an external container—can be accumulated, can be consumed (in the form of sweat or urine), and can affect the valuation of further acquisitions. If wealth is defined as a stock of resource that can be stored and used to fund present or future consumption, then a human who possesses water in an arid climate, whether or not she can trade it, and whether or not she drinks it, can be considered wealthy. To put this more apocryphally, a desert camel who possess 10 L of water in a clay jar should probably be considered just as rich as one who stores that water in his hump.
Critically, if human sensitivity to wealth levels evolved in the primate line before the advent of fiat currencies, it may be that the neurobiological mechanisms that mediate the relationship between consumption wealth and risk attitudes in monkeys are related to the human mechanisms that play a similar role in other domains. It seems likely that the biological mechanisms that mediate changes in risk attitudes with wealth evolved around satiety mechanisms rather than around mortgages. If that is true, then these findings provide unique insights into how the desirability of rewards quantitatively varies with the most primitive form of wealth—satiety.
Our monkeys exhibited a lawful relationship between risk aversion and water wealth, suggesting that decision making under risk has to incorporate the water-wealth level. In this study, monkeys paid a higher premium to avoid a risky lottery when their water-wealth level was low. Consider a monkey given the choice between getting 240 μL for sure and getting 480 μL or nothing with equal probability. When satiated monkey HU had an α = 0.965 at osmolality 308, he was willing to give up 1.9% of the expected value (EV) of the lottery (4.8 μL) to avoid the risky option. The same monkey was on average more risk averse when he was thirstier (α = 0.792 at osmolality 321), and the required risk premium was more than twice as large (4.3% EV). This wealth-dependent change in risk aversion occurs in absolute terms (change in risk premium, measured in microliters or in percentage of EV) as well as in relative terms (change in risk premium normalized by wealth level): As monkeys grow wealthier in terms of water, they become less risk averse in both absolute and relative terms.
The decreasing absolute risk aversion as wealth level grows in this study is in line with the economic intuition that the utility function flattens as wealth increases, but the theoretical details here are more complex. Relative risk aversion, a change in one’s risk attitude when making decisions about a constant fraction of one’s total wealth, is more controversial: Economists argue about whether it increases or decreases with wealth (8, 32). This is a matter of some importance in the economic domains of development and institutional design, where poor countries with hungry populations must develop economic systems that maximize the accumulation of wealth. There is already some evidence that hungry people make financial decisions differently from sated people (34–36). And it is widely acknowledged that poor people make different decisions about whether to accept a particular risk than do their more wealthy peers (37–39). In our data, the richer monkeys become, the less risk averse they become, even in relative terms, consistent with decreasing relative risk aversion with increasing wealth. If this is a more global feature of how risk attitudes change with wealth in the developing world, it may be of broad economic significance.
Summary.
Recent developments in neuroeconomics have begun to reveal the neural basis of decision making under risk and uncertainty (40–43). Our data, unlike those in previous studies, suggest that at least under some conditions monkeys can be good behavioral models for humans in this regard. It is also clear, however, that most of the brain regions related to value-based decision making are affected by satiety state (44, 45), although this has not been widely examined. If our results generalize to other forms of wealth, they suggest that risk attitudes decline as both absolute and relative functions of wealth. Our results suggest the importance of a quantitative understanding of how satiety for food and fluid rewards affects the neural processes that produce risk preferences in each individual.
Methods
Subjects and Surgical Procedures.
Two rhesus monkeys were used (DE, 7.5 kg, 6 y; HU, 8.0 kg, 6 y). All experimental procedures were approved by the New York University Institutional Animal Care and Use Committee and performed in compliance with the Public Health Service’s Guide for the Care and Use of Animals. Before training, each animal was implanted with a head-restraint prosthesis and a scleral eye coil (46), using standard techniques (47).
Experimental Procedure.
Eye movements were measured using a scleral coil at 500 Hz. Visual stimuli were generated by cathode ray tube 30 cm from the monkey’s face. Monkeys were seated using standard methods (47). During the first 3 mo, the “training epoch,” subjects practiced the lottery task. After animals were proficient and estimates of risk attitudes had stabilized, a 1-mo “first epoch” began. Data were gathered 4–5 d/wk. A second month of data collection followed, the “second epoch,” during which blood osmolality was sampled immediately before each daily session (16).
Water Access Control.
In the approved protocol we used, monkeys received a fixed minimal daily allocation of water determined independently for each individual and based on our prior studies of blood osmolality and controlled water access (16). Monkeys HU and DE obtained daily water of at least 150 mL and 140 mL, delivered in at least two separate daily rations, through all of these experiments, respectively. The monkeys usually obtained ∼50–80% of the allocation during the task. During the training and the first epochs, monkeys usually obtained ∼100–150 mL (monkey HU) or ∼50–120 mL (monkey DE) of water during the task. During the second epoch, they obtained about 50 mL of water reward during the task. Additional water was delivered such that no animal was without water for 16 h.
Blood Osmolality Measurements.
Blood was drawn from monkeys ∼30 min before behavioral testing during the second epoch. At least 0.5 mL serum was extracted from the 1.5-mL blood sample by centrifugation, and 0.2-mL samples of the extracted serum were measured using a freezing-point method (16).
Supplementary Material
Acknowledgments
The authors thank Daniel Burghart and Robert Won and also Samanta Shaw, Margaret Grantner, and Lauren Grattan for technical assistance. This paper benefited enormously from interactions about the economic notion of wealth that the authors had with one of the anonymous reviewers. Some of the material in the Discussion reflects the direct input of that individual, to whom we here express our gratitude. This work was supported by the National Institutes of Health Grant EY-10536.
Footnotes
The authors declare no conflict of interest.
This article is a PNAS Direct Submission.
This article contains supporting information online at www.pnas.org/lookup/suppl/doi:10.1073/pnas.1308718110/-/DCSupplemental.
References
- 1.Glimcher PW. Understanding risk: A guide for the perplexed. Cogn Affect Behav Neurosci. 2008;8(4):348–354. doi: 10.3758/CABN.8.4.348. [DOI] [PubMed] [Google Scholar]
- 2.Von Neumann J, Morgenstern O. Theory of Games and Economic Behavior. Princeton: Princeton Univ Press; 1944. [Google Scholar]
- 3.Samuelson PA. The problem of integrability in utility theory. Economica. 1950;17(68):355–385. [Google Scholar]
- 4.Houthakker HS. Revealed preference and the utility function. Economica. 1950;17(66):159–174. [Google Scholar]
- 5.Savage LJ. The Foundations of Statistics. New. York: Wiley; 1954. [Google Scholar]
- 6.Arrow KJ. Aspects of the Theory of Risk-Bearing. Helsinki: Yrjö Jahnssonin Säätiö; 1965. [Google Scholar]
- 7.Pratt JW. Risk aversion in the small and in the large. Econometrica. 1964;32(1/2):122–136. [Google Scholar]
- 8.Friend I, Blume M. The demand for risky assets. Am Econ Rev. 1975;65:900–922. [Google Scholar]
- 9.Stephens D, Krebs J. Foraging Theory. Princeton: Princeton Univ Press; 1986. [Google Scholar]
- 10.Weber EU, Shafir S, Blais AR. Predicting risk sensitivity in humans and lower animals: Risk as variance or coefficient of variation. Psychol Rev. 2004;111(2):430–445. doi: 10.1037/0033-295X.111.2.430. [DOI] [PubMed] [Google Scholar]
- 11.McCoy AN, Platt ML. Risk-sensitive neurons in macaque posterior cingulate cortex. Nat Neurosci. 2005;8(9):1220–1227. doi: 10.1038/nn1523. [DOI] [PubMed] [Google Scholar]
- 12.Rabin M. Risk aversion and expected utility theory: A calibration theorem. Econometrica. 2000;68:1281–1292. [Google Scholar]
- 13.Caraco T, Martindale S, Whitham TS. An empirical demonstration of risk-sensitive foraging preferences. Anim Behav. 1980;28:820–830. [Google Scholar]
- 14.Brito e Abreu F, Kacelnik A. Energy budgets and risk-sensitive foraging in starlings. Behav Ecol. 1999;8:338–345. [Google Scholar]
- 15.O’Neill M, Schultz W. Coding of reward risk by orbitofrontal neurons is mostly distinct from coding of reward value. Neuron. 2010;68(4):789–800. doi: 10.1016/j.neuron.2010.09.031. [DOI] [PubMed] [Google Scholar]
- 16.Yamada H, Louie K, Glimcher PW. Controlled water intake: A method for objectively evaluating thirst and hydration state in monkeys by the measurement of blood osmolality. J Neurosci Methods. 2010;191(1):83–89. doi: 10.1016/j.jneumeth.2010.06.011. [DOI] [PMC free article] [PubMed] [Google Scholar]
- 17.Holt C, Laury S. Risk aversion and incentive effects. Am Econ Rev. 2002;92:1644–1655. [Google Scholar]
- 18. Rothschild M, Stiglitz J (1970) Increasing risk I: A definition. J Econ Theory 2(3):225–243; reprinted in Rothschild M, Stiglitz J (1992) Foundations of Insurance Economics (Kluwer Academic Publishers, Dordrecht, The Netherlands)
- 19.Mas-Colell A, Whinston M, Green J. Microeconomic Theory. New York: Oxford Univ Press; 1995. [Google Scholar]
- 20.Tymula A, et al. Adolescents’ risk-taking behavior is driven by tolerance to ambiguity. Proc Natl Acad Sci USA. 2012;109(42):17135–17140. doi: 10.1073/pnas.1207144109. [DOI] [PMC free article] [PubMed] [Google Scholar]
- 21.Loomes G, Sugden R. Testing alternative stochastic specifications for risky choice. Economica. 1998;65:581–598. [Google Scholar]
- 22.Samuelson PA. A note on measurement of utility. Rev Econ Stud. 1937;4(22):155–161. [Google Scholar]
- 23.Arrow KJ. Essays in the Theory of Risk Bearing. Chicago: Markham; 1971. [Google Scholar]
- 24.Harrison GW, Rutstrom EE. Risk aversion in the laboratory. Res Exp Econ. 2008;12:41–196. [Google Scholar]
- 25.Wu G, Gonzalez R. Curvature of the probability weighting function. Manage Sci. 1996;42:1676–1690. [Google Scholar]
- 26.Levy DJ, Glimcher PW. Comparing apples and oranges: Using reward-specific and reward-general subjective value representation in the brain. J Neurosci. 2011;31(41):14693–14707. doi: 10.1523/JNEUROSCI.2218-11.2011. [DOI] [PMC free article] [PubMed] [Google Scholar]
- 27.Hayden BY, Platt ML. Gambling for Gatorade: Risk-sensitive decision making for fluid rewards in humans. Anim Cogn. 2009;12(1):201–207. doi: 10.1007/s10071-008-0186-8. [DOI] [PMC free article] [PubMed] [Google Scholar]
- 28.So NY, Stuphorn V. Supplementary eye field encodes option and action value for saccades with variable reward. J Neurophysiol. 2010;104(5):2634–2653. doi: 10.1152/jn.00430.2010. [DOI] [PMC free article] [PubMed] [Google Scholar]
- 29.Leventhal AM, Morrell RF, Morgan EF, Jr, Perkins CC., Jr The relation between mean reward and mean reinforcement. J Exp Psychol. 1959;57(5):284–287. doi: 10.1037/h0044878. [DOI] [PubMed] [Google Scholar]
- 30.Bateson M, Kacelnik A. Starlings’ preferences for predictable and unpredictable delays to food. Anim Behav. 1997;53(6):1129–1142. doi: 10.1006/anbe.1996.0388. [DOI] [PubMed] [Google Scholar]
- 31.Cohn R, Lewellen W, Lease R, Schlarbaum G. Individual investor risk aversion and investment portfolio composition. J Finance. 1975;30:605–620. [Google Scholar]
- 32.Heinemann F. Measuring risk aversion and the wealth effect. Res Exp Econ. 2008;12:293–313. [Google Scholar]
- 33.Guiso L, Paiella M. Risk aversion, wealth, and background risk. J Eur Econ Assoc. 2008;6:1109–1150. [Google Scholar]
- 34.Emmanuel J, et al. Endocrine Reviews. 2010. Gamble on a full stomach: Monetary risk-taking is altered by metabolic state in normal-weight human male subjects. Suppl 31(3):S1141 (abstr) [Google Scholar]
- 35.Symmonds M, Emmanuel JJ, Drew ME, Batterham RL, Dolan RJ. Metabolic state alters economic decision making under risk in humans. PLoS ONE. 2010;5(6):e11090. doi: 10.1371/journal.pone.0011090. [DOI] [PMC free article] [PubMed] [Google Scholar]
- 36.Levy DJ, Thavikulwat AC, Glimcher PW. State dependent valuation: The effect of deprivation on risk preferences. PLoS ONE. 2013;8(1):e53978. doi: 10.1371/journal.pone.0053978. [DOI] [PMC free article] [PubMed] [Google Scholar]
- 37.Tanaka T, Camerer CF, Nguyen Q. Poverty, politics, and preferences: Field experiments and survey data from Vietnam. Am Econ Rev. 2010;100:557–571. [Google Scholar]
- 38.Yesuf M, Bluffstone RA. Poverty, risk aversion, and path dependence in low-income countries: Experimental evidence from Ethiopia. Am J Agric Econ. 2009;91:1022–1037. [Google Scholar]
- 39.von Gaudecker H-M, van Soest A, Wengström E. Heterogeneity in risky choice behaviour in a broad population. Am Econ Rev. 2011;101:664–694. [Google Scholar]
- 40.Hsu M, Bhatt M, Adolphs R, Tranel D, Camerer CF. Neural systems responding to degrees of uncertainty in human decision-making. Science. 2005;310(5754):1680–1683. doi: 10.1126/science.1115327. [DOI] [PubMed] [Google Scholar]
- 41.Tom SM, Fox CR, Trepel C, Poldrack RA. The neural basis of loss aversion in decision-making under risk. Science. 2007;315(5811):515–518. doi: 10.1126/science.1134239. [DOI] [PubMed] [Google Scholar]
- 42.Hsu M, Krajbich I, Zhao C, Camerer CF. Neural response to reward anticipation under risk is nonlinear in probabilities. J Neurosci. 2009;29(7):2231–2237. doi: 10.1523/JNEUROSCI.5296-08.2009. [DOI] [PMC free article] [PubMed] [Google Scholar]
- 43.Levy I, Snell J, Nelson AJ, Rustichini A, Glimcher PW. Neural representation of subjective value under risk and ambiguity. J Neurophysiol. 2010;103(2):1036–1047. doi: 10.1152/jn.00853.2009. [DOI] [PubMed] [Google Scholar]
- 44.Bourque CW. Central mechanisms of osmosensation and systemic osmoregulation. Nat Rev Neurosci. 2008;9(7):519–531. doi: 10.1038/nrn2400. [DOI] [PubMed] [Google Scholar]
- 45.Simon SA, de Araujo IE, Gutierrez R, Nicolelis MA. The neural mechanisms of gustation: A distributed processing code. Nat Rev Neurosci. 2006;7(11):890–901. doi: 10.1038/nrn2006. [DOI] [PubMed] [Google Scholar]
- 46.Fuchs AF, Robinson DA. A method for measuring horizontal and vertical eye movement chronically in the monkey. J Appl Physiol. 1966;21(3):1068–1070. doi: 10.1152/jappl.1966.21.3.1068. [DOI] [PubMed] [Google Scholar]
- 47.Platt ML, Glimcher PW. Responses of intraparietal neurons to saccadic targets and visual distractors. J Neurophysiol. 1997;78(3):1574–1589. doi: 10.1152/jn.1997.78.3.1574. [DOI] [PubMed] [Google Scholar]
Associated Data
This section collects any data citations, data availability statements, or supplementary materials included in this article.