

Significance
Many populations are genetically diverse, and genomes of individuals can differ at millions of loci, some of which affect the fitness of the organism. Although recombination will separate distant loci rapidly, nearby loci are inherited together and stay linked for long times. Selected alleles at linked loci influence each other’s dynamics in complex ways that are poorly understood. We present an analysis of the coupled histories of linked loci subject to selection and recombination and make predictions for the resulting genetic diversity. We show that simple patterns emerge from the collective effect of many loci and that these patterns can be used to infer evolutionary parameters from sequence data.
Keywords: Hill–Robertson interference, genealogy, Bolthausen–Sznitman coalescent
Abstract
In sexual populations, selection operates neither on the whole genome, which is repeatedly taken apart and reassembled by recombination, nor on individual alleles that are tightly linked to the chromosomal neighborhood. The resulting interference between linked alleles reduces the efficiency of selection and distorts patterns of genetic diversity. Inference of evolutionary history from diversity shaped by linked selection requires an understanding of these patterns. Here, we present a simple but powerful scaling analysis identifying the unit of selection as the genomic “linkage block” with a characteristic length,  , determined in a self-consistent manner by the condition that the rate of recombination within the block is comparable to the fitness differences between different alleles of the block. We find that an asexual model with the strength of selection tuned to that of the linkage block provides an excellent description of genetic diversity and the site frequency spectra compared with computer simulations. This linkage block approximation is accurate for the entire spectrum of strength of selection and is particularly powerful in scenarios with many weakly selected loci. The latter limit allows us to characterize coalescence, genetic diversity, and the speed of adaptation in the infinitesimal model of quantitative genetics.
In asexual populations, different genomes compete for survival, and the fate of most new mutations depends more on the total fitness of the genome they reside in than on their own contribution to fitness. As a result, beneficial mutations on one genetic background can be lost to competition with other backgrounds, an effect known as “clonal interference” (1–3); likewise, deleterious mutations in very fit genomes can fix. This interference is reduced by recombination and disappears when recombination is rapid enough such that selection can act independently on different loci. Many eukaryotes recombine their genetic material by crossing-over of homologous chromosomes. As a result, distant loci evolve independently but nearby tightly linked loci remain coupled. Such interference, known as Hill–Robertson interference, reduces the efficacy of selection (4, 5) and reduces levels of neutral variation. Neutral diversity is indeed correlated with local recombination rates in several species, suggesting that linked selection is an important evolutionary force (6, 7). One typically distinguishes background selection against deleterious mutations (8, 9) from sweeping beneficial mutations, which lead to hitchhiking (10, 11). Both of these processes reduce diversity at linked loci and probably contribute to the observed correlation (12). Another piece of evidence for the importance of linked selection comes from the weak correlation between levels of genetic diversity and the population size (13). Whereas classic neutral models predict that diversity should increase linearly with the population size (14), in models dominated by selection, the diversity depends only weakly on the population size (3). Hence, linked selection could explain this “paradox of variation” (15).
From the perspective of a neutral allele, any random association with genetic backgrounds of different fitness results in fluctuations of its allele frequency. To distinguish this source of stochasticity from genetic drift, Gillespie (11) coined the term “genetic draft.” Whereas genetic draft is understood well when caused by strongly selected mutations whose dynamics are deterministic at high frequencies (5, 16, 17), the cumulative effect of many weak effect mutations has mainly been addressed using simulations (18, 19). Many populations harbor substantial heritable phenotypic variation, which, in an unknown way, depends on a large number of polymorphisms in the genome. The majority of these polymorphisms are likely to have small effects on phenotypes and fitness. Collectively, they can still dominate phenotypic variation (20) and possibly fitness variation. This limit is known as the infinitesimal model in quantitative genetics. Quantitative genetics, however, typically ignores linkage between loci and the maintenance of genetic diversity (21, 22).
Here, we characterize the structure of genealogies, genetic diversity, and the rate of adaptation in sexual populations in the limit of numerous weakly selected alleles. We build on recent progress in our understanding of genealogies in adapting asexual populations (23–25), and we will first review these results briefly. We will then present a scaling argument that reduces the problem of coalescence within a sexually reproducing population to an asexual population with suitably scaled parameters. This correspondence allows us to predict levels of genetic diversity, coalescence time scales, and site frequency spectra. Our results hold regardless of whether the polymorphisms originated as weakly deleterious or beneficial mutations, and thus cover weak effect background selection as well as adaptation. We confirm the validity of the mapping to the asexual model by comparing its predictions with numerical simulations of evolving sexual populations. We use this approximation to demonstrate that in the limit of numerous weakly selected mutations, the rate of adaptation scales as the square root of recombination rate.
Results
In asexual populations, all loci share the same genealogical history and the fate of a lineage depends on the fitness of the entire genome. If fitness depends on a large number of polymorphic loci with comparable effects, the fitness distribution in the population will be roughly Gaussian and the fittest individuals are  ahead of the fitness mean, where
  is the total fitness variance in the population (2, 26, 27). In large asexual populations, only individuals in the high fitness nose have an appreciable chance to contribute to future generations. It will take those individuals roughly
  generations to dominate the population. Hence, the probability that two randomly chosen individuals had a common ancestor
  generations ago is of order 1 (i.e., their ancestral lineages have likely coalesced). A more thorough analysis of coalescence in adapting asexual populations can be found in studies by Neher and Hallatschek (23) and by Desai et al. (24). In small populations with
  , coalescence is dominated by neutral processes (nonheritable fluctuations in offspring number known as genetic drift). The average number of generations back to the most recent common ancestor of any pair of extant genomes, also known as the pair coalescence time, is given by:
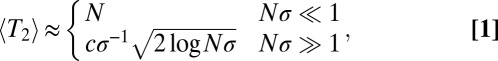 |
where c is a constant of order 1 that captures deviations from Gaussianity that depend on details of the model. For the infinitesimal model studied here,  (23).
(23).
In an attempt to extend applicability of the neutral coalescent, one sometimes defines an effective population size,  , equal to
  regardless of whether coalescence is neutral or not (28). By definition, a neutral model with
  predicts the same levels of genetic diversity, but the statistical properties of the genealogies dominated by selection are quite different and cannot be papered over simply by redefining the population size. We will therefore avoid the term
  and stick to
  . For the approximately neutral case,
  , the coalescent tree is of the Kingman type (14). As
  increases, coalescence is more and more driven by the amplification of fit genomes, which generates a very skewed offspring number distribution over time scales of order
  . As a result, the genealogies resemble the Bolthausen–Sznitman coalescent (BSC) (25, 29) with very different statistical properties. Two representative coalescent trees sampled from asexual populations, one neutral and one rapidly adapting, are shown in Fig. 1A.
Fig. 1.

Coalescence in neutral and adapting populations. (A) Typical coalescent tree from neutral (Left) and adapting (Right) asexual populations. In adapting populations, coalescent trees branch asymmetrically and contain approximate multiple mergers. (B) Illustration of asexual blocks in sexual populations. The sketch depicts a representative chromosome at the bottom with polymorphisms indicated as balls. Different loci within segments shorter than  share most of their genealogical history, (i.e., have trees similar to the one indicated in the center of the segment where TMRCA is the time to the most recent common ancestor). Coalescence within this segment of length
  is either neutral or driven by the fitness differences between different haplotypes spanning these segments. (Inset) Fitness distribution of these haplotype blocks is indicated. Distant parts of the chromosome are in linkage equilibrium, and the tree changes as one moves along the chromosome. The succession of changing trees is the ancestral recombination graph.
Sexual Populations and Recombination.
In contrast to asexual evolution, recombination decouples different loci in sexual populations: the further apart, the more rapidly. The typical length of the segment that is not disrupted decreases with time as
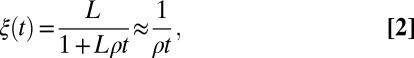 |
where ρ is the cross-over rate and L is the length of the chromosome. The second approximation is justified whenever  . If polymorphisms affecting fitness are spread evenly across the genome and are dense (the infinitesimal model), we expect that different segregating haplotypes in a region of length
  harbor fitness variation proportional to the segment length
 |
This fitness variance shrinks with time as the block length decreases. Although initial fitness differences between blocks are large, they are chopped into smaller blocks so rapidly that selection has no time to amplify the fittest of these early large blocks. However, the rate at which blocks are chopped up decreases as they get shorter, and, at some point, the rate of chopping them up is outweighed by the amplification of the fittest blocks by selection. The latter happens when fitness differences between haplotypes of this block are comparable to the recombination rate. More precisely, the relevant block length is the length that survives over the time scale of coalescence  . In large enough populations, the time scale of coalescence itself is determined by these fitness differences via Eq. 1. In contrast to asexual populations, only the fitness variance,
  , within the linkage block of length
  is relevant, rather than the total variance
  (Fig. 1B). Using
  in Eq. 2, we find
 |
Linkage disequilibrium (LD) should decay over this length scale. Substituting  into Eq. 3 yields
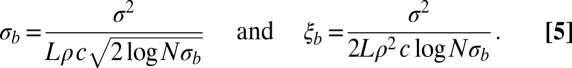 |
Hence, the time scales of coalescence and neutral diversity are given by the inverse of the fitness variance per map length  with a logarithmic correction (see also refs. 9, 30 for the case of strongly selected mutations). To arrive at this result, we have assumed that
  . If this condition is not satisfied, local coalescence will be approximately neutral. In this case,
  and the LD extends over
 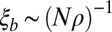 nucleotides. Empirically, we observe a smooth and rapid cross-over between these two regimes (below and Fig. 2). The condition for draft dominance,
  , is more stringent in sexual populations than in asexual populations, in which it is
  . In other words, recombination reduces interference and results in drift-dominated coalescence over a larger parameter range.
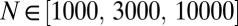
Fig. 2.

Coalescence in sexual populations. The figure shows the average pair coalescence time  relative to the neutral expectation as a function of
  determined using Eq. 5. For
 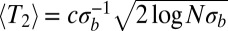 ,
,  , whereas
  otherwise.
We predict now that the results for genetic diversity in the asexual coalescent apply with  as the local fitness variance and that linkage disequilibrium between common loci extends over a distance
  . We will validate these predictions by forward simulations of different population models.
Constant Selection in the Infinitesimal Model.
We first consider a model of a population whose fitness variance is set by external (environmental) factors in which the selected trait depends on many weak effect polymorphisms and de novo mutations (Materials and Methods). This model might be a first approximation to scenarios where selection pressures are dictated by a changing environment, an evolving immune system, or a breeder who imposes a constant artificial selection. We simulate our population using a discrete generation model with an approximately constant population size and a finite number of sites in the genome as implemented in FFPopSim (31) (Materials and Methods). We track the genealogy of a locus in the center of the chromosome, which allows us to study properties of representative coalescent trees.
After allowing the population to equilibrate, we sample the evolving population in roughly  intervals and measure
  , the site frequency spectrum (SFS), and the LD between polymorphisms at intermediate frequencies
  . We perform these simulations for many combinations of parameters. For each combination, we calculate
  according to Eq. 5. Fig. 2 shows that the average pair coalescence time
  approaches N for
  and that it is proportional to
  (with logarithmic corrections) for
  as predicted.
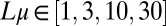
In addition to a reduction in genetic diversity, we predict that the local genealogies will resemble samples from the BSC rather than the Kingman coalescent whenever  . Fig. 3 shows a collection of SFSs colored by the
  . With increasing
  , the SFS smoothly interpolates between the expectations for the Kingman coalescent and the BSC. As soon as the SFS starts deviating from the prediction of the Kingman coalescent, Tajima’s D turns negative. For large
  , we find a nonmonotonic SFS with a steep divergence
  characteristic of the BSC.
Fig. 3.

SFSs, normalized by  , for a large number of parameter combinations. Color indicates the value of
  . For large
  , the SFSs display the nonmonotonicity characteristic of the BSC (dashed line), whereas the SFSs are described well by the prediction from Kingman’s coalescent (solid line) if
  . The BSC curve serves as a guide to the eye because its normalization depends on
  .
.
Another important feature of diversity in sexual populations is the genomic distance across which loci share much of their genealogy. This can be quantified by measuring the correlations between loci (LD) at different distances. In order for our picture to be consistent, the extent of LD should be approximately equal to  . We measured LD as
  for different distances d and plot it against
  (Fig. 4). As predicted, LD decays over the length
 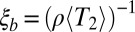 .
.
Fig. 4.

Correlation length along the genome. The figure shows LD, quantified as average  , between pairs of loci at different distances (the curves are normalized to their value at zero distance). The x axis shows the distance between loci d rescaled by
  determined using Eq. 2, with t equal to the measured pair coalescence time. After this rescaling, the distance dependence of all simulations follows approximately the same master curve, which shows that LD extends for
  .
.
Frequent Small Effect Mutations.
In the model studied above, fitness variance was set by external factors. We now consider a model where the fitness variance and diversity are set by a balance between frequent novel mutations of small effect and the removal of variation by selection (i.e., fixation or loss of alleles). This type of model has been studied for asexual populations (26, 32). Using these results, we expect that the fitness variance within a block of length  is given by
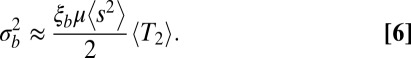 |
Here, μ is the mutation rate and  is the second moment of the distribution of mutational effects. Note than in this infinitesimal limit, it is irrelevant whether mutations are deleterious or beneficial; only the second moment of the fitness effect distribution is important. The quantity
  is the “diffusion” constant of haplotype fitness in the absence of selection. Eq. 6 implies that fitness variation accumulates over the time it takes a few lineages to dominate the population, which is approximately given by half the pair coalescence time (23). Substituting Eq. 2 with
  into Eq. 6, we find
 |
Remarkably, the fitness variance of the effectively asexual blocks is simply the ratio of the variance injection per nucleotide,  , and the cross-over rate (at least when
  ). The coalescence time cancels. We therefore find for
 |
where c is again a constant of order 1. In the limit where coalescence is driven by selection, the total rate of adaptation is
These results apply to steadily adapting populations (i.e., scenarios where beneficial mutations dominate), populations suffering from a mutational meltdown, or populations where the two processes balance. We simulate the lattermost using a model with recurrent mutations such that the population settles into a dynamic equilibrium where the fixation of beneficial mutations is roughly canceled out by that of deleterious mutations (33). The predictions for neutral diversity, LD, and the SFS match the simulation results very well. Fig. S1 shows plots analogous to Figs. 2–4. The prediction for the total fitness variance, Eq. 9, is compared with the simulation results in Fig. 5. We investigated additional models to demonstrate the robustness of the conclusions regarding model assumptions and simulation method. Fig. S2 shows neutral diversity, LD, and SFS for a model in which unique beneficial mutations are injected at sites that become monomorphic. Fig. S3 shows results for a bona fide infinite sites model of chromosomes that accumulate beneficial or deleterious mutations. In all these cases, the observed diversity agrees well with Eq. 8 and the SFS shows the expected cross-over from the Kingman to the BSC predictions as  increases.
Fig. 5.

Total fitness variation due to frequent weak effect mutations in a model where deleterious and beneficial mutations balance each other. The color shows the average number of cross-overs per simulated segment. There is a residual dependence on ρ due to large corrections to the asymptotic behavior.
Loosely Linked Loci.
Our analysis has focused on the effect of fitness variation in short effectively asexual blocks. As discussed above, the total strength of selection σ can be much larger than the fitness differences within effectively asexual blocks  . However, a particular locus only remains linked to distant polymorphisms for a short time, and the contribution of these distant loci averages out. For our focus on the effect of tightly linked loci to be valid, the integral contribution of such loosely linked loci to drift and draft should be small compared with the effect of fitness variation
  within the segment. Loosely linked loci are amenable to a perturbative analysis known as quasilinkage equilibrium (34, 35). In the study by Neher and Shraiman (35), it is shown that the stochastic dynamics of the allele frequency
  at locus i due to loosely linked loci is described by the following Langevin equation:
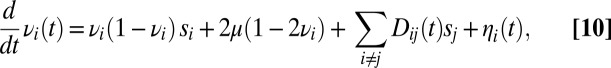 |
where  is the LD between loci i and j,
  is the fitness effect of the derived allele at locus j, and
  is random noise with autocorrelation function
 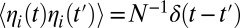 , representing genetic drift. If the two loci are loosely linked (i.e., the cross-over rate
  between them is much larger than the effect of selection on either of them),
  is also a fluctuating quantity. The autocorrelation function of
  is (35)
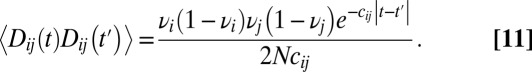 |
Given this autocorrelation, we can now integrate over fluctuations due to genetic drift and loosely linked selected loci to obtain a renormalized diffusion coefficient (a reduced  ). Reproducing equation 44 of ref. 35, we have
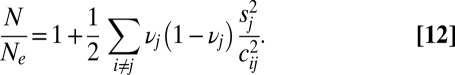 |
This result is similar to results in other studies (9, 30, 36) in that it shows that the level of drift is increased by a factor that depends on the square of the ratio of selection and linkage, averaged over the genome.
If we now consider the integral effect of all loci further away than ξ, it is always dominated by the closest loci, so that 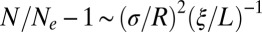 (obtained as a continuum approximation to the sum in Eq. 12,
  ). Hence, provided that
 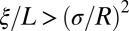 , a condition that obtains when fitness variation at distant loci is sufficiently small or the loci are sufficiently distant, their effect can be accounted for by a simple rescaling of the effective population size (17); this is the “weak draft” regime. Note, however, that the recombination rate between distant loci is ultimately limited by the outcrossing rate and that distant loci can have substantial effects in facultatively sexual populations (17, 37).
The negligible effect of loosely linked loci is a consequence of two types of averaging that are apparent in Eq. 11. First, the associations between these distant loci are transient and average out over time. This manifests itself in the decay time of  in Eq. 11. Second, different individuals carry different alleles at these distant loci; hence, their fitness effect is averaged over different descendents. As a consequence, the autocorrelation in Eq. 11 is proportional to
  . Together, these two averages result in the
  contribution of loosely linked loci.
For the more tightly linked loci (i.e., 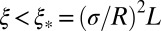 ), the behavior crosses over to the “strong draft” regime. This cross-over length scale
  is controlled entirely by the “local” quantities: the recombination rate per base pair ρ and the local fitness variance density. Furthermore,
  is generally larger than
  , with
 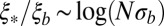 . This ratio corresponds to the reduction in the block size during the span of time between local selection effects first coming into play and the coalescence time. In the limit of
  , recombination events within the
  block must be reckoned with, but for more realistic population sizes, we have shown above that focusing on the
  -sized asexual segment captures the effects of strong draft quite well.
Length Distribution of Segments Identical by Descent.
The structure of genealogies has implications for the length  of segments identical by descent (IBD) in pairs of individuals. Their distribution,
  , is directly related to the distribution of pair coalescence times,
  , via the relation
  . In neutrally evolving populations of constant size, pair coalescence times are exponentially distributed with mean
  . Consequently, the length of IBD segments is distributed as
  and has a long, slowly decaying tail. If
  , coalescence is accelerated on average but predominantly happens after lineages have reached the upper tail of the fitness distribution of different alleles of a linkage block. Hence, the distribution of pair coalescence times is peaked at
  rather than being exponential (compare with figure 3 of ref. 23). This shift in the distribution of
  with relatively rare very recent coalescence has the consequence that
  is approximately exponential. Long IBD segments are therefore much less likely than in the neutral case with the same
  .
.
Discussion
In most sexual populations, the histories of different chromosomes or loci far apart on a chromosome are weakly correlated. Nearby loci, however, are more tightly linked, which results in correlated histories and LD. Because the density of heterozygous sites is  and the length scale of LD is
  , the typical number of SNPs in one linkage block is
  . If n is much larger than 1, and a sizeable fraction of those SNPs affect fitness, different haplotypes segregating within such a block will display a broad distribution in local fitness with a variance that we have denoted by
  . Neutral alleles linked to haplotypes drawn from this distribution will be affected by linked selection. This, in turn, results in genealogies different from standard neutral models but similar to the BSC characteristic of rapidly adapting asexual populations (23, 38).
In regions of high recombination in obligately outcrossing species, the number of polymorphisms per linkage block, n, is of order 1 and linked selection will mainly result from the occasional strong selective sweep (39). However, recombination rates vary by orders of magnitude across the genome (40), and  in low recombination regions. In those regions, the cumulative effect of many weakly selected polymorphisms is expected to be important. This holds in particular for species that outcross rarely, such as many plants, nematodes, yeasts, and viruses (41–44). This type of linked selection will overwhelm genetic drift if
  . The fitness variance per block is given by
  , where
  is the second moment of the effect distribution of polymorphisms. Hence, we require
  . Provided n is large enough, even nominally neutral
  polymorphisms collectively dominate the dynamics of haplotypes of length
  . In this infinitesimal limit, the nature of linked selection is irrelevant and our results apply to any mix of deleterious and beneficial mutations as long as the effects of individual mutations are weak and their number is large.
Relation to Previous Work.
Most previous work on genetic draft and selective interference considered mutations with strong effects that behave deterministically at high frequencies, whereas we focus on weak effect mutations. Reduction of genetic diversity by sweeping beneficial mutations was first discussed by Maynard Smith (10) (also refs. 11, 45–47). In these models, genetic diversity is determined by the typical waiting time between two successive selective sweeps close enough to affect a given locus. Similarly, deleterious mutations reduce diversity at linked sites. Assuming that mutations have a large detrimental effect on fitness and happen with rate μ per site, it was shown (9, 36) that the reduction of genetic diversity is a function of  . As in our analysis here, the strongest effect on genetic diversity comes from tightly linked loci. Our analysis of loosely linked loci is similar to the work by Santiago and Caballero (30). The latter, however, breaks down at tight linkage, and the cross-over to the asexual behavior is essential for a consistent description in the limit of many weakly selected loci. This limit has mainly been studied using computer simulations (18, 19, 48), and few analytical results are available.
Weissman and Barton (17) investigated the rate of adaptation and its effect on diversity using scaling arguments similar to the one presented here. In their model, adaptation is driven by individual selective sweeps. The duration of a sweep explicitly sets the time scale  on which coalescence happens. In this model, the speed of adaptation is proportional to the map length. In contrast, our model assumes many weak effect mutations, and the time scale of coalescence is set by
  , which is self-consistently determined and itself depends on model parameters, such as ρ and
  . We can recover their result for the rate of adaptation by setting
  and
and  . With these assumptions, we obtain
  instead of Eq. 9. The model used by Weissman and Barton (17) applies to a limit where, at most, one strongly selected and sweeping mutation falls into one linkage block. The basic properties of genealogies and SFSs are expected to be qualitatively similar in the limit of one sweep per block. If the contribution from weak mutations is negligible while sweeps are common, the coalescence properties will be dominated by sweeps at different distances. This limit has been studied by Durrett and Schweinsberg (49) and also results in a multiple merger coalescent.
Other types of models are appropriate if the rate of outcrossing is small compared with the SD in fitness (37, 38, 50) or if recombination proceeds via horizontal transfer of short pieces of DNA (37, 51). In these cases, one finds a very strong dependence of the rate of adaptation on the rate of outcrossing or horizontal transfer. Rare recombination has the potential to increase fitness variance dramatically because many loci are in strong LD.
In summary, we have characterized the effect of dense, weakly selected polymorphisms on genetic diversity, which might be the source of much of the phenotypic variability we observe (20, 22). Our analysis provides a consistent genealogical framework for the infinitesimal model of quantitative genetics. This limit of weakly selected mutations has so far eluded analytical understanding. We derived equations that relate the mutational input and the rate of recombination to neutral diversity and the site frequency spectra. Because genetic diversity (neutral or not) is directly accessible in population resequencing experiments, our results should be of practical relevance when interpreting such data. Furthermore, one is often interested in identifying particular mutations that arose in response to specific environmental challenges. If successful, those mutations tend to be of large effect and fall outside the scope of our model. Importantly, strong adaptations only perturb a fraction of the genome [more precisely, a segment of length  , where s is the selection coefficient]. Our model provides the background on top of which such singular adaptations can be sought, and understanding the statistical patterns of diversity and linkage within this null model is essential for reliable inference.
Materials and Methods
We use a model with discrete generations, haploid individuals, an approximately constant population size, and a finite number of sites in the genome, as implemented in FFPopSim (31). We simulate a fraction of a chromosome of length L, with per site cross-over rate ρ. If  , no recombination happens in most cases. In addition to forward simulation, we track the genealogy of a central locus, which allows us to measure pair coalescence times, the
  , and the neutral SFS directly (this functionality is implemented in a more recent release of FFPopSim; http://code.google.com/p/ffpopsim). For all parameters, we produce equilibrated populations by simulating for 10
  . Subsequent measurements of population parameters start from these equilibrated populations and sample the population roughly twice every
  , as estimated from our theoretical arguments. All scripts associated with this paper can be obtained from http://git.tuebingen.mpg.de/reccoal.
Constant Selection.
To maintain a constant fitness variance  , we rescale the selection coefficients associated with individual loci of each generation accordingly. Mutations are introduced into a random individual whenever a locus becomes monomorphic [i.e., the previously introduced mutation is lost or has fixed (38)]. This allows us to simulate a large number of sites efficiently in a limit where the overall mutation rate is small compared with
  . In this way, we keep all L loci polymorphic without using a high mutation rate, which would result in frequent recurrent mutations. We simulate a grid of parameters with N taking the values
  σ taking the values
  , and
, and  taking five logarithmically spaced values between
  and
and  . For the analysis, simulations were filtered so that
  and
and  . To prevent invalid logarithms,
  was replaced by
  in Eq. 5.
Dynamic Balance.
In this set of simulations, we simulate a genome consisting of finite sites in a constant fitness landscape where mutations at each locus have a small effect s. Mutations are injected at random with rate μ at each locus. In contrast to the models above, where mutations are injected only when a locus is monomorphic, we allow recurrent and back mutation to make the dynamic balance state possible. The grid of parameters used was 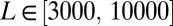 ,
,  ,
,  ,
,  , and
, and  logarithmically spaced between s and 1.0. For the analysis, simulations were filtered such that
  ,
,  , and
, and 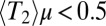 .
.
Supplementary Material
Acknowledgments
We thank Fabio Zanini for stimulating discussions and help with FFPopSim and Guy Sella for very useful comments on the manuscript. This work is supported by European Research Council Starting Grant HIVEVO 260686 (to R.A.N.) and, in part, by National Science Foundation Grant PHY11-25915 (to Kavli Institute for Theoretical Physics). B.I.S. acknowledges support from National Institutes of Health Grant R01 GM086793.
Footnotes
The authors declare no conflict of interest.
*This Direct Submission article had a prearranged editor.
This article contains supporting information online at www.pnas.org/lookup/suppl/doi:10.1073/pnas.1309697110/-/DCSupplemental.
References
- 1.Gerrish PJ, Lenski RE. The fate of competing beneficial mutations in an asexual population. Genetica. 1998;102-103(1-6):127–144. [PubMed] [Google Scholar]
- 2.Desai MM, Fisher DS. Beneficial mutation selection balance and the effect of linkage on positive selection. Genetics. 2007;176(3):1759–1798. doi: 10.1534/genetics.106.067678. [DOI] [PMC free article] [PubMed] [Google Scholar]
- 3.Neher RA. Genetic draft, selective interference, and population genetics of rapid adaptation. Annu Rev Ecol Evol Syst. 2013:44. in press. [Google Scholar]
- 4.Hill WG, Robertson A. The effect of linkage on limits to artificial selection. Genet Res. 1966;8(3):269–294. [PubMed] [Google Scholar]
- 5.Barton NH. Linkage and the limits to natural selection. Genetics. 1995;140(2):821–841. doi: 10.1093/genetics/140.2.821. [DOI] [PMC free article] [PubMed] [Google Scholar]
- 6.Begun DJ, Aquadro CF. Levels of naturally occurring DNA polymorphism correlate with recombination rates in D. melanogaster. Nature. 1992;356(6369):519–520. doi: 10.1038/356519a0. [DOI] [PubMed] [Google Scholar]
- 7.Cutter AD. Nucleotide polymorphism and linkage disequilibrium in wild populations of the partial selfer Caenorhabditis elegans. Genetics. 2006;172(1):171–184. doi: 10.1534/genetics.105.048207. [DOI] [PMC free article] [PubMed] [Google Scholar]
- 8.Charlesworth B, Morgan MT, Charlesworth D. The effect of deleterious mutations on neutral molecular variation. Genetics. 1993;134(4):1289–1303. doi: 10.1093/genetics/134.4.1289. [DOI] [PMC free article] [PubMed] [Google Scholar]
- 9.Hudson RR, Kaplan NL. Deleterious background selection with recombination. Genetics. 1995;141(4):1605–1617. doi: 10.1093/genetics/141.4.1605. [DOI] [PMC free article] [PubMed] [Google Scholar]
- 10.Maynard Smith J, Haigh J. The hitch-hiking effect of a favourable gene. Genet Res. 1974;23(1):23–35. [PubMed] [Google Scholar]
- 11.Gillespie JH. Genetic drift in an infinite population. The pseudohitchhiking model. Genetics. 2000;155(2):909–919. doi: 10.1093/genetics/155.2.909. [DOI] [PMC free article] [PubMed] [Google Scholar]
- 12.Hudson RR. How can the low levels of DNA sequence variation in regions of the drosophila genome with low recombination rates be explained? Proc Natl Acad Sci USA. 1994;91(15):6815–6818. doi: 10.1073/pnas.91.15.6815. [DOI] [PMC free article] [PubMed] [Google Scholar]
- 13.Leffler EM, et al. Revisiting an old riddle: What determines genetic diversity levels within species? PLoS Biol. 2012;10(9):e1001388. doi: 10.1371/journal.pbio.1001388. [DOI] [PMC free article] [PubMed] [Google Scholar]
- 14.Kingman J. On the genealogy of large populations. J Appl Probab. 1982;19A:27–43. [Google Scholar]
- 15.Lewontin RC. The Genetic Basis of Evolutionary Change. New York: Columbia Univ Press; 1974. [Google Scholar]
- 16.Walczak AM, Nicolaisen LE, Plotkin JB, Desai MM. The structure of genealogies in the presence of purifying selection: A fitness-class coalescent. Genetics. 2012;190(2):753–779. doi: 10.1534/genetics.111.134544. [DOI] [PMC free article] [PubMed] [Google Scholar]
- 17.Weissman DB, Barton NH. Limits to the rate of adaptive substitution in sexual populations. PLoS Genet. 2012;8(6):e1002740. doi: 10.1371/journal.pgen.1002740. [DOI] [PMC free article] [PubMed] [Google Scholar]
- 18.McVean GA, Charlesworth B. The effects of Hill-Robertson interference between weakly selected mutations on patterns of molecular evolution and variation. Genetics. 2000;155(2):929–944. doi: 10.1093/genetics/155.2.929. [DOI] [PMC free article] [PubMed] [Google Scholar]
- 19.Gordo I, Navarro A, Charlesworth B. Muller’s ratchet and the pattern of variation at a neutral locus. Genetics. 2002;161(2):835–848. doi: 10.1093/genetics/161.2.835. [DOI] [PMC free article] [PubMed] [Google Scholar]
- 20.Yang J, et al. Common SNPs explain a large proportion of the heritability for human height. Nat Genet. 2010;42(7):565–569. doi: 10.1038/ng.608. [DOI] [PMC free article] [PubMed] [Google Scholar]
- 21.Bulmer MG. The Mathematical Theory of Quantitative Genetics. Oxford: Oxford Univ Press; 1980. [Google Scholar]
- 22.Lynch M, Walsh B. Genetics and Analysis of Quantitative Traits. Sunderland, MA: Sinauer; 1998. [Google Scholar]
- 23.Neher RA, Hallatschek O. Genealogies of rapidly adapting populations. Proc Natl Acad Sci USA. 2013;110(2):437–442. doi: 10.1073/pnas.1213113110. [DOI] [PMC free article] [PubMed] [Google Scholar]
- 24.Desai MM, Walczak AM, Fisher DS. Genetic diversity and the structure of genealogies in rapidly adapting populations. Genetics. 2013;193(2):565–585. doi: 10.1534/genetics.112.147157. [DOI] [PMC free article] [PubMed] [Google Scholar]
- 25.Brunet E, Derrida B, Mueller AH, Munier S. Effect of selection on ancestry: An exactly soluble case and its phenomenological generalization. Phys Rev E Stat Nonlin Soft Matter Phys. 2007;76(4 Pt 1):041104. doi: 10.1103/PhysRevE.76.041104. [DOI] [PubMed] [Google Scholar]
- 26.Tsimring LS, Levine H, Kessler DA. RNA virus evolution via a fitness-space model. Phys Rev Lett. 1996;76(23):4440–4443. doi: 10.1103/PhysRevLett.76.4440. [DOI] [PubMed] [Google Scholar]
- 27.Rouzine IM, Wakeley J, Coffin JM. The solitary wave of asexual evolution. Proc Natl Acad Sci USA. 2003;100(2):587–592. doi: 10.1073/pnas.242719299. [DOI] [PMC free article] [PubMed] [Google Scholar]
- 28.Charlesworth B. Fundamental concepts in genetics: Effective population size and patterns of molecular evolution and variation. Nat Rev Genet. 2009;10(3):195–205. doi: 10.1038/nrg2526. [DOI] [PubMed] [Google Scholar]
- 29.Bolthausen E, Sznitman A-S. On Ruelle’s probability cascades and an abstract cavity method. Communications in Mathematical Physics. 1998;197:247–276. [Google Scholar]
- 30.Santiago E, Caballero A. Effective size and polymorphism of linked neutral loci in populations under directional selection. Genetics. 1998;149(4):2105–2117. doi: 10.1093/genetics/149.4.2105. [DOI] [PMC free article] [PubMed] [Google Scholar]
- 31.Zanini F, Neher RA. FFPopSim: An efficient forward simulation package for the evolution of large populations. Bioinformatics. 2012;28(24):3332–3333. doi: 10.1093/bioinformatics/bts633. [DOI] [PMC free article] [PubMed] [Google Scholar]
- 32.Cohen E, Kessler DA, Levine H. Front propagation up a reaction rate gradient. Phys Rev E Stat Nonlin Soft Matter Phys. 2005;72(6 Pt 2):066126. doi: 10.1103/PhysRevE.72.066126. [DOI] [PubMed] [Google Scholar]
- 33.Goyal S, et al. Dynamic mutation-selection balance as an evolutionary attractor. Genetics. 2012;191(4):1309–1319. doi: 10.1534/genetics.112.141291. [DOI] [PMC free article] [PubMed] [Google Scholar]
- 34.Kimura M. Attainment of quasi linkage equilibrium when gene frequencies are changing by natural selection. Genetics. 1965;52(5):875–890. doi: 10.1093/genetics/52.5.875. [DOI] [PMC free article] [PubMed] [Google Scholar]
- 35.Neher R, Shraiman B. Statistical genetics and evolution of quantitative traits. Rev Mod Phys. 2011;83:1283–1300. [Google Scholar]
- 36.Nordborg M, Charlesworth B, Charlesworth D. The effect of recombination on background selection. Genet Res. 1996;67(2):159–174. doi: 10.1017/s0016672300033619. [DOI] [PubMed] [Google Scholar]
- 37.Neher RA, Shraiman BI, Fisher DS. Rate of adaptation in large sexual populations. Genetics. 2010;184(2):467–481. doi: 10.1534/genetics.109.109009. [DOI] [PMC free article] [PubMed] [Google Scholar]
- 38.Neher RA, Shraiman BI. Genetic draft and quasi-neutrality in large facultatively sexual populations. Genetics. 2011;188(4):975–996. doi: 10.1534/genetics.111.128876. [DOI] [PMC free article] [PubMed] [Google Scholar]
- 39.Sella G, Petrov DA, Przeworski M, Andolfatto P. Pervasive natural selection in the Drosophila genome? PLoS Genet. 2009;5(6):e1000495. doi: 10.1371/journal.pgen.1000495. [DOI] [PMC free article] [PubMed] [Google Scholar]
- 40.Comeron JM, Ratnappan R, Bailin S. The many landscapes of recombination in Drosophila melanogaster. PLoS Genet. 2012;8(10):e1002905. doi: 10.1371/journal.pgen.1002905. [DOI] [PMC free article] [PubMed] [Google Scholar]
- 41.Bomblies K, et al. Local-scale patterns of genetic variability, outcrossing, and spatial structure in natural stands of Arabidopsis thaliana. PLoS Genet. 2010;6(3):e1000890. doi: 10.1371/journal.pgen.1000890. [DOI] [PMC free article] [PubMed] [Google Scholar]
- 42.Barrière A, Félix M-A. High local genetic diversity and low outcrossing rate in Caenorhabditis elegans natural populations. Curr Biol. 2005;15(13):1176–1184. doi: 10.1016/j.cub.2005.06.022. [DOI] [PubMed] [Google Scholar]
- 43.Neher RA, Leitner T. Recombination rate and selection strength in HIV intra-patient evolution. PLoS Comput Biol. 2010;6(1):e1000660. doi: 10.1371/journal.pcbi.1000660. [DOI] [PMC free article] [PubMed] [Google Scholar]
- 44.Tsai IJ, Bensasson D, Burt A, Koufopanou V. Population genomics of the wild yeast Saccharomyces paradoxus: Quantifying the life cycle. Proc Natl Acad Sci USA. 2008;105(12):4957–4962. doi: 10.1073/pnas.0707314105. [DOI] [PMC free article] [PubMed] [Google Scholar]
- 45.Braverman JM, Hudson RR, Kaplan NL, Langley CH, Stephan W. The hitchhiking effect on the site frequency spectrum of DNA polymorphisms. Genetics. 1995;140(2):783–796. doi: 10.1093/genetics/140.2.783. [DOI] [PMC free article] [PubMed] [Google Scholar]
- 46.Barton N. The effect of hitch-hiking on neutral genealogies. Genet Res. 1998;72:123–133. [Google Scholar]
- 47.Kaplan NL, Hudson RR, Langley CH. The “hitchhiking effect” revisited. Genetics. 1989;123(4):887–899. doi: 10.1093/genetics/123.4.887. [DOI] [PMC free article] [PubMed] [Google Scholar]
- 48.Messer PW, Petrov DA. Frequent adaptation and the McDonald-Kreitman test. Proc Natl Acad Sci USA. 2013;110(21):8615–8620. doi: 10.1073/pnas.1220835110. [DOI] [PMC free article] [PubMed] [Google Scholar]
- 49.Durrett R, Schweinsberg J. A coalescent model for the effect of advantageous mutations on the genealogy of a population. Stochastic processes and their applications. 2005;115:1628–1657. [Google Scholar]
- 50.Rouzine IM, Coffin JM. Evolution of human immunodeficiency virus under selection and weak recombination. Genetics. 2005;170(1):7–18. doi: 10.1534/genetics.104.029926. [DOI] [PMC free article] [PubMed] [Google Scholar]
- 51.Cohen E, Kessler DA, Levine H. Recombination dramatically speeds up evolution of finite populations. Phys Rev Lett. 2005;94(9):098102. doi: 10.1103/PhysRevLett.94.098102. [DOI] [PubMed] [Google Scholar]
Associated Data
This section collects any data citations, data availability statements, or supplementary materials included in this article.