

Abstract
The regulation of gene expression in cells, including by microRNAs (miRNAs), is a dynamic process. Current methods for identifying miRNA targets by combining sequence and miRNA and mRNA expression data do not adequately use the temporal information and thus miss important miRNAs and their targets. We developed the MIRna Dynamic Regulatory Events Miner (mirDREM), a probabilistic modeling method that uses input–output hidden Markov models to reconstruct dynamic regulatory networks that explain how temporal gene expression is jointly regulated by miRNAs and transcription factors. We measured miRNA and mRNA expression for postnatal lung development in mice and used mirDREM to study the regulation of this process. The reconstructed dynamic network correctly identified known miRNAs and transcription factors. The method has also provided predictions about additional miRNAs regulating this process and the specific developmental phases they regulate, several of which were experimentally validated. Our analysis uncovered links between miRNAs involved in lung development and differentially expressed miRNAs in idiopathic pulmonary fibrosis patients, some of which we have experimentally validated using proliferation assays. These results indicate that some disease progression pathways in idiopathic pulmonary fibrosis may represent partial reversal of lung differentiation.
Keywords: systems biology, network modeling
Many experiments now routinely profile both mRNAs and microRNAs (miRNAs) when studying various conditions, diseases, and biological processes. Most miRNAs target the genes they regulate by either degrade them or preventing them from being translated (1). It is estimated that miRNAs regulate the expression of half of the genes in the human genome (2). Although a single miRNA can target hundreds of genes, miRNAs often have overlapping targets and are acting combinatorially, thus creating a rich and complex regulatory network (3, 4).
Several computational methods were developed to identify miRNA targets using sequence analysis (1). Because of the small number of bases in the interface, such predictions often contain both false positives and false negatives (5) and, because they are context-independent, are less suitable to the analysis of specific responses and conditions. Because miRNAs often inhibit their direct targets, integrating sequence, mRNA and miRNA expression data are one way to improve such an analysis (6–8). Several methods, mostly based on (anti-) correlation or regression analysis, have been developed to use expression data when predicting targets of miRNAs (8–10). A representative example is GenMIR++ (5, 6), one of the first methods to integrate miRNA and mRNA expression profiles in a unified probabilistic model. GenMIR++ employs a generative model in which miRNA expression profiles are used to explain the expression of a putative target inferred from sequence analysis. Other methods search for anticorrelation (8, 9).
Although the methods mentioned were successfully applied to study gene regulation by miRNAs, they do not address the temporal dynamics of miRNA-regulated networks. Specifically, although these methods look for global relationships between the expression levels of an miRNA and its targets, they may miss important temporal aspects. Similar to other causal events (11), shifts in miRNA and mRNA profiles in a specific developmental stage or disease state can happen in a sequential manner. Static, correlation-based analysis may miss key regulatory miRNAs when these change at an earlier stage and so their global expression levels do not correlate with their targets.
To address this problem, we developed the MIRna Dynamic Regulatory Events Miner (mirDREM), which reconstructs dynamic regulatory networks that model the effects of transcription factors (TFs) and miRNAs on their targets over time. Such dynamic network models have been used for studying TF activity (12, 13); however, they have only used the TF data as static information (i.e., whether a TF can bind a gene or not). Although TF activity is often posttranscriptionally regulated (12), miRNA expression levels are an excellent indicator of their activity level and so can be used to determine if a specific miRNA is actively regulating genes. We have developed computational methods for using dynamic activity information and for restricting the assignments of miRNAs to targets based on their expected inhibitory effects.
To test our method, we generated expression data for lung development in mice. When applied to these data, mirDREM was able to identify several miRNAs that were controlling major developmental stages, several of which we have experimentally validated.
Results
The Dynamic Regulatory Events Miner (DREM).
mirDREM extends the dynamic regulatory events miner (DREM) (12, 13) to model regulation by miRNAs. DREM integrates time series gene expression data with protein–DNA interaction data (from ChIP-CHIP, ChIP-Sequencing, or motif information). DREM uses an input–output hidden Markov model (IOHMM) to identify bifurcation events, which are places in the time series where a set of genes that were previously coexpressed diverges. These split events are annotated with TFs that are predicted to regulate genes in the outgoing upward and/or downward paths, allowing us to associate temporal information (the timing of the splits, Fig. 1) with the often static protein–DNA interaction data. Unlike standard HMMs, which rely on a transition probability matrix, DREM uses an L1 logistic regression classifier to determine transition probabilities.
Fig. 1.

Method overview. mirDREM models transcriptional and posttranscriptional regulation of mRNA expression levels. Using an IOHMM model, it combines regulatory interactions (1) for TF–gene (Upper) and miRNA–gene relationships (Lower), with (2) time series expression data of genes (Upper) and miRNAs (Lower) to reconstruct a dynamic network (3). mirDREM annotates split nodes (black circles in 3) in which gene expression diverges with the miRNAs and TFs that it predicts to control this time-specific split event. This leads to a network model that identifies the key TFs and miRNAs controlling the biological process being studied, their targets, and their time of activation.
Although DREM can be used to model regulation by miRNAs (using a set of predicted targets as static data), such an approach does not fully use miRNA expression data. DREM does not use the expression levels of TFs because several TFs are posttranscriptionally regulated and so their expression levels do not always correspond to their activity level (12). In contrast, miRNAs are transcriptionally regulated and in the majority of cases their expression levels directly correspond to their activity. In addition, unlike TFs that can serve as activators or repressors, miRNAs directly repress their targets, leading to anticorrelated expression levels between miRNAs and their targets (1, 8, 9, 10, 14). Finally, miRNAs often target fewer genes than TFs and their impact on each of their targets is limited (6, 15). Thus, to fully use miRNAs, we developed computational methods as discussed in the following section.
mirDREM: Dynamic Regulation by miRNAs.
To fully use the temporal miRNA information when modeling dynamic regulatory networks, we developed regression-based scaling methods that estimate the activity levels of miRNAs based on their expression changes relative to a previous time point (Fig. 1). We designed a logistic model that combines the miRNA expression level and its binding affinity to a predicted mRNA target to determine its activity level (Materials and Methods).
To model that miRNAs inhibit their targets, we defined a constraint optimization problem for learning L1 classifiers in which the constraints (negative coefficients) are restricted to the miRNA parameters, whereas TF parameters can still be positive or negative. As we discuss in Materials and Methods, the new formulation and solver is guaranteed to converge to a global (constrained) optima and is computationally efficient.
To reflect the different sizes of the sets regulated by miRNAs and TFs, we use a different significance cutoff for their inclusion in the final model. Note that because our model allows for the assignment of multiple miRNAs to the same split node, several of the splits in the model reconstructed by mirDREM are controlled by multiple members of the same family, in agreement with experimental studies (4, 16).
A Dynamic Regulatory Network for Lung Development in Mouse.
To test mirDREM, we studied the tightly orchestrated process of lung development and alveolar development. The murine model is ideal to study the latter stages of lung development because alveolar septation is postnatal in rodents. This process has also significant relevance to human disease. In premature infants, this stage of lung development is compromised (17, 18), leading to surfactant deficiency and respiratory distress syndrome as well as to bronchopulmonary dysplasia (18). Although significant work has been performed to study various regulatory networks activated during lung development (19), relatively little is known about the temporal role miRNAs play in this process.
We measured lung mRNA and miRNA expression levels at five developmental time points with four to five biological replicates collected for each time point (0, 4, 7, 14, and 42 d; Materials and Methods). We used mirDREM to combine the temporal mRNA and miRNA expression data with static TF–gene interaction data (20) and miRNA–gene interaction predictions from the Microcosm database [which uses the miRanda algorithm (21)]. The reconstructed dynamic network is shown in Fig. 2. mirDREM identified a network with eight split nodes (SI Appendix, Dataset S1), with the biggest changes occurring in the week 1 to week 2 transition. This agrees well with current knowledge regarding lung development. Rapid alveolar septation is known to occur between postnatal days 7 and 14 (P7–P14), and the majority of alveolar septation is complete by P14 (22), although some alveoli are added until P28. The reconstructed network contains several TFs that were previously reported to control lung development. For example, FOX transcription factors (splits 1,2 in Fig. 2) are required for foregut formation and are critical for differentiation of respiratory epithelium. Similar to FOX proteins, GATA6 is also expressed in the epithelium and influences sacculation and alveolarization (23). Gli proteins, mediating Hedgehog signaling, are expressed mainly in the lung mesenchyme and regulate smooth muscle differentiation. The ETS family members are expressed in peripheral lung buds. The dominant negative form of Erm, a family member, is known to inhibit type II cell differentiation (24).
Fig. 2.
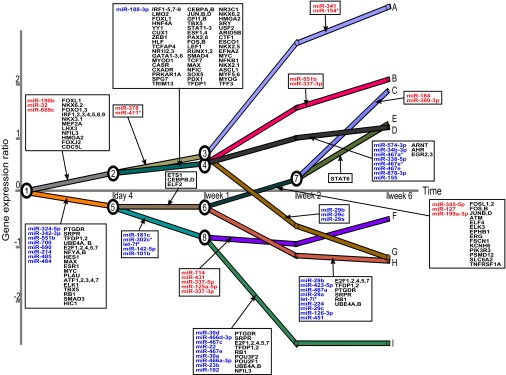
Dynamic regulatory network controlling lung development in mice. mRNA and miRNA expression data were collected at five developmental time points. Split nodes are numbered and all paths are marked with capital letters for further reference in the text. On each path emerging from a split node, a box with miRNA and TF names (in black) indicates gene regulation. miRNAs that are up-regulated (blue) are associated with downward paths out of a node, whereas down-regulated miRNAs (red) are associated with upward paths.
Several of the miRNAs identified by mirDREM have also been shown to regulate lung development. These include members of the miR-17–92 cluster (25) and the miR302/367 cluster (26). Overexpression of the miR-17–92 cluster promotes cell proliferation and inhibits lung epithelial progenitor cell differentiation. GATA6, a key transcription factor for formation of mature alveoli, transcriptionally regulates the miR-302/367 cluster (26). Transgenic mice with no expression of this miRNA cluster had smaller lungs prenatally and displayed reduced cell proliferation. Interestingly, in the day 4 to week 1 transition of the mirDREM model, GATA6 and miR-302c are both identified as controlling paths in the model.
In Fig. 2, we labeled the nine different paths in the model with the letters A to I and computed significantly enriched gene ontology (GO) terms for these paths (SI Appendix, Table S1). For example, path A (up-regulated genes) contains genes involved in remodeling extracellular structures, which is an important process during lung development (27). In contrast, genes on path I, which is down-regulated in the week 1 to week 2 transition, are enriched for the GO terms cell-cycle regulation and cell differentiation. This is likely the result of the reduction in alveolar and fibroblast proliferation from week 1 onward and increased differentiation at this later stage of development.
The Advantages of Modeling miRNA Dynamics.
We tested whether the dynamic models constructed by mirDREM provide insights beyond those that can be gained from current correlation or regression-based methods. We compared our models with results obtained by two other approaches: GenMiR++, which uses a Bayesian regression method (28), and Pearson correlation to find anticorrelated mRNA–miRNA target pairs (8, 9).
Fig. 3 presents the overlap between the miRNAs identified by each of these methods. All methods predict a large fraction of unique miRNAs. No single miRNA is predicted by all three methods, which points to the different rationales underlying the approaches. The miRNAs uniquely identified by mirDREM included miR-30d, which has been previously reported as abundant during mouse lung development (29), and miR-466d, which was also previously connected to mouse lung development (9). On the other hand, constitutively expressed miRNAs, including miR-21 and members of the let-7 family that are also known to be important for lung development (29), were not found by mirDREM. We attempted to compare these predictions with experimentally verified miRNA–gene interactions from the miRecords (30) and miRTarbase (31) databases. However, because of the very low coverage of these two databases, overlap for all methods was very low (SI Appendix, Table S2).
Fig. 3.

Comparison of miRNA target discovery methods. Venn diagram for the pairwise and overall overlap between active miRNAs identified by the three methods.
Although no “gold standard”-validated lung development miRNA list exists, of the six miRNAs predicted by mirDREM that we experimentally validated (see the following section), none was predicted by GenMiR++ and only one (miR-125a-5p) was predicted by correlation, providing anecdotal evidence that mirDREM can accurately identify important miRNAs that are missed by other methods. To more globally compare these three methods, we looked at the top 300 mRNAs that each method predicts (Materials and Methods) and analyzed their functional enrichment. As shown in SI Appendix, Tables S3–S5 and Dataset S2, the significant GO categories enriched in the top correlation and GenMiR++ targets correspond to very general biological processes. On the other hand, significant categories enriched in genes ranked by mirDREM include a number of categories related to organ and immune response development, consistent with findings about the relationship between these processes during lung development (32). We have also analyzed the importance of constraining miRNAs to have a repressive role in regulating their targets (SI Appendix, Fig. S3 and Tables S6 and S7).
Robustness of mirDREM.
We have assessed the robustness of mirDREM to changes in the input parameter settings comparing model complexity and the set of predicted miRNAs. Specifically, we have looked at parameters that impact the complexity of the models reconstructed (the number of splits) and parameters that affect the set of miRNAs identified by mirDREM. In both cases, varying these parameters within a reasonable range did not lead to large differences between the reconstructed models or predicted miRNA sets, indicating that the IOHMM learning method is relatively robust (SI Appendix, Tables S8 and S9 and Fig. S4).
Validation of Predicted miRNAs.
Four of the split nodes in our reconstructed model are associated with the week 1 to week 2 transition, a crucial period in lung development (Fig. 2). This indicates that a large fraction of the genes change their expression during this period. We tested eight miRNAs that were predicted to regulate genes during this transition. Of these, six were found to be highly expressed in developing lung tissues, although they were not previously associated with a specific stage (29)(miR-466d, 466a, 23b, 30a, 30d, and 125a), whereas no previous connection to lung development was known for the other two (miR-337 and 476c).
Because our validation experiments were performed in a mouse lung epithelial cell line (MLE-12), we first measured the expression levels of these eight miRNAs using quantitative PCR (qPCR) (Materials and Methods and SI Appendix, Fig. S5). In these cells, four of the eight miRNAs were expressed (23b, 30, 30d, and 125a), whereas the other four (miR-337, 466d, 466a, and 467c) had low or undetectable expression levels. To test if the mirDREM-predicted set of regulated genes is indeed activated by these miRNAs, we performed knockdown and overexpression experiments for these miRNAs (depending on their baseline expression in the cell line) followed by microarray profiling. For each miRNA transfection experiment, we selected the top 1,000 affected mRNAs (up-regulated for the knockdown experiments and down-regulated for the overexpression experiments). We next intersected the set derived for each miRNA with the genes assigned to a path by mirDREM. These experiments agreed with the mirDREM predictions. As can be seen in Table 1, six of the eight miRNAs we tested, including the two that have not been previously implicated in regulating lung development, had a significant overlap with paths they were predicted to regulate. The results for path enrichment did not change much when using different cutoffs for the hypergeometric statistic (SI Appendix, Table S10).
Table 1.
Agreement between the mirDREM model and validation experiments
| miRNA | Significant paths’ opposite direction | Corrected enrichment P values |
| miR-125a-5p | A, B, C, and E | 0.0108, 0.00008, 0.03872 |
| miR-337-5p | B, C, and E | 0.0332, 0.00008 |
| miR-467c | D | <10−6 |
| miR-466a-3p | D | 0.05152 |
| miR-466d-3p | D | 0.03904 |
| miR-30d | H | 0.01456 |
| miR-30a | — | — |
| miR-23b | — | — |
miRNA knockdown experiments and their agreement with targets on the mirDREM paths they are predicted to regulate in Fig. 2. The second column lists all paths that significantly overlap the top 1,000 DE genes after miRNA transfection (hypergeometric test, corrected P < 0.05), with the P value for each path listed in the last column.
We have also used Western blots to determine whether the protein levels of predicted miRNA targets changed after transfection of the miRNAs predicted by mirDREM to regulate them. For this analysis, we selected nine of the top scoring pairs (miR-466a-3p, GLI3; miR-466a-3p, AURKA; miR-466d-3p, GLI3; miR-466d-3p, AURKA; miR-467c, CDT1; miR-467c, POLQ; miR-30a, FANCD2; miR-30d, FANCD2; miR-125a-5p, SCN2B). Of these, we were unable to express two of the proteins in the cell lines we used (POLQ and SCN2B). As for the other seven pairs, six showed changes in protein levels in the direction predicted by mirDREM (four were statistically significant in the predicted direction, P < 0.05). Only one of the seven pairs did not agree with the direction predicted by mirDREM, and this negative result was not significant (SI Appendix, Fig. S6).
Overlap with miRNAs Identified in Idiopathic Pulmonary Fibrosis.
Developmental pathways are activated briefly in healthy adults, primarily during tissue repair. However, analysis of lung gene expression of patients with idiopathic pulmonary fibrosis (IPF), a chronic, lethal, and untreatable lung disease, reveals enrichment of developmental pathways such as Wnt, sonic hedgehog, PTEN, and TGF-β (33). Indeed, there is recent evidence that IPF can be viewed as a reversal of developmental stages (34, 35) leading to excessive deposition of connective tissue and destruction of the normal tissue structure.
We used three publicly available cohorts (www.lung-genomics.org/) (36) of patients with IPF to test whether the 56 miRNAs assigned to paths by mirDREM are differentially expressed (DE) in IPF patients. In total, 22 of these miRNAs (∼40%) were DE in at least one of the cohorts, including miR-214, miR-184, and miR-30d, which were found in all three cohorts (SI Appendix, Dataset S3). For the two larger cohorts, we found significant overlap (hypergeometric P value 0.005 for cohort 1, and 0.01 for cohort 2), indicating that a significant fraction of the miRNAs predicted to be involved in lung development are also deregulated in IPF lungs.
Interestingly, five of the six developmentally up-regulated miRNAs we tested (all except miR-467c) are found to be down-regulated in patients with IPF compared with healthy individuals (SI Appendix, Table S11). In contrast, one of the down-regulated miRNAs we experimentally studied, miR-337, is up-regulated in two of the patient cohorts.
The Role of miRNAs in Proliferation.
Path I (down-regulated genes) was highly enriched for cell-cycle categories. Five of the eight miRNAs we tested (all except for miR-337, miR-23b, and miR-125a) were predicted by mirDREM to regulate this path. Fibroblast cell proliferation is an active event constantly occurring in IPF lungs (37). Because most of these miRNAs were also changed in IPF, we decided to test their involvement in regulation of cell proliferation using a lung epithelial cell line. These experiments validated the predicted roles for three of the five miRNAs, whereas no effect on proliferation was seen for the other two (Fig. 4). Knockdown of both miR-30a and miR-30d led to a significant increase in proliferation (t test P value 0.016 and 0.006, respectively), whereas overexpression of mir-467c led to decreased proliferation (t test P value 2.95E-05), indicating that all three miRNAs are indeed negative regulators of proliferation and supporting the role predicted by mirDREM.
Fig. 4.

Cell proliferation experiments. Results of cell proliferation for miRNA knockdown (miR-30a/d) and overexpression (466a/d, 467c) experiments in lung epithelial cells. The difference in cell proliferation to the controls—scr inhibitor for knockdown and scr precursor for overexpression—are shown as ratio on the y axis. Errors bars show variation from eight replicates. *miRNAs with a significant difference to control (t test, P < 0.05).
Discussion
We presented mirDREM, a unique method for modeling dynamic regulation by miRNAs. We used mirDREM to reconstruct a dynamic regulatory network in lung development and experimentally tested miRNAs that were predicted to control a specific developmental stage and cell differentiation. Using transfection of miRNAs, we showed that the paths and targets predicted by mirDREM agree with the set of DE genes following perturbation of the miRNAs. For some of these miRNAs, we were also able to determine a specific functional role in development by following up predictions related to the path they regulate. Several of the miRNAs predicted as regulating developmental genes are also DE in IPF, often in the opposite direction. These results add to a growing body of literature that suggests that miRNAs involved in development may play an opposite role in diseases (33, 38).
mirDREM, available from the supporting website (www.sb.cs.cmu.edu/drem), is implemented in Java and currently supports human and mouse TF and miRNA data. The software has a fully functional user interface that allows both easy data upload as well as retrieval of output models and network images.
Our model assumes that miRNAs have a negative (repressive) influence on expression. Although this appears to be the major form of miRNA regulation (1), recent studies indicate that some miRNAs can also positively regulate their targets (7). For the data analyzed in this paper, constraining miRNAs to only negatively regulate their targets led to more meaningful biological networks (SI Appendix, Fig. S3 and Table S6). We have also tested mirDREM using a second set of computationally predicted miRNA targets [TargetScan (2)]. Similar to previous analyses, we find that the overlap of computationally derived miRNA–gene interactions from different algorithms is not high (39). However, several of the miRNAs we experimentally validated were also in the TargetScan results (SI Appendix, Fig. S7 and Tables S12–S14). This indicates that using the intersection of miRNAs identified by multiple computational methods may improve the accuracy of regulatory models for miRNA regulation.
mirDREM focuses on the reconstruction of dynamic regulatory networks. Our comparison with methods that look at overall correlations between mirRNAs and their predicted targets indicates that such methods often identify a complementary set of miRNAs. Although mirDREM was able to correctly identify mirRNAs that are active in specific developmental stages, it is less effective at identifying global-acting miRNAs because it cannot link these to specific splits. In contrast, methods that look for global correlation miss important miRNAs that are controlling specific stages in development or disease progression. Thus, although we view mirDREM as a computational method that addresses an important need in the analysis of time series biological data, we see cases in which it should be used in combination with other methods that look at global correlations. Combined, these methods are able to identify both the local (temporal) activation patterns and the constitutively active ones.
Materials and Methods
Integrating Interaction and Expression Data to Model Dynamic Regulatory Networks.
We introduce an algorithm to learn a dynamic regulatory map by integrating protein–DNA and miRNA–gene regulatory relationships with time series expression data of genes and their miRNA regulators. Fig. 1 illustrates the different data sources that are used. Following Ernst et al. (12), we construct an IOHMM in which the set of hidden states (nodes) are each associated with a Gaussian output distribution representing the expression levels of genes assigned to them. The set of states is learned as part of the algorithm and depends on the biological process being studied. If a set of genes that has been coexpressed up to a certain time point diverges, the algorithm designates that point as a split node and learns a L1-logistic regression classifier (based on the static input data) that assigns genes to the up or down paths out of this node. The advantage of using a L1-regularized logistic regression, often called lasso regression, is that it promotes sparsity by penalizing features that contribute little to the solution. This leads to models with only few TFs or miRNAs predicted for each split.
Incorporating miRNA Expression Levels.
We integrate the temporal miRNA expression data with static, sequence-based predictions to obtain a prior on the probability that a specific miRNA regulates a target mRNA at a specific time point t. Of particular interest are miRNAs that change their expression behavior during the time course and whose targets are changing in response to this change (SI Appendix, Fig. S1). Our model assumes that changes in miRNA expression levels lead to changes in their regulatory effect on target genes. In addition to their expression levels, the strength of the regulatory effect of a miRNA may be dependent on its likelihood of binding a specific target. Therefore, we combine the two values (activity and predicted binding) in a unified logistic function. Note that even though we only model down-regulation of mRNAs by miRNAs, the regulatory effects of a specific miRNA can be either positive or negative, depending on the change in expression from the prior time point (see SI Appendix, section I, for details).
A Constraint-Based Approach to Lasso Logistic Regression in mirDREM.
Because we expect that direct regulation by an miRNA leads to inhibition of the target genes, we only allow for negative regression coefficients for miRNAs, as opposed to TFs that can be either activators or repressors (SI Appendix, Fig. S2). This leads us to use constrained logistic regression (40) and, in particular instances, constrained lasso logistic regression. To solve this constrained optimization problem, we modified the approach described by Krishnapuram et al. (41) for lasso logistic regression. In ref. 41, they introduce an efficient iterative method that optimizes one entry in the weight vector at a time. Such an iterative assignment allows us to introduce the nonpositivity constraints because by working sequentially we can require that each weight remains smaller than, or equal to, zero. In the SI Appendix, we show that such a procedure guarantees that our learning method still converges to a global optimum.
Enrichment Computation for miRNAs at Split Nodes.
We use the hypergeometric statistic to select significant TFs and miRNAs assigned to split nodes in the model. In addition, for miRNAs, we also test if the change in their expression level agrees with the direction of the split.
Comparison with Other Methods.
We compared mirDREM with other methods that use expression data to identify active miRNAs and miRNA-regulated genes. The first, GenMir++ (28), uses a Bayesian regression method to identify functional miRNA targets from a set of miRNA–gene interactions. In our experiments, GenMir++ uses the same miRanda miRNA–gene interactions. Another common approach to find active miRNAs is to search for anticorrelated miRNA–mRNA expression pairs using Pearson correlation (9). We have implemented such an analysis in R, again using the miRanda predicted interactions. Because there is no systematic annotation of miRNAs, we relied on the predicted target mRNAs to more globally compare these methods. We ranked genes according to the significance or interaction strength provided by each method. For GenMiR++, we ranked genes by the strongest association found among all of the miRNAs tested. Similarly, for correlation analysis, genes are ranked by the strongest (negative) correlation value found among all miRNAs tested. In mirDREM, genes are ranked by the gene likelihood in the IOHMM model. To rank miRNAs for GenMiR++ and correlation, we reversed the role of the gene and miRNA (i.e., we ranked the miRNAs by the strongest association or correlation that was found for one of its target genes).
GO Analysis of Path Enrichment and Ranked Genes.
We used Ontologizer software version 2.0 (42) to compute GO enrichment for all paths in the mirDREM model and the top 300 ranked genes of all methods. The enrichment statistic used was the parent–child–union method with Benjamini–Hochberg multiple testing correction. Terms are considered enriched if P ≤ 0.05 after correcting for multiple testing.
Microarrays.
MiRNA profiling was performed using the Agilent Mouse miRNA microarray, which contains 627 mouse miRNAs and 39 mouse viral miRNAs (Sanger miRBase Release 12.0), following the manufacturer’s protocol (Agilent). Briefly, 100 ng of total RNA was dephosphorylated using calf intestinal alkaline phosphatase, denatured with DMSO and labeled with pCp-Cy3 using T4 RNA ligase at 16 °C for 2 h. The labeled RNA was purified using Micro Bio-spin columns (BioRad) and hybridized on Agilent miRNA microarrays at 55 °C for 20 h. After washing the microarrays with Gene Expression Wash Buffers, the slides were scanned on the Agilent Microarray Scanner. The scanned images were processed using Agilent’s Feature Extraction software version 10.7.1.1. For gene expression arrays, 500 ng of total RNA was used as the starting template for cDNA synthesis. This cDNA was used as a template to synthesize Cy3-labeled cRNA that was hybridized on 8 × 60K SurePrint G3 Mouse Gene Expression microarrays at 65 °C for 17 h. The dataset was deposited in the Gene Expression Omnibus (GEO) (accession no. GSE41412).
Cell Line and Reagents.
MLE-12 was purchased from the American Type Culture Collection (ATCC), frozen at an early passage, and each vial was then used for experiments was cultured for a limited number of passages (less than eight). For maintenance, cells were cultured in ATCC complete growth medium containing hydrocortisone, insulin, transferrin, estrogen, and selenium (HITES) medium supplemented with 2% (vol/vol) FBS, at 37 °C with 5% (vol/vol) CO2.
RNA Isolation.
Total RNA were extracted from cell and tissue samples with miRNeasy mini kit (Qiagen). Integrity of RNA was assessed by using an Agilent BioAnalyzer 2100 (Agilent Technologies) (RNA integrity number above nine).
Transfections.
PremiR-337, premiR-466a, premiR-466d, premiR-467c, anti-miR-30a, anti-miR-30b, anti-miR-125a, anti-miR-23b, and controls (miRNeg# 1) were purchased from Ambion. MLE-12 cells were grown in ATCC complete growth medium and transfected at 30–50% confluency in six-well plates using Lipofectamine 2000 (Invitrogen) with miRNA precursors and miRNA inhibitors at a final concentration of 20 nM. The dataset identifier in the GEO database is accession no. GSE41607.
Transfection Experiments Analysis.
Gene expression measurements with microarrays from the transfection experiments were normalized and the top 1,000 genes (overexpressed genes after knockdown and underexpressed genes after miRNA precursor transfection) were used for the intersection with mirDREM predictions. Enrichment was computed using the hypergeometric statistic and corrected for multiple testing using the Bonferroni procedure.
Proliferation Assays.
MLE-12 cells were plated in a 96-well cell culture plate. The cells were serum starved overnight and transfected with 25 nM of the respective miRNA inhibitors and miRNA precursors the next day. Twenty-four hours following transfection, 20 μL of the CellTiter 96 AQueous One Solution Reagent (Promega) was added to each well; 1 h later, the absorbance at 490 nm was measured with a plate reader.
Real-Time qPCRs.
Overexpression of miR-337, miR-466a, miR-466b, miR-467c, and inhibition of miR-30a, miR-30b, miR-125a, and miR-23b was evaluated using TaqMan MicroRNA Assay (Applied Biosystems) as specified in their protocol. Real-time PCR was performed using Universal Master Mix (Applied Biosystems). Expression levels of mature miRNAs were evaluated using the comparative CT method (SI Appendix, Fig. S5).
Supplementary Material
Acknowledgments
This work was supported by National Institutes of Health Grants 1R01 GM085022 (to Z.B.-J.), U01HL108642, R01HL095397, and RC2HL101715 (N.K. and K.V.P.) and by the Simmons Endowed Chair for Pulmonary Research.
Footnotes
Conflict of interest statement: N.K. is an inventor on use of microRNAs for the diagnosis and treatment of lung fibrosis.
This article is a PNAS Direct Submission. H.Y.C. is a guest editor invited by the Editorial Board.
Data deposition: The data reported in this paper have been deposited in the Gene Expression Omnibus (GEO) database, www.ncbi.nlm.nih.gov/geo [accession nos. GSE41412 (time series expression data) and GSE41607 (gene expression data after transfection)]. mirDREM is available from www.sb.cs.cmu.edu/drem.
See Commentary on page 15516.
This article contains supporting information online at www.pnas.org/lookup/suppl/doi:10.1073/pnas.1303236110/-/DCSupplemental.
References
- 1.Bartel DP. MicroRNAs: Target recognition and regulatory functions. Cell. 2009;136(2):215–233. doi: 10.1016/j.cell.2009.01.002. [DOI] [PMC free article] [PubMed] [Google Scholar]
- 2.Friedman RC, Farh KK-H, Burge CB, Bartel DP. Most mammalian mRNAs are conserved targets of microRNAs. Genome Res. 2009;19(1):92–105. doi: 10.1101/gr.082701.108. [DOI] [PMC free article] [PubMed] [Google Scholar]
- 3.Krol J, Loedige I, Filipowicz W. The widespread regulation of microRNA biogenesis, function and decay. Nat Rev Genet. 2010;11(9):597–610. doi: 10.1038/nrg2843. [DOI] [PubMed] [Google Scholar]
- 4.Tsang JS, Ebert MS, van Oudenaarden A. Genome-wide dissection of microRNA functions and cotargeting networks using gene set signatures. Mol Cell. 2010;38(1):140–153. doi: 10.1016/j.molcel.2010.03.007. [DOI] [PMC free article] [PubMed] [Google Scholar]
- 5.Betel D, Koppal A, Agius P, Sander C, Leslie C. Comprehensive modeling of microRNA targets predicts functional non-conserved and non-canonical sites. Genome Biol. 2010;11(8):R90. doi: 10.1186/gb-2010-11-8-r90. [DOI] [PMC free article] [PubMed] [Google Scholar]
- 6.Huang JC, et al. Using expression profiling data to identify human microRNA targets. Nat Methods. 2007;4(12):1045–1049. doi: 10.1038/nmeth1130. [DOI] [PubMed] [Google Scholar]
- 7.Tsang J, Zhu J, van Oudenaarden A. MicroRNA-mediated feedback and feedforward loops are recurrent network motifs in mammals. Mol Cell. 2007;26(5):753–767. doi: 10.1016/j.molcel.2007.05.018. [DOI] [PMC free article] [PubMed] [Google Scholar]
- 8.Huang GT, Athanassiou C, Benos PV. mirConnX: Condition-specific mRNA-microRNA network integrator. Nucleic Acids Res. 2011;39(Web Server issue):W416–W423. doi: 10.1093/nar/gkr276. [DOI] [PMC free article] [PubMed] [Google Scholar]
- 9.Dong J, et al. MicroRNA networks in mouse lung organogenesis. PLoS ONE. 2010;5(5):e10854. doi: 10.1371/journal.pone.0010854. [DOI] [PMC free article] [PubMed] [Google Scholar]
- 10.Setty M, et al. Inferring transcriptional and microRNA-mediated regulatory programs in glioblastoma. Mol Syst Biol. 2012;8:605. doi: 10.1038/msb.2012.37. [DOI] [PMC free article] [PubMed] [Google Scholar]
- 11.Bar-Joseph Z, Gitter A, Simon I. Studying and modelling dynamic biological processes using time-series gene expression data. Nat Rev Genet. 2012;13(8):552–564. doi: 10.1038/nrg3244. [DOI] [PubMed] [Google Scholar]
- 12.Ernst J, Vainas O, Harbison CT, Simon I, Bar-Joseph Z. Reconstructing dynamic regulatory maps. Mol Syst Biol. 2007;3:74. doi: 10.1038/msb4100115. [DOI] [PMC free article] [PubMed] [Google Scholar]
- 13.modENCODE Consortium et al. Identification of functional elements and regulatory circuits by Drosophila modENCODE. Science. 2010;330(6012):1787–1797. doi: 10.1126/science.1198374. [DOI] [PMC free article] [PubMed] [Google Scholar]
- 14.Muniategui A, et al. Quantification of miRNA-mRNA interactions. PLoS ONE. 2012;7(2):e30766. doi: 10.1371/journal.pone.0030766. [DOI] [PMC free article] [PubMed] [Google Scholar]
- 15.Inui M, Martello G, Piccolo S. MicroRNA control of signal transduction. Nat Rev Mol Cell Biol. 2010;11(4):252–263. doi: 10.1038/nrm2868. [DOI] [PubMed] [Google Scholar]
- 16.Bueno MJ, et al. Combinatorial effects of microRNAs to suppress the Myc oncogenic pathway. Blood. 2011;117(23):6255–6266. doi: 10.1182/blood-2010-10-315432. [DOI] [PubMed] [Google Scholar]
- 17.Coalson JJ. Pathology of new bronchopulmonary dysplasia. Semin Neonatol. 2003;8(1):73–81. doi: 10.1016/s1084-2756(02)00193-8. [DOI] [PubMed] [Google Scholar]
- 18.Jobe AH, Bancalari E. Bronchopulmonary dysplasia. Am J Respir Crit Care Med. 2001;163(7):1723–1729. doi: 10.1164/ajrccm.163.7.2011060. [DOI] [PubMed] [Google Scholar]
- 19.Ornitz DM, Yin Y. Signaling networks regulating development of the lower respiratory tract. Cold Spring Harb Perspect Biol. 2012;4(5) doi: 10.1101/cshperspect.a008318. [DOI] [PMC free article] [PubMed] [Google Scholar]
- 20.Schulz MH, et al. DREM 2.0: Improved reconstruction of dynamic regulatory networks from time-series expression data. BMC Syst Biol. 2012;6:104. doi: 10.1186/1752-0509-6-104. [DOI] [PMC free article] [PubMed] [Google Scholar]
- 21.Enright AJ, et al. MicroRNA targets in Drosophila. Genome Biol. 2003;5(1):R1. doi: 10.1186/gb-2003-5-1-r1. [DOI] [PMC free article] [PubMed] [Google Scholar]
- 22.Burri PH. Structural aspects of postnatal lung development - alveolar formation and growth. Biol Neonate. 2006;89(4):313–322. doi: 10.1159/000092868. [DOI] [PubMed] [Google Scholar]
- 23.Morrisey EE, et al. GATA6 regulates HNF4 and is required for differentiation of visceral endoderm in the mouse embryo. Genes Dev. 1998;12(22):3579–3590. doi: 10.1101/gad.12.22.3579. [DOI] [PMC free article] [PubMed] [Google Scholar]
- 24.Liu Y, Jiang H, Crawford HC, Hogan BLM. Role for ETS domain transcription factors Pea3/Erm in mouse lung development. Dev Biol. 2003;261(1):10–24. doi: 10.1016/s0012-1606(03)00359-2. [DOI] [PubMed] [Google Scholar]
- 25.Lu Y, Thomson JM, Wong HYF, Hammond SM, Hogan BLM. Transgenic over-expression of the microRNA miR-17-92 cluster promotes proliferation and inhibits differentiation of lung epithelial progenitor cells. Dev Biol. 2007;310(2):442–453. doi: 10.1016/j.ydbio.2007.08.007. [DOI] [PMC free article] [PubMed] [Google Scholar]
- 26.Tian Y, et al. Regulation of lung endoderm progenitor cell behavior by miR302/367. Development. 2011;138(7):1235–1245. doi: 10.1242/dev.061762. [DOI] [PMC free article] [PubMed] [Google Scholar]
- 27.McGowan SE. Extracellular matrix and the regulation of lung development and repair. FASEB J. 1992;6(11):2895–2904. [PubMed] [Google Scholar]
- 28.Huang JC, Morris QD, Frey BJ. Bayesian inference of MicroRNA targets from sequence and expression data. J Comput Biol. 2007;14(5):550–563. doi: 10.1089/cmb.2007.R002. [DOI] [PubMed] [Google Scholar]
- 29.Lu Y, Okubo T, Rawlins E, Hogan BLM. Epithelial progenitor cells of the embryonic lung and the role of microRNAs in their proliferation. Proc Am Thorac Soc. 2008;5(3):300–304. doi: 10.1513/pats.200710-162DR. [DOI] [PMC free article] [PubMed] [Google Scholar]
- 30.Xiao F, et al. miRecords: An integrated resource for microRNA-target interactions. Nucleic Acids Res. 2009;37(Database issue):D105–D110. doi: 10.1093/nar/gkn851. [DOI] [PMC free article] [PubMed] [Google Scholar]
- 31.Hsu S-D, et al. miRTarBase: A database curates experimentally validated microRNA-target interactions. Nucleic Acids Res. 2011;39(Database issue):D163–D169. doi: 10.1093/nar/gkq1107. [DOI] [PMC free article] [PubMed] [Google Scholar]
- 32.Condon TV, Sawyer RT, Fenton MJ, Riches DWH. Lung dendritic cells at the innate-adaptive immune interface. J Leukoc Biol. 2011;90(5):883–895. doi: 10.1189/jlb.0311134. [DOI] [PMC free article] [PubMed] [Google Scholar]
- 33.Selman M, Pardo A, Kaminski N. Idiopathic pulmonary fibrosis: Aberrant recapitulation of developmental programs? PLoS Med. 2008;5(3):e62. doi: 10.1371/journal.pmed.0050062. [DOI] [PMC free article] [PubMed] [Google Scholar]
- 34.Königshoff M, et al. WNT1-inducible signaling protein-1 mediates pulmonary fibrosis in mice and is upregulated in humans with idiopathic pulmonary fibrosis. J Clin Invest. 2009;119(4):772–787. doi: 10.1172/JCI33950. [DOI] [PMC free article] [PubMed] [Google Scholar]
- 35.Bolaños AL, et al. Role of Sonic Hedgehog in idiopathic pulmonary fibrosis. Am J Physiol Lung Cell Mol Physiol. 2012;303(11):L978–90. doi: 10.1152/ajplung.00184.2012. [DOI] [PubMed] [Google Scholar]
- 36.Pandit KV, et al. Inhibition and role of let-7d in idiopathic pulmonary fibrosis. Am J Respir Crit Care Med. 2010;182(2):220–229. doi: 10.1164/rccm.200911-1698OC. [DOI] [PMC free article] [PubMed] [Google Scholar]
- 37.King TE, Jr, Pardo A, Selman M. Idiopathic pulmonary fibrosis. Lancet. 2011;378(9807):1949–1961. doi: 10.1016/S0140-6736(11)60052-4. [DOI] [PubMed] [Google Scholar]
- 38.Milosevic J, et al. Profibrotic role of miR-154 in pulmonary fibrosis. Am J Respir Cell Mol Biol. 2012;47(6):879–887. doi: 10.1165/rcmb.2011-0377OC. [DOI] [PMC free article] [PubMed] [Google Scholar]
- 39.Sethupathy P, Megraw M, Hatzigeorgiou AG. A guide through present computational approaches for the identification of mammalian microRNA targets. Nat Methods. 2006;3(11):881–886. doi: 10.1038/nmeth954. [DOI] [PubMed] [Google Scholar]
- 40.Anand R, Reddy CK. Constrained logistic regression for discriminative pattern mining. Machine Learning and Knowledge Discovery in Databases. 2011;6911:92–107. [Google Scholar]
- 41.Krishnapuram B, Carin L, Figueiredo MAT, Hartemink AJ. Sparse multinomial logistic regression: Fast algorithms and generalization bounds. IEEE Trans Pattern Anal Mach Intell. 2005;27(6):957–968. doi: 10.1109/TPAMI.2005.127. [DOI] [PubMed] [Google Scholar]
- 42.Bauer S, Grossmann S, Vingron M, Robinson PN. Ontologizer 2.0—a multifunctional tool for GO term enrichment analysis and data exploration. Bioinformatics. 2008;24(14):1650–1651. doi: 10.1093/bioinformatics/btn250. [DOI] [PubMed] [Google Scholar]
Associated Data
This section collects any data citations, data availability statements, or supplementary materials included in this article.