

Significance
Local Ca2+ signals drive important events like synaptic transmission, neural plasticity, and cardiac contraction, yet the fundamental relationship between flux through a single channel and the Ca2+ amplitude within nanometers of the channel pore has eluded direct experimental measure. Here we reverse-engineer the problem by using Ca2+-dependent inactivation of channels as a nanometer-range biosensor of Ca2+ amplitude. We discovered an unexpected and dramatic boost in nanodomain Ca2+ amplitude, ten-fold higher than predicted on theoretical grounds. This boost in local Ca2+ signaling may act to maximize the biochemical information capacity of electrically\x{2011}active cells.
Keywords: signaling, uncaging, biosensor, electrodiffusion
Abstract
Local Ca2+ signals through voltage-gated Ca2+ channels (CaVs) drive synaptic transmission, neural plasticity, and cardiac contraction. Despite the importance of these events, the fundamental relationship between flux through a single CaV channel and the Ca2+ signaling concentration within nanometers of its pore has resisted empirical determination, owing to limitations in the spatial resolution and specificity of fluorescence-based Ca2+ measurements. Here, we exploited Ca2+-dependent inactivation of CaV channels as a nanometer-range Ca2+ indicator specific to active channels. We observed an unexpected and dramatic boost in nanodomain Ca2+ amplitude, ten-fold higher than predicted on theoretical grounds. Our results uncover a striking feature of CaV nanodomains, as diffusion-restricted environments that amplify small Ca2+ fluxes into enormous local Ca2+ concentrations. This Ca2+ tuning by the physical composition of the nanodomain may represent an energy-efficient means of local amplification that maximizes information signaling capacity, while minimizing global Ca2+ load.
Local Ca2+ signals increase the information capacity of signaling within a cell, by enabling short-range signals to operate independently of Ca2+ events elsewhere throughout the cell (1, 2). These local Ca2+ signals are the conduit that drives diverse activity-dependent events, such as synaptic transmission (3), neural plasticity (4–6), and cardiac excitation–contraction coupling (7). However, with regard to the Ca2+ amplitude within nanometers of individual Ca2+ channels, our knowledge is based predominantly on diffusion theory, which predicts ∼100 μM Ca2+ signals per picoampere flux at a distance of ∼10 nm from the pore (8–11). Although often quoted, this theory has been difficult to verify experimentally because diffusible Ca2+ indicators report space-averaged [Ca2+], and thus lack the spatial resolution needed for selective nanodomain reporting. Two recent efforts to overcome this limitation used voltage-gated Ca2+ channel (CaV)-tethered fluorescent Ca2+ indicators to isolate nanodomain signals (12, 13), but were met with unexpected difficulties: CaV-tethered indicators were unresponsive in the presence of high concentrations of intracellular 1,2-bis(o-aminophenoxy)ethane-N,N,N',N'-tetraacetic acid (BAPTA), a Ca2+ buffer that preserves Ca2+ elevations within tens of nanometers of active channels but eliminates it elsewhere (8–10). A lack of response under these conditions would arise if the majority of tethered channels were silent, raising the concern that fluorescence changes observed under milder Ca2+ buffering (12, 13) may represent the response of indicators tethered to silent channels, which nonetheless eavesdrop on Ca2+ from active channels nearby. To overcome this fundamental limitation, we used a reverse strategy, whereby Ca2+/calmodulin–dependent inactivation (CDI) of channels themselves serves as a nanometer-range indicator of [Ca2+]; a sensitive ionic readout that is unaffected by the presence of silent channels, and exquisitely specific to [Ca2+] in the nanodomain of active channels.
Our strategy was to calibrate CDI with spatially uniform Ca2+ uncaging, and then use CDI to measure CaV-generated Ca2+ signals. We chose CaV1.3 because it displays prominent CDI, driven by Ca2+ binding to calmodulin (CaM), an indwelling subunit of the channel (14–16). To calibrate CDI, we generated Ca2+ elevations via intracellular Ca2+ uncaging, while monitoring CDI via the flux of Li+ ions, which do not bind to CaM or Ca2+ indicators (Fig. 1A). We engineered the selectivity filter of the channel to favor the flux of Li+ permeation in the face of Ca2+ uncaging (refs. 17, 18; SI Appendix, Fig. S1), and restricted Ca2+ binding to the C lobe of CaM12 to isolate the simplest form of CDI (16).
Fig. 1.

Calibration of CDI. (A) CDI calibration schematic. Intracellular Ca2+ uncaging produces spatially uniform [Ca2+] elevations that drive CDI, as monitored via decay in the flux of Li+ ions. Use of a mutant CaM12 restricts Ca2+ binding to the C lobe to isolate the simplest form of CDI. (B) Step depolarization alone (Top) produced noninactivating Li+ currents (Bottom, black trace). Uncaging (arrow, 30 ms after depolarizing step) produced [Ca2+] elevations (Middle, red trace) and CDI (Bottom, red trace). CDI is the fraction of current lost 800 ms after uncaging (Right). This metric approximates steady-state CDI. (C) Nonspecific Ca2+ uncaging effects determined with CDI eliminated via Ca2+-insensitive CaM1234. (D) [Ca2+] uncaging to ∼3 μM had minimal effects on Li+ current. Format as in B. (E) C lobe CDI plotted as a function of uncaged [Ca2+] (as in B). Mild nonspecific effects (e.g., D) are accounted for as in SI Appendix, Fig. S1. Data from 51 cells followed a binding relation with EC50 = 2.2 ± 0.1 μM (dashed lines corresponding to half-maximal CDI) and Hill coefficient n = 1.5 ± 0.1.
Because photolysis is spatially uniform, the free Ca2+ concentration in the nanodomain will equal Ca2+ elsewhere within the cell, where it can be accurately determined with ratiometric indicators (19–21) (Fig. 1B, Middle row; Materials and Methods; and SI Appendix, Fig. S1). Before uncaging, step depolarization (Fig. 1B, Top) produced noninactivating Li+ currents (Fig. 1B, Bottom, black trace), consistent with an absence of voltage-dependent inactivation (22). Uncaging to low [Ca2+] evoked a small amount of inactivation (Fig. 1B, Left, red trace), and steps to higher [Ca2+] resulted in stronger CDI (Fig. 1B, Right). In parallel experiments, CDI was virtually eliminated with a Ca2+-insensitive CaM1234 (23, 24) (Fig. 1 C and D). This confirmed that uncaged Ca2+ had little direct effect on Li+ permeation, and enabled determination of CDI mediated entirely by Ca2+ binding to the C lobe of CaM (SI Appendix, Fig. S1). Pooled data from 51 cells followed a tight binding curve with half-maximal effective concentration, EC50 = 2.2 ± 0.1 μM and Hill coefficient n = 1.5 ± 0.1 (Fig. 1E). This procedure was tantamount to the familiar live-cell calibration of a fluorescent Ca2+ indicator, with the distinction that because CDI is an ionic measure, it will be precisely specific to active (rather than silent) CaV channels.
We turned next to CDI mediated by local Ca2+ elevations generated by flux through CaV channels (Fig. 2A). A graded degree of CDI was observed with variations of external Ca2+ concentration, using Ca2+ as the only external charge carrier. CDI averaged ∼50% at 0.05 mM [Ca2+]o (Fig. 2B). As before, we isolated Ca2+ binding to the C lobe of CaM. To be sure that CDI originated entirely from Ca2+ flux through the home channel, Ca2+ spread was restricted with 10 mM BAPTA, a Ca2+ chelator that eliminates all but the local Ca2+ within tens of nanometers of the channel (8–10). To standardize the voltage-dependent channel conformation, measurements of CDI were always performed with step depolarizations 30 mV positive to the voltage of half-activation, V1/2 (SI Appendix, Fig. S2), thus counterbalancing changes in surface-charge screening at varying [Ca2+]o.
Fig. 2.

Measuring CaV-generated local Ca2+ amplitude. (A) Schematic use of CDI to measure nanodomain Ca2+ amplitude. (B) Local Ca2+-mediated CDI data. Colored traces correspond to external solutions with Ca2+ as the only charge carrier. These contained 40 (red), 0.6 (orange), 0.15 (green), and 0.05 mM (blue) external [Ca2+] (Materials and Methods). Black trace corresponds to 40 mM Ba2+ data, a reference for voltage-dependent inactivation. Intracellular solutions contained 10 mM BAPTA. Traces show mean ± SEM of 5–22 cells for each condition. CDI is the fraction of current lost after 800 ms (as in Fig. 1B). To counterbalance surface charge screening, all step depolarizations were chosen 30 mV positive to V1/2, the voltage of half-activation (SI Appendix, Fig. S2). (C) Single-channel data. Voltage ramps (Top) evoked CaV1.3 single-channel Ba2+ currents (gray traces). Patches containing a single channel were identified by currents entirely bounded by the closed- (zero line) and open-channel (dashed line) levels (SI Appendix, Fig. S2). Hundreds of sweeps from five patches were averaged to yield <iBa>, the average single-channel flux in 40 mM Ba2+ (solid black curve overlaid with bottom sweep). At the relevant step potential (V1/2 + 30 mV), <iBa> = 0.27 pA (black circle). (D) Whole-cell conversions. An identical ramp protocol (compare with C) was used in the whole-cell configuration. Black trace (40 mM Ba2+ data) provided a reference whole-cell current (iWC) representing N·<iBa>, where N is the number of channels. Data from a given cell shared a common N, determined from the ratio of whole-cell to single-channel Ba2+ current. N typically ranged from 1,000 to 5,000. Scaling by this value (iWC/N) converted whole-cell Ba2+ data to single-channel <iBa> amplitude (black symbol; 0.27 pA at V1/2 + 30 mV), and whole-cell Ca2+ data to single-channel <iCa> amplitude (colored symbols). CDI was eliminated via coexpression of Ca2+-insensitive CaM1234, and voltages were specified relative to V1/2 (SI Appendix, Fig. S2). Traces show mean ± SEM of seven cells. (E) Average single-channel Ca2+ flux, <iCa>, at V1/2 + 30 mV (D) depended on external Ca2+ according to a binding relation with EC50 ∼2 mM and Hill coefficient ∼1. Error bars, when larger than symbol size, show SEM, where error estimates were propagated through each numerical step. Note log scales. (F) CDI (as in B) plotted as a function of <iCa> (as in E) for each condition. Error bars show SEM. Data followed a binding relation with EI50 = 2.15 ± 0.43 × 10⁻³ pA and Hill coefficient n =1.5 ± 0.1.
Having described how CDI varies with external Ca2+, we still needed to determine how unitary flux depends on [Ca2+]o to obtain the desired signal–flux relationship. Direct measurements of unitary flux are feasible at physiological [Ca2+]o of 2 mM (25, 26), but not at 0.05 mM, where CDI was half-maximal; here channel flux would be far smaller than instrumentation noise, precluding identification of patches containing a single channel. We overcame this difficulty by performing whole-cell recordings to measure ICa = N · <iCa>, where N is the number of active channels on a cell and <iCa> reflects the time-averaged flux through a single stochastically gating channel. N was specified by measuring IBa = N · <iBa> in the same cell, while knowing <iBa> from parallel single-channel measurements. Representative records (Fig. 2 C and D) illustrate this approach. In the single-channel configuration, voltage ramps (Fig. 2C, Top) yielded well-resolved unitary Ba2+ currents (Fig. 2C, Bottom, gray sweeps), enabling identification of patches containing a single channel. Averaging many such records yielded <iBa> (solid black curve), the average flux through a single channel. Thus, at the relevant depolarization (30 mV positive to V1/2), <iBa> = 0.27 pA (Fig. 2C, black circle). In subsequent whole-cell experiments, N was determined for a given cell from the ratio of whole-cell to single-channel Ba2+ current, both having been performed with 40 mM Ba2+ as the charge carrier. Scaling by N converted whole-cell Ba2+ data to single-channel <iBa> amplitude (Fig. 2D, black symbol), and whole-cell Ca2+ data to single-channel <iCa> amplitude (Fig. 2D, colored symbols), where CDI was eliminated via coexpression of Ca2+-insensitive CaM1234. The ratio of <iCa> to <iBa> with 40 mM external divalent cation was ∼1/3 (Fig. 2D, black vs. red curves), as expected from prior single-channel studies (26, 27). Reducing external Ca2+ yielded progressively smaller currents (Fig. 2D), and <iCa> depended on external Ca2+ according to a binding relation with EC50 ∼2 mM (Fig. 2E), consistent with prior estimates (26, 27).
Knowing how CDI and <iCa> each vary with [Ca2+]o (Fig. 2 B and E) enabled CDI to be plotted as a function of <iCa>. The data conform to a conventional binding curve, with 50% CDI at a half-maximal effective flux, EI50 = 2.15 ± 0.43 × 10⁻³ pA and Hill coefficient n = 1.5 ± 0.1 (Fig. 2F). Thus, the dependence of CDI on unitary Ca2+ flux (Fig. 2F) has nearly equivalent shape to its dependence on cytosolic [Ca2+] (Fig. 1E), both having indistinguishable Hill coefficients. The plots differ mainly with regard to the physical units along the x axis. Although Fig. 1E plots CDI as a function of [Ca2+] (μM), Fig. 2F plots CDI as a function of <iCa> (in picoamperes). The scaling factor needed to optimally align all data points from our two experimental configurations provides a conversion factor, here termed the integrated gain, G = EC50 / EI50, which has the desired dimensionality for relating Ca2+ concentration to channel flux. Our estimate of G = 1.0 ± 0.2 mM/pA is nominally an order of magnitude larger than the widely quoted estimate of 100 μM/pA based on diffusion theory (detailed below). Repeating these analyses using the initial rate of CDI (rather than steady state) yielded nearly identical results (SI Appendix, Fig. S3). This suggested that nanodomain Ca2+ signaling may be considerably more efficient than previously appreciated, but how can this difference be explained?
One possible basis for the high G is that CaM could be located right at the mouth of the channel, at a radial position r ≅ 0. If this “close-CaM” hypothesis were true, CDI would be completely insensitive to Ca2+ buffering (explained below). We tested this idea by raising the concentration of intracellular exogenous Ca2+ buffer from 10 to 60 mM BAPTA and repeating the measurement of G (Fig. 3A and SI Appendix, Fig. S3). Contrary to prediction, G decreased by more than threefold, down to 0.28 ± 0.04 mM/pA, indicating that local [Ca2+] at the sensor is not only higher than expected, but also quite susceptible to buffering, inconsistent with the close-CaM hypothesis.
Fig. 3.

Intersection of data and theory. (A) Determination of buffer sensitivity. Traces (Top) show mean ± SEM data of 7–22 cells with 60 mM intracellular BAPTA; each color corresponds to a different [Ca2+]o (as in Fig. 2B). Bottom plots CDI as a function of <iCa> for each condition (data points). Format and 10 BAPTA curve (gray) are replicated from Fig. 2F. The 60 BAPTA data conformed to a binding relation with EI50 = 7.74 ± 0.68 × 10⁻³ pA and Hill coefficient n =1.5 ± 0.1. (B) Theoretical open-channel gain (GO) profiles (Eq. 1, with parameters in SI Appendix, Table S2). Profiles for varying BAPTA concentrations (green, black, and gray curves), with 1× (dashed) vs. 0.1× (solid curves) diffusion, relative to free-aqueous diffusion. (C) Theoretical integrated gain (G) profiles (Eq. 2) in the presence of 10 and 60 mM BAPTA (black and gray curves) for 1× diffusion. Experimental measures of G in 10 and 60 mM BAPTA are shown in horizontal blue and red lines, respectively. Intersection of data with theory pinpoints rCaM, the distance of CaM from the channel pore (blue and red arrows). The lack of correspondence between estimates of rCaM in each condition indicates that data are inconsistent with 1× diffusion. (D) Theoretical 0.1× diffusion profiles are larger and more buffer sensitive (cartoon and profiles). These produce rCaM estimates consistent with data (blue and red arrows overlap). (E) Theoretical 0.01× diffusion profiles overshoot the data (blue and red arrows misaligned). (F) Fitting relation; rCaM was determined (see blue and red arrows in C–E) for relative diffusion values between 1× and 0.01× for 10 and 60 mM BAPTA (blue and red curves, corresponding to G = 1.0 ± 0.2 mM/pA and G = 0.28 ± 0.04 mM/pA, respectively). Thick and thin curves correspond to analysis with mean ± SEM data. Data are most consistent with ∼0.1× diffusion and rCaM ∼7 nm (as in D).
To reconcile these observations and their implications for Ca2+ signaling, we turned to classical Neher–Stern diffusion theory (8, 9), which predicts that in the nanodomain of an open channel, the [Ca2+]/flux ratio (GO, open-channel gain) depends on two factors, reflecting dispersion and buffering:
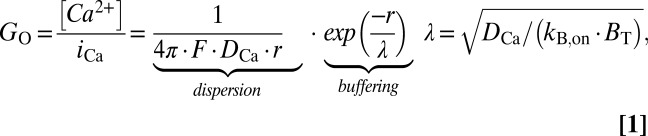 |
where r is distance from the channel pore, DCa is the diffusion coefficient of free Ca2+ ions, and F is Faraday’s constant. In the absence of buffering, dispersion alone would produce a 1/r spatial gradient, reflecting the dilution of Ca2+ as it diffuses into hemispherical annuli of growing volume (Eq. 1 and Fig. 3B, dashed green curve). The buffering factor incorporates a length constant (λ, Eq. 1), reflecting the interplay between diffusion and buffering. Ca2+ buffers can intercept Ca2+ ions, but only with finite kinetics, specified by kB,on (buffer association rate), and BT (total concentration of diffusible intracellular buffer). Thus, buffering has no efficacy at r = 0 where new ions enter the cytoplasm for the first time, but grows in influence as time from first entry and distance from the pore increase (Fig. 3B, dashed black and gray curves). Eq. 1 holds for virtually the entire period of a channel opening because compact nanodomain dimensions ensure that Ca2+ influx, diffusion, and buffering all reach steady state within microseconds of channel opening (SI Appendix, Fig. S4). Similarly, [Ca2+] drops to baseline levels (∼0 mM with BAPTA present) within microseconds once the channel shuts (10, 11, 16). Taking account of the duty cycle of channel opening and closing characterized by channel open probability (PO), and the cooperativity of CDI reflected by Hill coefficient (n), the integrated gain (G, derived in SI Appendix, section III) is given by
where κ, a correction factor for the intermittency of channel opening, would be unity if PO = 1, and greater than unity if PO < 1. In our case, PO = 0.43 was measured from single-channel data (SI Appendix, Fig. S2), n = 1.5 was obtained from the steepness of CDI-binding relations (Figs. 1E, 2F, and 3A), and κ was thus determined to be ∼1.3.
Reckoning with channel intermittency enabled direct comparison of theory to data. Thus, our experimental measurements of G (Fig. 3C, blue and red horizontal lines) are at odds with spatial profiles predicted by diffusion theory with conventional parameter values (Eqs. 1 and 2), which require CaM to be very close to the pore with 10 mM BAPTA but farther away with 60 mM BAPTA (Fig. 3C, blue and red arrows misaligned), a highly implausible scenario. The conflict would be resolved if the diffusion coefficient (DCa) were reduced 10-fold below that of free aqueous diffusion. Then, the amplitude of nanodomain [Ca2+] would be increased (due to Ca2+ backlog), and the radial falloff of Ca2+ would be steepened (due to shorter λ). Ca2+ diffusion theory could then account for our seemingly contradictory findings of a boosted G in 10 BAPTA that drops significantly in 60 BAPTA, all with CaM at a fixed position relative to the pore (Fig. 3D, blue and red arrows overlap). Further reduction in DCa, to a level 100-fold below free aqueous diffusion causes theory to overshoot the data (Fig. 3E, blue and red arrows again discrepant). Accordingly, we performed a systematic analysis to determine how putative CaM position (rCaM) would depend on variation in DCa (Fig. 3F). Intersection of plots for data obtained with 10 and 60 mM BAPTA puts narrow constraints on both Ca2+ diffusion (∼10-fold below free aqueous value), and CaM position (∼7 nm from the channel pore), as depicted in Fig. 3D. With this empirical estimate of DCa in hand, profiles of the open-channel gain (GO, Eq. 1) were determined to be remarkably larger and more buffer sensitive than those based on aqueous diffusion (Fig. 3B, solid vs. dashed curves).
We asked whether the unexpectedly high nanodomain [Ca2+] under 10 mM BAPTA could arise from crosstalk among neighboring channels, which can occur with intracellular EGTA (due to large λ; Eq. 1) (8–10) or if Ca2+ buffers are depleted (10, 12). Indeed, these factors may explain why CaV-tethered fluorescent Ca2+ indicators are unresponsive in the presence of BAPTA (indicating a majority of silent channels) yet respond in a subset of cells loaded with EGTA [where Ca2+ can spread from active to neighboring silent channels; (12); see also ref. 13]. In the present study, high-buffer/low-flux conditions precluded buffer depletion (SI Appendix, Table S2 and Fig. S4), and the length constant (λ) imposed by 10 mM BAPTA is sufficiently short that Ca2+ spillover would be insignificant even if channels were packed at maximal density (SI Appendix, Fig. S5). These analyses support that our estimates are bona fide measures of G corresponding to a single active channel.
With regard to restricted nanodomain diffusion, we characterized the degree to which uncertainties in kB,on (Eq. 1) could alter our conclusions. We found that a 10-fold change in kB,on would only alter estimates of DCa by twofold, and that a substantial degree of diffusion restriction was absolutely necessary to explain our data (SI Appendix, Fig. S6). To estimate how far the region of restricted diffusion extends, we modeled cases in which diffusion was slowed only within the confines of the nanodomain (radius rnano), but not outside it (Fig. 4). Remarkably, the same 10-fold reduction in diffusion would recapitulate our data even if it were isolated to a hemisphere of rnano ∼15 nm (SI Appendix, Fig. S7). Smaller regions required further reductions in DCa to recapitulate data. Finally, we performed additional modeling to determine whether our estimates of DCa and rCaM could be altered by volume exclusion (e.g., by nearby organelles or cytosolic CaV domains) (28–30), or by electrodiffusion (Ca2+ attraction toward electronegative phospholipids) (30, 31). We determined that these factors might alter estimates of rCaM, but could only accentuate the required reduction in DCa (SI Appendix, Figs. S8 and S9).
Fig. 4.

Potential modes of physiological tuning. (A) Model of localized diffusion restriction extending over radius rnano from the pore, with normal diffusion at a distance. (B) Resulting GO profiles. Green profiles correspond to homogenous 1× and 0.1× profiles (replicated from Fig. 3B). Blue profiles correspond to conditions where the region of 0.1× diffusion is spatially isolated to rnano = 20 or 35 nm (SI Appendix, Fig. S7). Local Ca2+ gain can be amplified by increasing the degree of diffusion restriction near the channel (vertical arrow). The spatial extent of amplification could be adjusted by modulating the radius of diffusion restriction (horizontal arrow).
In summary, using a method that distinguishes between active and silent channels, we found that the gain of Ca2+ signaling via CaV channels is greatly amplified by the diffusional properties of Ca2+ within tens of nanometers of the pore. To maximize experimental precision, our experiments were performed with CaV1.3 channels in HEK cells, but a similar approach could be extended to other Ca2+-permeant channels in various cellular contexts. Indeed, our use of CDI to measure nanodomain Ca2+ amplitude mirrors the prior use of KCa channels (32, 33) and synaptic transmission (19–21) as biosensors for presynaptic Ca2+ amplitude. Given these measures, canonical estimates of DCa have typically been required to infer distance from CaV to sensor. Here, we expand upon the basic biosensor approach to enable direct estimates of both DCa and rsensor in the same preparation (Fig. 3F). In contrast to canonical parameters, our data indicate that CaV channels can amplify tiny Ca2+ fluxes into enormous Ca2+ concentrations, on the order of ∼1 mM per pA (Fig. 3B, solid green curve).
Our findings may have implications in diverse physiological contexts. With regard to biochemical signaling cascades, tiny ∼fA Ca2+ fluxes, generally believed not to partake in local signaling, could produce ∼μM Ca2+ signals sufficient to signal locally to molecules like CaM or CaMKII (34). Nanodomain boosting may similarly play a role in the contraction of ventricular myocytes, where controversy exists regarding whether activation of ryanodine receptors can be triggered by the opening of a single CaV channel [high-fidelity scenario supported by early experimental work (35–38)], or if the simultaneous opening of ∼10 channels is necessary [as suggested by recent models that take account of the small ∼fA flux through a single CaV channel at the +50 mV ventricular plateau potential (39–41)]. Our findings may reconcile this low-flux high-fidelity paradox given that a single CaV channel would, by virtue of nanodomain Ca2+ boosting, have the potency of ∼10 channels in the absence of this amplification. Similar implications may apply to presynaptic physiology, where the Ca2+ dependence of transmitter release has been experimentally determined (20, 21, 42, 43), and the sensitivity to exogenous buffers (EGTA and BAPTA) has been characterized in several preparations (44, 45). Whereas these findings are typically interpreted in the context of classical diffusion parameters, our findings may bear upon inferences of CaV–vesicle distance and stoichiometry.
With regard to mechanism, nanodomain Ca2+ boosting is most likely mediated by physical barriers to diffusion, termed tortuosity (28, 29), that slow the passage of free Ca2+ ions. Other potential means of diffusion reduction (e.g., fixed buffers), which limit movement by binding/immobilization of Ca2+ ions could only lower the concentration of free Ca2+ in the nanodomain, and thus are unlikely to play a role in our findings (SI Appendix, Fig. S4). Of note, the 10-fold reduction in diffusion of unbound Ca2+ ions implicated here by local reporting far exceeds the twofold attenuation previously advanced for bulk cytosol (46–48). On this view, the domain within close range of the channel is a remarkably diffusion-restricted environment, where a Ca2+ ion would collide with an obstacle in nine out of ten Brownian movements. This energy-efficient means of local amplification seems ideally suited to address a universal challenge of Ca2+ homeostasis: the toxicity of global Ca2+ overload, and energetic cost of Ca2+ extrusion. By locally amplifying Ca2+ signals produced by diminutive fluxes, nanodomains likely facilitate the maintenance of numerous independent Ca2+ sources, maximizing information signaling capacity, and minimizing global Ca2+ load.
It remains to be determined exactly how far the region of amplification extends and what the precise nature of the diffusion barriers might be. One possibility is that CaV cytosolic domains may physically impede diffusion over a ∼15 nm radius (SI Appendix, Fig. S7 and Fig. 4), as would be the case if Ca2+ ions passed through narrow CaV cytosolic crevices or portals (13, 49). Such a self-sufficient design would be robust to cellular context, and spatially isolated to the indwelling (50) and locally enriched pool (51) of CaM molecules mediating CDI and implicated in signaling to nuclear transcription factors (4, 5). Alternatively, the region of amplification could extend beyond the CaV itself, if augmented by diffusion-impeding assemblies of associated components. In this regard, it is interesting to note that CaV subtypes interact with a tremendous variety of proteins in different cellular contexts (52, 53). Indeed, the very same molecules that aggregate near CaV channels to convey downstream signals could also act to restrict diffusion, thereby increasing the gain between Ca2+ flux and biochemical response. It is similarly feasible that nanodomain boosting could be physiologically tuned by altering the density of associated components (Fig. 4B, vertical arrow, gain amplitude), or the radius over which associated components extend (Fig. 4B, horizontal arrow, gain radius). Such gain modulation would not only alter Ca2+ amplitude, but could also sharpen the Ca2+ profile, either by boosting Ca2+ in a restricted locale (Fig. 4) or by enhancing the efficacy of endogenous buffers like parvalbumin (54) (Fig. 3B). Thus, beyond amplification, diffusion-restricted nanodomains could play a role in curtailing crosstalk between Ca2+ sources, much like dendritic spines prevent Ca2+ spillover between adjacent postsynaptic sites (55).
Materials and Methods
Detailed methods can be found in SI Appendix. In brief, Rat α1D (14) was engineered (E716A) to enhance permeation of Li+ over Ca2+ (17, 18), and expressed in HEK293 cells as described (23). This mutant was used in all experiments. Whole-cell and single-channel recordings were as described (16). Ca2+ uncaging (Fig. 1), with a Cairn UV flashlamp, was performed 3–6 min after break-in; internal solutions contained Ca2+-loaded DMNP-EDTA (1–4 mM). Uncaging transients were minimized with citrate (1–50 mM), zero Mg2+, and zero ATP. Internal solutions were supplemented with phosphatidylinositol 4,5-bisphosphate and okadaic acid to stabilize CaV currents in the absence of Mg2+/ATP. To enable ratiometric monitoring of [Ca2+], internal solutions contained a single-wavelength Ca2+ indicator (Fluo4FF) and red-shifted dye (Alexa568).
Supplementary Material
Acknowledgments
We thank Dr. Ye Chen-Izu for providing flashlamp equipment; Ron Atkins for electronics repair; Ivy Dick for guidance with single-channel recordings; Wanjun Yang and the laboratory of Rich Lewis for tissue culture; and Yulong Li, Scott Owen, Huan Ma, Li Li, Israeli Ran, and Gordon Wang for feedback on the manuscript. Funding is acknowledged from the Howard Hughes Medical Institute, Jane Coffin Childs, and Stanford Dean's Fellowship (to M.R.T.) and Grants R01 MH065531 (to D.T.Y.) and R01 NS24067 and R01 GM058234 (to R.W.T).
Footnotes
The authors declare no conflict of interest.
This article contains supporting information online at www.pnas.org/lookup/suppl/doi:10.1073/pnas.1313898110/-/DCSupplemental.
References
- 1.Bootman MD, Lipp P, Berridge MJ. The organisation and functions of local Ca(2+) signals. J Cell Sci. 2001;114(Pt 12):2213–2222. doi: 10.1242/jcs.114.12.2213. [DOI] [PubMed] [Google Scholar]
- 2.Augustine GJ, Santamaria F, Tanaka K. Local calcium signaling in neurons. Neuron. 2003;40(2):331–346. doi: 10.1016/s0896-6273(03)00639-1. [DOI] [PubMed] [Google Scholar]
- 3.Neher E. Vesicle pools and Ca2+ microdomains: New tools for understanding their roles in neurotransmitter release. Neuron. 1998;20(3):389–399. doi: 10.1016/s0896-6273(00)80983-6. [DOI] [PubMed] [Google Scholar]
- 4.Deisseroth K, Bito H, Tsien RW. Signaling from synapse to nucleus: Postsynaptic CREB phosphorylation during multiple forms of hippocampal synaptic plasticity. Neuron. 1996;16(1):89–101. doi: 10.1016/s0896-6273(00)80026-4. [DOI] [PubMed] [Google Scholar]
- 5.Dolmetsch RE, Pajvani U, Fife K, Spotts JM, Greenberg ME. Signaling to the nucleus by an L-type calcium channel-calmodulin complex through the MAP kinase pathway. Science. 2001;294(5541):333–339. doi: 10.1126/science.1063395. [DOI] [PubMed] [Google Scholar]
- 6.Zucker RS. Calcium- and activity-dependent synaptic plasticity. Curr Opin Neurobiol. 1999;9(3):305–313. doi: 10.1016/s0959-4388(99)80045-2. [DOI] [PubMed] [Google Scholar]
- 7.Bers DM. Cardiac excitation-contraction coupling. Nature. 2002;415(6868):198–205. doi: 10.1038/415198a. [DOI] [PubMed] [Google Scholar]
- 8.Neher E. Concentration profiles of intracellular calcium in the presence of a diffusible chelator. Exp Brain Res. 1986;14:80–96. [Google Scholar]
- 9.Stern MD. Buffering of calcium in the vicinity of a channel pore. Cell Calcium. 1992;13(3):183–192. doi: 10.1016/0143-4160(92)90046-u. [DOI] [PubMed] [Google Scholar]
- 10.Roberts WM. Localization of calcium signals by a mobile calcium buffer in frog saccular hair cells. J Neurosci. 1994;14(5 Pt 2):3246–3262. doi: 10.1523/JNEUROSCI.14-05-03246.1994. [DOI] [PMC free article] [PubMed] [Google Scholar]
- 11.Naraghi M, Neher E. Linearized buffered Ca2+ diffusion in microdomains and its implications for calculation of [Ca2+] at the mouth of a calcium channel. J Neurosci. 1997;17(18):6961–6973. doi: 10.1523/JNEUROSCI.17-18-06961.1997. [DOI] [PMC free article] [PubMed] [Google Scholar]
- 12.Tour O, et al. Calcium Green FlAsH as a genetically targeted small-molecule calcium indicator. Nat Chem Biol. 2007;3(7):423–431. doi: 10.1038/nchembio.2007.4. [DOI] [PMC free article] [PubMed] [Google Scholar]
- 13.Tay LH, et al. Nanodomain Ca²⁺ of Ca²⁺ channels detected by a tethered genetically encoded Ca²⁺ sensor. Nat Commun. 2012;3:778. doi: 10.1038/ncomms1777. [DOI] [PMC free article] [PubMed] [Google Scholar]
- 14.Xu W, Lipscombe D. Neuronal Ca(V)1.3alpha(1) L-type channels activate at relatively hyperpolarized membrane potentials and are incompletely inhibited by dihydropyridines. J Neurosci. 2001;21(16):5944–5951. doi: 10.1523/JNEUROSCI.21-16-05944.2001. [DOI] [PMC free article] [PubMed] [Google Scholar]
- 15.Yang PS, et al. Switching of Ca2+-dependent inactivation of Ca(v)1.3 channels by calcium binding proteins of auditory hair cells. J Neurosci. 2006;26(42):10677–10689. doi: 10.1523/JNEUROSCI.3236-06.2006. [DOI] [PMC free article] [PubMed] [Google Scholar]
- 16.Tadross MR, Dick IE, Yue DT. Mechanism of local and global Ca2+ sensing by calmodulin in complex with a Ca2+ channel. Cell. 2008;133(7):1228–1240. doi: 10.1016/j.cell.2008.05.025. [DOI] [PMC free article] [PubMed] [Google Scholar]
- 17.Yang J, Ellinor PT, Sather WA, Zhang JF, Tsien RW. Molecular determinants of Ca2+ selectivity and ion permeation in L-type Ca2+ channels. Nature. 1993;366(6451):158–161. doi: 10.1038/366158a0. [DOI] [PubMed] [Google Scholar]
- 18.Ellinor PT, Yang J, Sather WA, Zhang JF, Tsien RW. Ca2+ channel selectivity at a single locus for high-affinity Ca2+ interactions. Neuron. 1995;15(5):1121–1132. doi: 10.1016/0896-6273(95)90100-0. [DOI] [PubMed] [Google Scholar]
- 19.Heidelberger R, Heinemann C, Neher E, Matthews G. Calcium dependence of the rate of exocytosis in a synaptic terminal. Nature. 1994;371(6497):513–515. doi: 10.1038/371513a0. [DOI] [PubMed] [Google Scholar]
- 20.Bollmann JH, Sakmann B, Borst JG. Calcium sensitivity of glutamate release in a calyx-type terminal. Science. 2000;289(5481):953–957. doi: 10.1126/science.289.5481.953. [DOI] [PubMed] [Google Scholar]
- 21.Schneggenburger R, Neher E. Intracellular calcium dependence of transmitter release rates at a fast central synapse. Nature. 2000;406(6798):889–893. doi: 10.1038/35022702. [DOI] [PubMed] [Google Scholar]
- 22.Tadross MR, Ben Johny M, Yue DT. Molecular endpoints of Ca2+/calmodulin- and voltage-dependent inactivation of Ca(v)1.3 channels. J Gen Physiol. 2010;135(3):197–215. doi: 10.1085/jgp.200910308. [DOI] [PMC free article] [PubMed] [Google Scholar]
- 23.Peterson BZ, DeMaria CD, Adelman JP, Yue DT. Calmodulin is the Ca2+ sensor for Ca2+ -dependent inactivation of L-type calcium channels. Neuron. 1999;22(3):549–558. doi: 10.1016/s0896-6273(00)80709-6. [DOI] [PubMed] [Google Scholar]
- 24.Zühlke RD, Pitt GS, Deisseroth K, Tsien RW, Reuter H. Calmodulin supports both inactivation and facilitation of L-type calcium channels. Nature. 1999;399(6732):159–162. doi: 10.1038/20200. [DOI] [PubMed] [Google Scholar]
- 25.Gollasch M, Hescheler J, Quayle JM, Patlak JB, Nelson MT. Single calcium channel currents of arterial smooth muscle at physiological calcium concentrations. Am J Physiol. 1992;263(5 Pt 1):C948–C952. doi: 10.1152/ajpcell.1992.263.5.C948. [DOI] [PubMed] [Google Scholar]
- 26.Weber AM, et al. N-type Ca2+ channels carry the largest current: implications for nanodomains and transmitter release. Nat Neurosci. 2010;13(11):1348–1350. doi: 10.1038/nn.2657. [DOI] [PubMed] [Google Scholar]
- 27.Hess P, Lansman JB, Tsien RW. Calcium channel selectivity for divalent and monovalent cations. Voltage and concentration dependence of single channel current in ventricular heart cells. J Gen Physiol. 1986;88(3):293–319. doi: 10.1085/jgp.88.3.293. [DOI] [PMC free article] [PubMed] [Google Scholar]
- 28.Nicholson C, Phillips JM. Ion diffusion modified by tortuosity and volume fraction in the extracellular microenvironment of the rat cerebellum. J Physiol. 1981;321:225–257. doi: 10.1113/jphysiol.1981.sp013981. [DOI] [PMC free article] [PubMed] [Google Scholar]
- 29.Tao A, Tao L, Nicholson C. Cell cavities increase tortuosity in brain extracellular space. J Theor Biol. 2005;234(4):525–536. doi: 10.1016/j.jtbi.2004.12.009. [DOI] [PubMed] [Google Scholar]
- 30.Tanskanen AJ, Greenstein JL, Chen A, Sun SX, Winslow RL. Protein geometry and placement in the cardiac dyad influence macroscopic properties of calcium-induced calcium release. Biophys J. 2007;92(10):3379–3396. doi: 10.1529/biophysj.106.089425. [DOI] [PMC free article] [PubMed] [Google Scholar]
- 31.Peskoff A, Bers DM. Electrodiffusion of ions approaching the mouth of a conducting membrane channel. Biophys J. 1988;53(6):863–875. doi: 10.1016/S0006-3495(88)83167-9. [DOI] [PMC free article] [PubMed] [Google Scholar]
- 32.Roberts WM. Spatial calcium buffering in saccular hair cells. Nature. 1993;363(6424):74–76. doi: 10.1038/363074a0. [DOI] [PubMed] [Google Scholar]
- 33.Yazejian B, Sun XP, Grinnell AD. Tracking presynaptic Ca2+ dynamics during neurotransmitter release with Ca2+-activated K+ channels. Nat Neurosci. 2000;3(6):566–571. doi: 10.1038/75737. [DOI] [PubMed] [Google Scholar]
- 34.Faas GC, Raghavachari S, Lisman JE, Mody I. Calmodulin as a direct detector of Ca2+ signals. Nat Neurosci. 2011;14(3):301–304. doi: 10.1038/nn.2746. [DOI] [PMC free article] [PubMed] [Google Scholar]
- 35.Cannell MB, Cheng H, Lederer WJ. The control of calcium release in heart muscle. Science. 1995;268(5213):1045–1049. doi: 10.1126/science.7754384. [DOI] [PubMed] [Google Scholar]
- 36.López-López JR, Shacklock PS, Balke CW, Wier WG. Local calcium transients triggered by single L-type calcium channel currents in cardiac cells. Science. 1995;268(5213):1042–1045. doi: 10.1126/science.7754383. [DOI] [PubMed] [Google Scholar]
- 37.Santana LF, Cheng H, Gómez AM, Cannell MB, Lederer WJ. Relation between the sarcolemmal Ca2+ current and Ca2+ sparks and local control theories for cardiac excitation-contraction coupling. Circ Res. 1996;78(1):166–171. doi: 10.1161/01.res.78.1.166. [DOI] [PubMed] [Google Scholar]
- 38.Collier ML, Thomas AP, Berlin JR. Relationship between L-type Ca2+ current and unitary sarcoplasmic reticulum Ca2+ release events in rat ventricular myocytes. J Physiol. 1999;516(Pt 1):117–128. doi: 10.1111/j.1469-7793.1999.117aa.x. [DOI] [PMC free article] [PubMed] [Google Scholar]
- 39.Poláková E, Zahradníková A, Jr, Pavelková J, Zahradník I, Zahradníková A. Local calcium release activation by DHPR calcium channel openings in rat cardiac myocytes. J Physiol. 2008;586(16):3839–3854. doi: 10.1113/jphysiol.2007.149989. [DOI] [PMC free article] [PubMed] [Google Scholar]
- 40.Sobie EA, Ramay HR. Excitation-contraction coupling gain in ventricular myocytes: Insights from a parsimonious model. J Physiol. 2009;587(Pt 6):1293–1299. doi: 10.1113/jphysiol.2008.163915. [DOI] [PMC free article] [PubMed] [Google Scholar]
- 41.Dixon RE, Yuan C, Cheng EP, Navedo MF, Santana LF. Ca2+ signaling amplification by oligomerization of L-type Cav1.2 channels. Proc Natl Acad Sci USA. 2012;109(5):1749–1754. doi: 10.1073/pnas.1116731109. [DOI] [PMC free article] [PubMed] [Google Scholar]
- 42.Wang LY, Neher E, Taschenberger H. Synaptic vesicles in mature calyx of Held synapses sense higher nanodomain calcium concentrations during action potential-evoked glutamate release. J Neurosci. 2008;28(53):14450–14458. doi: 10.1523/JNEUROSCI.4245-08.2008. [DOI] [PMC free article] [PubMed] [Google Scholar]
- 43.Sakaba T. Two Ca(2+)-dependent steps controlling synaptic vesicle fusion and replenishment at the cerebellar basket cell terminal. Neuron. 2008;57(3):406–419. doi: 10.1016/j.neuron.2007.11.029. [DOI] [PubMed] [Google Scholar]
- 44.Eggermann E, Bucurenciu I, Goswami SP, Jonas P. Nanodomain coupling between Ca²⁺ channels and sensors of exocytosis at fast mammalian synapses. Nat Rev Neurosci. 2012;13(1):7–21. doi: 10.1038/nrn3125. [DOI] [PMC free article] [PubMed] [Google Scholar]
- 45.Lin KH, Erazo-Fischer E, Taschenberger H. Similar intracellular Ca2+ requirements for inactivation and facilitation of voltage-gated Ca2+ channels in a glutamatergic mammalian nerve terminal. J Neurosci. 2012;32(4):1261–1272. doi: 10.1523/JNEUROSCI.3838-11.2012. [DOI] [PMC free article] [PubMed] [Google Scholar]
- 46.Kushmerick MJ, Podolsky RJ. Ionic mobility in muscle cells. Science. 1969;166(3910):1297–1298. doi: 10.1126/science.166.3910.1297. [DOI] [PubMed] [Google Scholar]
- 47.Donahue BS, Abercrombie RF. Free diffusion coefficient of ionic calcium in cytoplasm. Cell Calcium. 1987;8(6):437–448. doi: 10.1016/0143-4160(87)90027-3. [DOI] [PubMed] [Google Scholar]
- 48.al-Baldawi NF, Abercrombie RF. Calcium diffusion coefficient in Myxicola axoplasm. Cell Calcium. 1995;17(6):422–430. doi: 10.1016/0143-4160(95)90088-8. [DOI] [PubMed] [Google Scholar]
- 49.Kobertz WR, Williams C, Miller C. Hanging gondola structure of the T1 domain in a voltage-gated K(+) channel. Biochemistry. 2000;39(34):10347–10352. doi: 10.1021/bi001292j. [DOI] [PubMed] [Google Scholar]
- 50.Erickson MG, Alseikhan BA, Peterson BZ, Yue DT. Preassociation of calmodulin with voltage-gated Ca(2+) channels revealed by FRET in single living cells. Neuron. 2001;31(6):973–985. doi: 10.1016/s0896-6273(01)00438-x. [DOI] [PubMed] [Google Scholar]
- 51.Mori MX, Erickson MG, Yue DT. Functional stoichiometry and local enrichment of calmodulin interacting with Ca2+ channels. Science. 2004;304(5669):432–435. doi: 10.1126/science.1093490. [DOI] [PubMed] [Google Scholar]
- 52.Müller CS, et al. Quantitative proteomics of the Cav2 channel nano-environments in the mammalian brain. Proc Natl Acad Sci USA. 2010;107(34):14950–14957. doi: 10.1073/pnas.1005940107. [DOI] [PMC free article] [PubMed] [Google Scholar]
- 53.Maximov A, Südhof TC, Bezprozvanny I. Association of neuronal calcium channels with modular adaptor proteins. J Biol Chem. 1999;274(35):24453–24456. doi: 10.1074/jbc.274.35.24453. [DOI] [PubMed] [Google Scholar]
- 54.Eggermann E, Jonas P. How the ‘slow’ Ca(2+) buffer parvalbumin affects transmitter release in nanodomain-coupling regimes. Nat Neurosci. 2012;15(1):20–22. doi: 10.1038/nn.3002. [DOI] [PMC free article] [PubMed] [Google Scholar]
- 55.Sabatini BL, Oertner TG, Svoboda K. The life cycle of Ca(2+) ions in dendritic spines. Neuron. 2002;33(3):439–452. doi: 10.1016/s0896-6273(02)00573-1. [DOI] [PubMed] [Google Scholar]
Associated Data
This section collects any data citations, data availability statements, or supplementary materials included in this article.