

Abstract
We present a minimal motif model for transmembrane cell signalling. The model assumes signalling events taking place in spatially distributed nanoclusters regulated by a birth/death dynamics. The combination of these spatio-temporal aspects can be modulated to provide a robust and high-fidelity response behaviour without invoking sophisticated modelling of the signalling process as a sequence of cascade reactions and fine-tuned parameters. Our results show that the fact that the distributed signalling events take place in nanoclusters with a finite lifetime regulated by local production is sufficient to obtain a robust and high-fidelity response.
Keywords: transmembrane signal transduction, signalling nanoclusters, high-fidelity transduction, mitogen-activated protein kinase pathway
1. Introduction
Transmembrane cellular signalling pathways are responsible for linking external stimuli and internal cellular actions. Typically, signalling molecules activate specific receptor proteins on the cell membrane triggering a cascade of interactions that diffuse messengers inside the cell regulating its activity, growth and development. Signalling pathways not only sense information but also integrate and process it into fast (seconds to minutes) and robust high-fidelity responses [1]. The importance of certain ubiquitous motifs in signalling pathways—such as activation cascades and feedback loops—for this processing is well recognized. How spatio-temporal mechanisms influence signal transduction is much less understood.
The interplay between cascades and feedback loops can explain intriguing properties, for example opposing cell fate decisions, depending on different stimuli provoking different activation amplitudes [2–6]. As a striking example, the mitogen-activated protein kinase (MAPK) pathway governs crucial cellular processes like proliferation and differentiation [7], and its dysfunction has been related to cancer [8]. In short, the pathway consists of the sequential activation of three kinases. The transduction process is initiated by a growth factor-induced recruitment of the SOS factor to the plasma membrane that links and activates a G-protein. The latter recruits a MAPK kinase kinase (MAPKKK) from the cytosol to the plasma membrane, which double-phosphorylates and activates a MAPK kinase (MAPKK) that, in turn, double-phosphorylates and activates a MAPK as a final signalling messenger. The most known example of this MAPK cascade corresponds to the regulation of ERK (MAPK), which features Ras as the G-protein, Raf as the MAPKKK and MEK as the MAPKK [7]. Mathematical models have shown that, in the absence of feedback regulation, the MAPK cascade elicits a steep response to the input signal if successive protein activations are performed in a distributive manner [9], while feedback regulations modulate the overall sensitivity of the pathway [10,11].
Recently, membrane nanocluster-concentrating signalling proteins have been proposed as a new fundamental mechanism to modulate and increase the efficiency and specificity of the MAPK cascade [12,13]. The work by Harding & Hancock [14] has revealed that activated receptor proteins aggregate in the membrane forming nanoclusters that recruit the downstream factors (Raf, MEK and ERK) from the cytosol and perform signal transduction. These signalling platforms (figure 1) display two important spatio-temporal characteristics: they are transient with short lifetimes (typically under 1 s) and dispersed in the cell membrane occupying a small reaction volume (radii ≈ 10 nm) [14]. When the nanocluster spatial organization is combined with the corresponding cascades and feedback loops, in silico and in vivo analyses of MAPK signalling show that the system is able to perform high-fidelity signal transduction. The numerical implementation of the latter proposal by Tian et al. [15] shows that in a range of kinetic parameters, nanoclusters work as switches responding maximally to very low-input signals. As the generation of signalling platforms is proportional to the input stimulus, nanocluster ultrasensitivity results in high-fidelity signal transduction (the global response is proportional to the stimulus). Despite the undeniable relevance of the work of Tian et al. [15], a critical analysis of the contribution of the spatio-temporal nanocluster dynamics on the signal/response behaviour is missing. The intricacy of the signalling cascade and high number of tuned-for-ultrasensitivity parameters in that in silico approach hinders to discriminate the role of the spatio-temporal nanocluster dynamics in signalling output.
Figure 1.
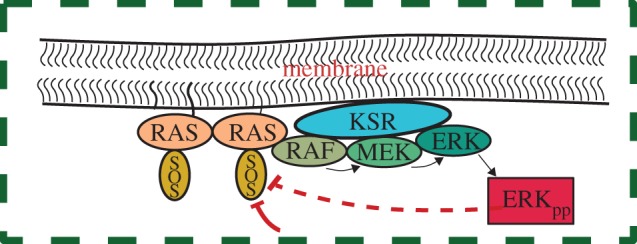
Sketch of the Ras–MAPK signalling platform as described in the literature [7,14]. Negative feedback regulations with two different origins have been represented with thick lines: the solid one corresponds to an external regulation, whereas the dashed one stands for an internal self-regulation. (Online version in colour.)
In this paper, we consider a remarkably simple and generic motif model that incorporates the aggregation of signalling proteins into discrete transient domains but that simplifies the pathway structure to unveil the importance of the spatio-temporal dynamics of membrane nanoclusters. We want to emphasize that nanocluster dynamics may control the general stimulus/response behaviour of signalling processes involving dispersed signalling platforms, regardless of the particular architecture of their signalling circuits. Interestingly, we find that complex behaviours attributed to the particular architecture—cascades of distributed activations and feedback loops—of signalling pathways can also be achieved by regulating the spatio-temporal dynamics of nanoclusters encapsulating much simpler signalling motifs. More specifically, ultrasensitivity of signalling platforms leading to high-fidelity transmission is found to be affected by their lifetime. To explore how cells might have protected the fidelity of signal transduction, two scenarios have been compared: a situation where the nanocluster lifetime is externally regulated, and the case where it is not prefixed but linked to their local activity (figure 1). In the latter case, we report that self-regulation induces individual switch-like behaviour and high-fidelity global responses even when the kinetic parameters are changed by orders of magnitude. This finding indicates that local nanocluster self-regulation might be a design principle to achieve robust and high-fidelity transmembrane signal transduction.
2. The model
The description of complex signalling circuits such as those for the MAPK pathway is often performed by the combination of transformation reactions modelled as simple enzymatic processes. Therefore, the simplest way to describe the complex features of nanoclusters signal transduction is to model each nanocluster as a minimal signalling motif based on the standard Michaelis–Menten formulation,
| 2.1 |
where NC, S, NC − S and P stand for the enzyme, substrate, intermediate and product species, respectively, and k1, k−1 and k2 are reaction rate constants. The role of the enzyme is assigned here to the nanocluster platform NC, where the activity of the signalling motif takes place. Typically, nanocluster platforms are transient structures assembled by anchored proteins in the inner leaflet of plasma membrane. These can be proteins-like GTPase Ras that become activated by mediation of the cytoplasmatic protein SOS as a catalyst when the external stimulus (e.g., growth factor) binds to membrane receptors. In the context of MAPK signalling, the first reversible reaction in equation (2.1) corresponds to the recruiting of Raf protein to immobile Ras nanoclusters and its subsequent activation, which starts the MAPK cascade, whereas the second (catalytic) step comprehends successive phosphorylation and activation of MEK and ERK kinases.
In our model, signalling nanoclusters are assumed to follow a dynamics that controls their number and lifetime. We first consider a birth/death mechanism that does not depend on the spatial distribution or the functioning of nanoclusters but represents some extrinsic regulation (model A, figure 2a). Nanoclusters are dynamically formed in the cell membrane at rate k0, whereas, independently, a fixed constant rate k3 determines the frequency of nanocluster disassembling. During their lifetime, signalling nanoclusters can generate product molecules according to the reaction motif in equation (2.1). The external stimulus is represented by parameter α, which is set to unity at maximal stimulus. The role of α is twofold. First, in vivo experiments reveal that nanocluster generation is proportional to input growth factor concentration [15], so we consider the frequency of nanocluster formation to be proportional to the stimulus  , where
  corresponds to nanocluster generation rate at maximal stimulus. Second, the kinetics of the production reaction is also considered proportional to the stimulus
  , with
  being the catalytic rate at maximal stimulus. This dependence indicates the existence of a generic positive feedback regulation in the signalling process that may account for different experimental evidences. For instance, it could fit the observed positive feedback regulation from Ras to SOS [16] that is known to enhance the switch-like behaviour of nanocluster response. It could also account for the fact that kinases are phosphorylated in separate encounters instead of occurring sequentially in a single encounter. Such distributive mechanism could also justify the latter dependence of k2 (see also references [9,15]).
Figure 2.
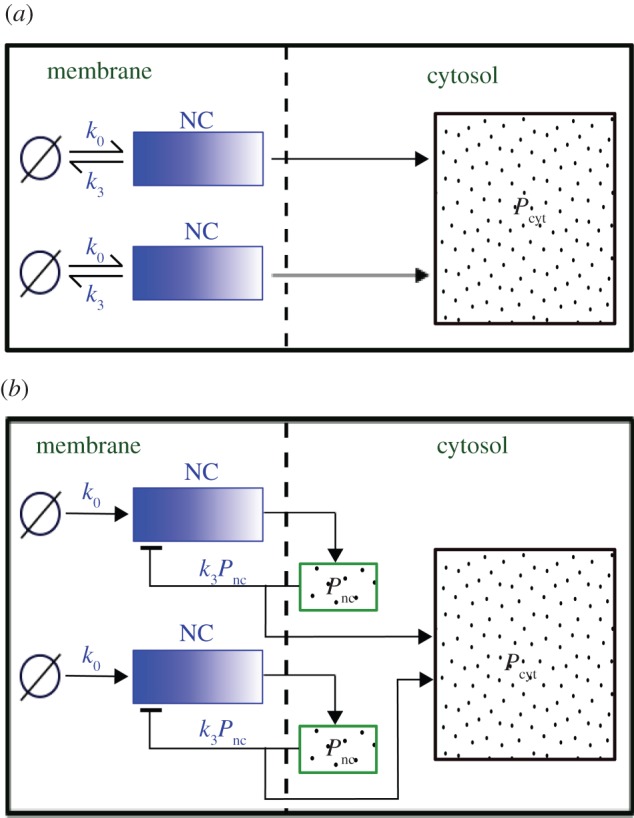
Schematic of the two proposed nanocluster (NC) disassembling mechanisms. (a) Model A: nanoclusters generate signalling output species that freely diffuse to the cytosol (Pcyt). Their lifetime is regulated by a frequency determined externally (k3). (b) Model B: signalling output molecules transiently reside close to the nanocluster (Pnc) and self-regulate its lifetime (k3Pnc). In (a,b) only two nanoclusters are represented, but the number in our simulations is in order of hundreds. (Online version in colour.)
In the numerical simulations, we follow a stochastic approach similar to the Gillespie algorithm [17,18]. All events corresponding to nanocluster birth and death, and to internal molecular transformations, are treated as stochastic events because of the small numbers of proteins involved and the limited lifetime of signalling platforms. In particular, we consider Poissonian processes with a frequency determined by the corresponding rates, which can be found in literature. For the MAPK pathway, cytosolic concentration of Raf is about 10−7 M [9], whereas Raf activation is of order ≈106–108 M−1 s−1 [3,11], which leads to a forward reaction rate k1 ≈ 0.1–10 s−1. The dissociation reaction is slower, k−1 ≈ 10−2 s−1 [3,11]. Catalytic constant rates corresponding to kinase phosphorylation processes are much larger, k2 ≈ 10–100 s−1 [3,11,15]. Finally, the death rate k3 = 2 s−1 is tuned to adjust the estimated 0.5 s average lifetime of Ras nanoclusters [15]. Activation frequency at maximal stimulus,  , is arbitrarily fixed to 1000 s−1, so that the average number of simulated nanoclusters is of the order of a few hundreds. This number is well below the typical maximum number of Ras nanocluster in a cell (≈50 000) [15] but assures a sufficient statistical ensemble for our stochastic simulations in a reasonable computational time.
3. Results
The stimulus/response behaviour of the model is evaluated by representing the velocity Vp of P formation normalized with respect to the maximal production (for α = 1) as a function of input stimulus α. For model A, individual signalling nanoclusters can generate both graded and switch-like outputs (figure 3), depending on the relative values of the reaction rates and whenever nanoclusters do not die too fast,  . If the limiting reaction is the formation of product molecules from the intermediate complex NC − S, k1 > k2, then nanoclusters generate a graded signal because the impact of the distributive mechanism in the formation of product P through
  becomes relevant. By contrast, for k1 < k2, the limiting reaction is the formation of NC − S. In this situation, once the intermediate complex is formed, product molecules are generated very fast, quite independent of the contribution of the stimulus in the catalytic step. Then, a nanocluster responds maximally to very low inputs (ultrasensitivity) and its output is switch-like, presenting a steeper response for greater differences between k1 and k2. These behaviours are summarized in figure 3a, which reports results from simulations run with a fixed number of operating nanoclusters independent of the input stimulus; namely, for a nanocluster generation rate k0 fixed to
  in order to average a large ensemble of signalling platforms. The stimulus/response curves are plotted for different values of
  , given k1 = 1 s−1. The global response of the system corresponds to the integration of local signalling events taking place in different activated nanoclusters. In the cell membrane, the number of nanoclusters is proportional to stimulus concentration,
  [15]. Figure 3b shows that this global response is nonlinear when the nanoclusters function in the graded regime (low values of
  ), while the system generates a graded, nearly linear product output in the regime of nanoclusters working as nanoswitches (large values of
  ), meaning that in this case the signalling response is directly proportional to input stimulus. The fact that nanoclusters respond maximally even at low-stimulus results in a global response only dependent on the number of nanoclusters, proportional to stimulus. This implies that the system of ultrasensitive nanoswitches achieves high-fidelity signal transduction by performing an analogue–digital–analogue transmission [15], an obvious advantage that could be one of the reasons for the active compartmentation of cell signalling processes. We note that our results are obtained for the simplest internal structure of the signalling pathway given in equation (2.1), without the recursion to intricate reactions profuse in biological details.
Figure 3.
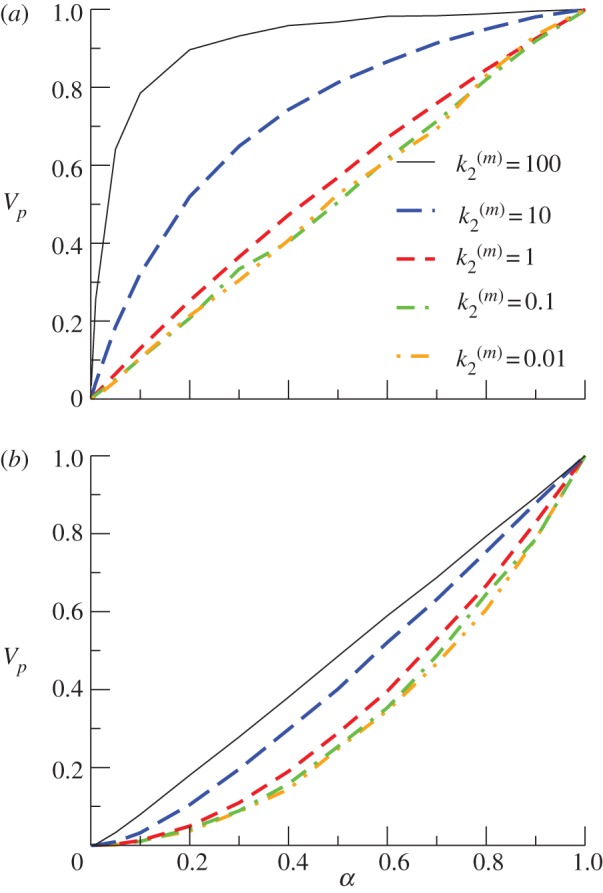
Global response Vp as a function of stimulus α in model A (external lifetime regulation), for k1 = 1 s−1. (a) Number of nanoclusters fixed and independent of the input stimulus ( ). (b) Number of nanoclusters regulated by stimulus (
 ). (Online version in colour.)
As an alternative to model A, we propose a signalling mechanism where the nanocluster lifetime is self-regulated via the coupling of nanocluster disassembly to its local activity, without the intervention of external factors (model B, figure 2b). We assume that product molecules remain transiently accumulated in a local pool that acts as an internal clock exerting a negative impact on the lifetime of the nanocluster. The more it produced, the higher its chances to die, as happens for instance in Ras–MAPK signalling: production of ERK promotes the phosphorylation of the SOS factor, which inhibits the activity of Ras aggregates [4,7,19]. The concept of local pool is acceptable for short nanocluster lifetimes of fractions of a second. Then, the restricted diffusive motion of product species does not allow them to travel far from the signalling membrane complex. We model the death rate of a nanocluster as k3Pnc,i(t), where k3 is a constant rate and Pnc,i(t) is the number of signalling product molecules in the local pool generated by the nanocluster i up to time t. The latter expression is the simplest dependence for a negative upstream inhibition owing to the final product protein and corresponds to the opposite limit to model A. Whereas model A considers that the dynamics of signalling platforms is completely regulated externally, in model B, this regulation is absolutely modulated by their local activity.
To investigate the impact of local activity regulating the death of nanoclusters, we study the response of model B for the same parameter values used in the simulations of model A in figure 3a,b. Lifetime self-regulation enhances nanocluster sensitivity, maintaining the switch-like response for a wider range of values of  , see figure 4a for a fixed number of signalling platforms independent of stimulus (
 ). The explanation is related to the fact that in model B nanoclusters can be active for longer periods when the input signal is low. In model A, most nanoclusters are disassembled before producing any P molecule when working under a low stimulus. In these cases, and in particular when
  is small, the effect of the input stimulus in the production of P becomes critical. Instead, in model B, the death probability of a nanocluster is zero until it has produced at least one P molecule, so that the second step in equation (2.1) is no longer critical even at low values of
  . The latter feature is responsible for enhancing nanocluster ultrasensitivity respect to model A regardless the kinetic conditions of the pathway and/or the input stimulus. In other words, the lifetime of nanoclusters in model B ‘adapts' to the signalling kinetics to assure the production of one product molecule even at low-stimulus and/or slow kinetics, forcing the nanocluster to act as a switch and generate a digital pulse. Note that the lifetimes of nanoclusters are longer in model B at low-input stimulus, they approach the lifetime fixed in model A (
 ) at moderate stimulus and may become even shorter at maximal stimulus. As a consequence of the gain in nanocluster sensitivity, the global response fidelity is also enhanced in model B, as it is shown in figure 4b for simulations using
  .
.
Figure 4.
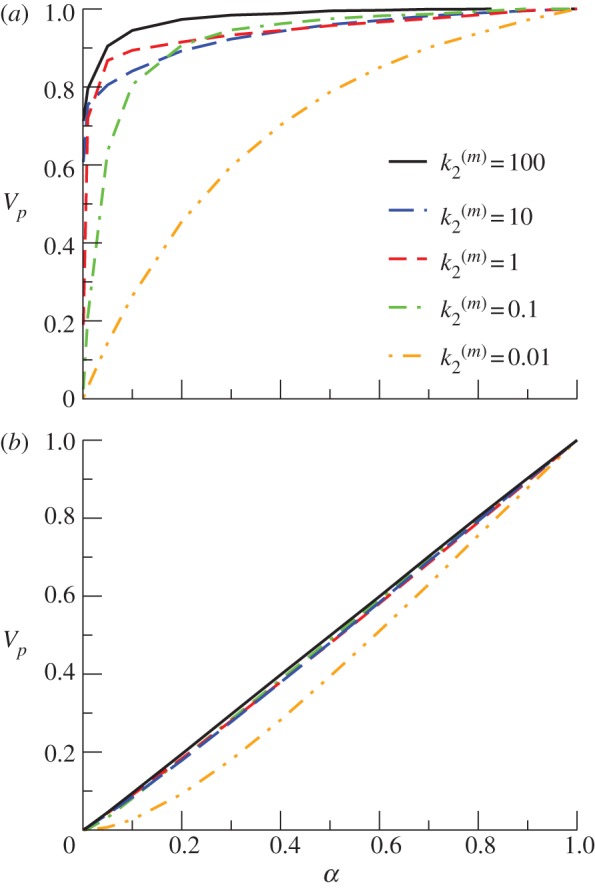
Global response Vp as a function of stimulus α in model B (lifetime self-regulation), for k1 = 1 s−1. (a) Number of nanoclusters fixed and independent of the input stimulus ( ). (b) Number of nanocluster regulated by stimulus (
 ). (Online version in colour.)
We have also performed a systematic study of signal transmission fidelity in both models at different values of the kinetic rates k1 and  . Fidelity of signal transduction is quantified here by parameter ϕ, computed as the integral of the global response rescaled by the number of nanoclusters, (VP/α)(α), for the whole range of input stimulus. High-fidelity transduction is achieved when the system response, Vp, correlates to stimulus, α, so when ϕ → 1. This requires nanoclusters to work in the range where they behave as ultrasensitive nanoswitches. Figure 5 presents the values of ϕ in the (k1,
 ) parameter space spanning two orders of magnitude for each kinetic rate. Note that high-fidelity signal transmission is a robust feature for the signalling mechanism involving a self-regulated nanocluster dynamics (model B), whereas for the scheme based on a fixed nanocluster lifetime (model A) such virtue requires a fine tuning of the reaction kinetic parameters. A statistical analysis of model robustness in the parameter phase space is not needed because our simple signalling motif only depends on two kinetic parameters (k1 and
  ), so that the complete information about model robustness is found in figure 5. A possibility to quantify robustness is to compute the ratio Γϕ′ between the parameter space areas where ϕ > ϕ′ within the total explored parameter area. Considering different ϕ′ values, it is shown that model B is much more robust (Γ0.75 = 0.891, Γ0.8 = 0.472, Γ0.85 = 0.158) than model A (Γ0.75 = 0.087, Γ0.8 = 0.046, Γ0.85 = 0.019), presenting 10-fold more surface of the ϕ parameter above the considered threshold values.
Figure 5.
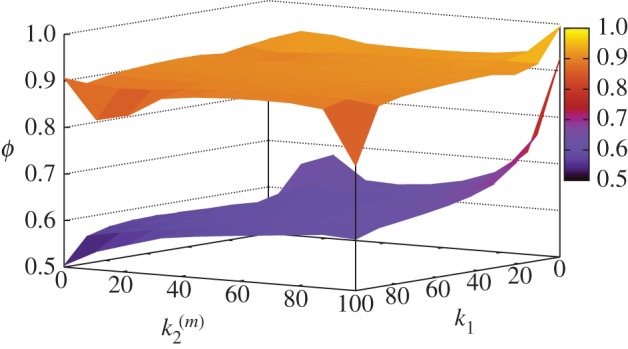
Signal transmission fidelity ϕ computed at different values of k1 and  for models A (bottom surface) and B (top surface). Simulations using
  . (Online version in colour.)
4. Conclusions
Two important conclusions can be derived from our simulations. First, the sensitivity of signalling platforms is found to be modulated by their lifetime, so it is not exclusively determined by the particular architecture of the signalling pathway as suggested so far. In this respect, the influence of the stimulus in the catalytic step of our approach—potentially reflecting either a distributive phosphorylation mechanism of intermediate kinases or a positive feedback on the activation of Ras signalling—induces an ultrasensitivity response that is, in turn, modulated by the relative values of the kinetic constants. Second, comparison of two extreme models for nanocluster disassembly reveals the importance of the physical origin of nanocluster lifetime regulation respect to the robustness (i.e. parameter insensitivity) of the signalling mechanisms. As two extreme possibilities, we propose model A where nanocluster lifetime is externally regulated by a fixed frequency, and model B where individual nanocluster activity fully determines its duration. Most likely, biological cell signalling may be regulated by a mixture of these two extreme situations. Importantly, we have shown that any contribution to nanocluster lifetime regulated by local production enhances individual ultrasensitivity outputs, rather independent of the values of the model kinetic parameters. Local negative feedback is shown to assure that signalling nanoclusters work as robust switches, and this underpins high-fidelity global responses that are, consequently, more robust against changes of the kinetic parameters. It could be conjectured, therefore, that nanocluster lifetime self-regulation protects the signalling response from variability in the rates of involved reactions, in the concentration of substrate compounds or in the particular architecture of the signalling pathway.
Many modelling approaches have been attempted to describe cell signalling processes but the complexity of the signalling structure and the number of kinetic parameters hide the particular role of nanocluster dynamics. In this paper, we have proposed a simple and generic signalling motif model that captures essential features of signal transduction, such as ultrasensitiveness and fidelity, and could apply to different types of spatial signalling domains following a temporal birth/death dynamics. Nevertheless, the observed complexity of signalling pathways may entail some biological advantages, for example enabling plasticity to modulate different response amplitudes triggering opposing cell fate decisions within a single cell. In the context of our framework for nanocluster cell signalling, we plan to tackle these questions and others, for example the processing of time-dependent stimulus, in future research.
Funding statement
This work was supported by Generalitat de Catalunya grant no. Ref. 2009SGR1055; the Ramón y Cajal program of MICINN; MICINN Project no. BFU2010-21847-C02-02.
References
- 1.Bhalla US, Iyengar R. 1999. Emergent properties of networks of biological signaling pathways. Science 283, 381–387. ( 10.1126/science.283.5400.381) [DOI] [PubMed] [Google Scholar]
- 2.Brightman FA, Fell DA. 2000. Differential feedback regulation of the MAPK cascade underlies the quantitative differences in EGF and NGF signaling in PC12 cells. FEBS Lett. 482, 169–174. ( 10.1016/S0014-5793(00)02037-8) [DOI] [PubMed] [Google Scholar]
- 3.Schoeberl B, Eichler-Jonsson C, Gilles ED, Müller G. 2002. Computational modeling of the dynamics of the MAP kinase cascade activated by surface and internalized EGF receptors. Nat. Biotechnol. 20, 370–375. ( 10.1038/nbt0402-370) [DOI] [PubMed] [Google Scholar]
- 4.Shin S-Y, Rath O, Choo S-M, Fee F, McFerran B, Kolch W, Cho K-H. 2009. Positive- and negative-feedback regulations coordinate the dynamic behavior of the Ras–Raf–MEK–ERK signal transduction pathway. J. Cell Sci. 122, 425–435. ( 10.1242/jcs.036319) [DOI] [PubMed] [Google Scholar]
- 5.de Ronde W, Tostevin F, ten Wolde PR. 2011. Multiplexing biochemical signals. Phys. Rev. Lett. 107, 04810 ( 10.1103/PhysRevLett.107.048101) [DOI] [PubMed] [Google Scholar]
- 6.Andreu-Pérez P, et al. 2011. Protein arginine methyltransferase 5 regulates ERK1/2 signal transduction amplitude and cell fate through CRAF. Sci. Signal. 4, 190 ra58 ( 10.1126/scisignal.2001936) [DOI] [PMC free article] [PubMed] [Google Scholar]
- 7.Kolch W. 2000. Meaningful relationships: the regulation of the Ras/Raf/MEK/ERK pathway by protein interactions. Biochem. J. 351, 289–305. ( 10.1042/0264-6021:3510289) [DOI] [PMC free article] [PubMed] [Google Scholar]
- 8.Dhillon AS, Hagan S, Rath O, Kolch W. 2007. MAP kinase signaling pathways in cancer. Oncogene 26, 3279–3290. ( 10.1038/sj.onc.1210421) [DOI] [PubMed] [Google Scholar]
- 9.Huang CY, Ferrell JE. 1996. Ultrasensitivity in the mitogen-activated protein kinase cascade. Proc. Natl Acad. Sci. USA 93, 10 078–10 083. ( 10.1073/pnas.93.19.10078) [DOI] [PMC free article] [PubMed] [Google Scholar]
- 10.Kholodenko BN. 2000. Negative feedback and ultrasensitivity can bring about oscillations in the mitogen-activated protein kinase cascades. Eur. J. Biochem. 267, 1583–1588. ( 10.1046/j.1432-1327.2000.01197.x) [DOI] [PubMed] [Google Scholar]
- 11.Sturm OE, et al. 2010. The mammalian MAPK/ERK pathway exhibits properties of a negative feedback amplifier. Sci. Signal. 3, ra90 ( 10.1126/scisignal.2001212) [DOI] [PubMed] [Google Scholar]
- 12.Henis YI, Hancock JF, Prior IA. 2009. Ras acylation, compartmentalization and signalling nanoclusters. Mol. Membr. Biol. 26, 80–92. ( 10.1080/09687680802649582) [DOI] [PMC free article] [PubMed] [Google Scholar]
- 13.Kholodenko BN, Hancock JF, Kolch W. 2010. Signalling ballet in space and time. Nat. Rev. Mol. Cell Biol. 11, 414–426. ( 10.1038/nrm2901) [DOI] [PMC free article] [PubMed] [Google Scholar]
- 14.Harding AS, Hancock JF. 2008. Using plasma membrane nanoclusters to build better signaling circuits. Trends Cell Biol. 18, 364–371. ( 10.1016/j.tcb.2008.05.006) [DOI] [PMC free article] [PubMed] [Google Scholar]
- 15.Tian T, Harding A, Inder K, Plowman S, Parton RG, Hancock JF. 2007. Plasma membrane nanoswitches generate high-fidelity Ras signal transduction. Nat. Cell Biol. 9, 905–914. ( 10.1038/ncb1615) [DOI] [PubMed] [Google Scholar]
- 16.Boykevisch S, Zhao C, Sondermann H, Philippidou P, Halegoua S, Kuriyan J, Bar-Sagi D. 2006. Regulation of Ras signaling dynamics by SOS-mediated positive feedback. Curr. Biol. 16, 2173–2179. ( 10.1016/j.cub.2006.09.033) [DOI] [PubMed] [Google Scholar]
- 17.Gillespie DT. 1976. A general method for numerically simulating the stochastic evolution of coupled chemical reactions. J. Comput. Phys. 22, 403–434. ( 10.1016/0021-9991(76)90041-3) [DOI] [Google Scholar]
- 18.Gillespie DT. 1977. Exact stochastic simulation of coupled chemical reactions. J. Phys. Chem. 81, 2340–2361. ( 10.1021/j100540a008) [DOI] [Google Scholar]
- 19.Kamioka Y, Yasuda S, Fujita Y, Aoki K, Matsuda M. 2010. Multiple decisive phosphorylation sites for the negative feedback regulation of SOS1 via ERK*. J. Biol. Chem. 285, 33 540–33 548. ( 10.1074/jbc.M110.135517) [DOI] [PMC free article] [PubMed] [Google Scholar]