

Abstract
More than 20 human genetic diseases are associated with inheriting an unstable expanded DNA simple sequence tandem repeat, for example, CTG (cytosine–thymine–guanine) repeats in myotonic dystrophy type 1 (DM1) and CAG (cytosine–adenine–guanine) repeats in Huntington disease (HD). These sequences mutate by changing the number of repeats not just between generations, but also during the lifetime of affected individuals. Levels of somatic instability contribute to disease onset and progression but as changes are tissue-specific, age- and repeat length-dependent, interpretation of the level of somatic instability in an individual is confounded by these considerations. Mathematical models, fitted to CTG repeat length distributions derived from blood DNA, from a large cohort of DM1-affected or at risk individuals, have recently been used to quantify inherited repeat lengths and mutation rates. Taking into account age, the estimated mutation rates are lower than predicted among individuals with small alleles (inherited repeat lengths less than 100 CTGs), suggesting that these rates may be suppressed at the lower end of the disease-causing range. In this study, we propose that a length-specific effect operates within this range and tested this hypothesis using a model comparison approach. To calibrate the extended model, we used data derived from blood DNA from DM1 individuals and, for the first time, buccal DNA from HD individuals. In a novel application of this extended model, we identified individuals whose effective repeat length, with regards to somatic instability, is less than their actual repeat length. A plausible explanation for this distinction is that the expanded repeat tract is compromised by interruptions or other unusual features. We quantified effective length for a large cohort of DM1 individuals and showed that effective length better predicts age of onset than inherited repeat length, thus improving the genotype–phenotype correlation. Under the extended model, we removed some of the bias in mutation rates making them less length-dependent. Consequently, rates adjusted in this way will be better suited as quantitative traits to investigate cis- or trans-acting modifiers of somatic mosaicism, disease onset and progression.
Keywords: somatic instability, mathematical modelling, mutation rates, statistical inference, myotonic dystrophy type 1, Huntington disease
1. Introduction
Most human genetic diseases associated with inheriting an unstable expanded DNA simple sequence repeat are caused by repeat units of three nucleotide bases: CTG (cytosine–thymine–guanine) in myotonic dystrophy type 1 (DM1) and CAG (cytosine–adenine–guanine) in Huntington disease (HD) [1]. The CTG repeat unit in DM1 is found in the 3′ untranslated region of the DMPK gene [2–4]. In HD, the repeat unit is CAG in the coding region of the huntingtin gene [5].
The length of the repeat unit is inversely correlated with age of disease onset. Generally, as longer lengths get passed on from parent to child, the age of onset decreases, sometimes by as much as 30 years, between generations. This phenomenon is known as anticipation and is a feature of many expanded repeat diseases [1]. The DM1 CTG repeat is polymorphic in the general population, ranging from five to 37 repeats, and from upwards of 50 to several thousand in affected DM1 patients [3,4,6]. Individuals who inherit between 50 and 100 CTGs typically have late adult onset with mild symptoms and those inheriting between 100 and 800 CTGs have adult/juvenile onset. There is also a congenital form of DM1 usually occurring among those inheriting between 800 and 1500 CTGs [7]. Affected individuals are seen with repeat lengths over 35 CAGs in HD [5], but in contrast to DM1, in HD most individuals usually only inherit between 40 and 50 CAGs. Juvenile onset can occur over 50 CAGs, but there is not a known congenital form of HD. Despite differences between DM1 and HD with respect to the repeat motif and its position, and differences in the tissues affected and disease pathology, the unimodal shape of sized single-molecule repeat length distributions is very similar in blood or buccal DNA [8–10]. This suggests that there may be similarities in the mechanism underlying mutation in each disease.
The expanded repeat lengths mutate during the lifetime of affected individuals by changing the number of repeats, leading to repeat length differences between cells within a tissue, and giving rise to somatic mosaicism. In DM1 and HD, the diseases under discussion here, the changes are length- and time-dependent with levels of somatic mosaicism biased towards expansion and generally increasing as an individual ages [8,10]. Levels of somatic mosaicism are particularly high in pathology-related tissues, such as muscle in DM1 [11] and brain in HD [12,13] and this has given rise to the hypothesis that somatic instability may itself contribute to the pathogenic process [13,14]. The link between somatic mosaicism and disease onset suggests that preventing the repeat lengths from expanding might be therapeutic [1,15].
Interpretation of the level of somatic instability is confounded by several considerations, notably inherited repeat length, but also age and tissue in which somatic instability is observed and individual-specific rates of mutation. Distinguishing between the components of somatic instability is expected to improve interpretation and prognostic information for affected individuals and their families. Previously, we developed a mathematical model that describes changes in repeat length distributions in DM1 blood DNA over time [16]. This model was fitted to sized repeat lengths from a large cohort of DM1-affected or at risk individuals [14]. These individuals varied in terms of their estimated inherited repeat lengths (between 50 and 1500 CTGs). The probabilistic model assumed that changes in repeat length increased as a function of repeat length and time. This model was shown to explain satisfactorily the variable distributions of repeat lengths seen across this group of DM1 individuals. It was established that contractions play an important part in the mutational process, with relatively small net gains of CTGs being the predicted result of many expansions and almost as many contractions. From these results, we concluded that mutations at the DM1 locus are ultra-frequent, much more frequent than might be concluded from the net gains or examination of the modal repeat length. In summary, both expansions and contractions have resulted in the characteristic shape of the repeat length distributions [16].
However, we observed that for individuals with small alleles (inherited repeat lengths less than 100 CTGs) expansion and contraction rates clustered around the low end of the parameter spectrum [16]. As it is reasonable to expect these rates to be randomly distributed throughout the spectrum, the results indicate that the overall model may be improved by introducing a nonlinear response in line with the biological consideration that small alleles may have a reduced propensity to expand and/or contract owing to possible size effects [16].
The precise mechanisms that cause repeat units to become inserted or deleted from the repeat length tract are not known [1,17,18], but two basic types of explanation, DNA replication and DNA repair, have been proposed for the expansion of simple sequence repeats.
The aim of this study is to develop and test a more sophisticated mathematical model based on plausible biological assumptions about small alleles. The model is applied to both DM1 and HD data, and evaluated using techniques from statistical inference. We thereby quantify whether mutational propensity is lower in the small alleles and whether reduced levels of somatic mosaicism give rise to distinctive repeat length distributions. We also introduce and quantify the concept of effective length. Individuals whose effective length is different from their actual length are strong candidates for further experimental investigation, as lower than expected levels of somatic mosaicism may indicate the presence of modifiers of somatic instability such as interruptions in the repeat lengths.
2. Methods
2.1. Data
The data in this study comprised distributions of CTG repeat lengths sized from blood DNA from 14 DM1-affected individuals at the DM1 locus [14] and distributions of CAG repeat lengths sized from buccal DNA from 12 HD affected individuals at the HD locus [8]. A summary of the mean repeat length distributions and the range of repeat length distributions for each of the individuals above (14 DM1 and 12 HD) can be viewed in the electronic supplementary materials (figures S1, S2.1–S2.14 and S3.1–S3.12, respectively). The subset of 14 DM1 individuals with inherited repeat lengths less than 100 CTGs, see [14] for further details, was selected from the total cohort of 145 DM1 individuals. Out of these selected individuals, nine were asymptomatic when the blood samples were taken and five had late-onset, with age at onset ranging from 46 to 74 years. The 12 unrelated HD individuals [8] had estimated inherited repeat lengths between 39 and 48 CAGs and were all 39 years old when the buccal samples were taken. The distributions were sized, in terms of the number of repeats, using single-molecule PCR assays. Since the first application of small pool PCR to quantify variation at the myotonic dystrophy locus in 1995 [19], the technique has become well established as robust and reliable, and has been used to quantify triplet repeat dynamics in a wide range of scenarios and at various loci (e.g. [12,20–22]).
2.2. Formulation of an expansion and contraction model incorporating a length-specific effect
The framework we use to describe changes in repeat length (measured by the number of repeat units) over time in a population of cells is a stochastic birth and death process. In our context, birth is the gain of one repeat unit (expansion), and death is the loss of one repeat unit (contraction) within a cell. This is a probabilistic model with probability functions defined for the mutational events of expansion and contraction. In [16], we assumed that the likelihood of a mutational event increased linearly with repeat length over a threshold number of repeats and it is this assumption and corresponding function definitions that we will refine in this paper, see the appendix for details. A key modelling assumption is that the cells acquire mutations independently of one another, and this was justified for DM1 blood cells [16]. Our application of the model to another disease and cell type, HD buccal cells, requires the assumption that buccal cells acquire mutations independently of one another. Buccal cells, such as other external epithelium cells, are replenished from a large pool of self-renewing stem cells [23] hence an assumption of independence is reasonable.
Our approach to quantify a length-specific effect and to determine the range over which it operates is based on a repeat length distance parameter, α, and is sufficiently general to incorporate different distance requirements that might suppress mutation proportional to length. The length parameter, α, may be interpreted as the length of a DNA fragment typically processed by the DNA repair mechanism and/or DNA replication machinery. Alternatively, such a distance requirement might be created by an interruption in the repeat length.
2.3. Model comparison and parameter estimation
The basic model, linearly proportional expansion and contraction over a threshold number of repeats, referred to as M6b in [16] and here as M, is summarized in the appendix. We develop a new model, Mα, by introducing a length-specific effect, Rn(n, α), which is a function of repeat length, n, and the distance constraint, α, into model M. The length-specific effect is quantified using a combinatorial counting argument based on the length of the constraint (one interpretation being the distance between loop-outs), denoted as α, and the likelihood that mutation occurs. We introduce this effect into the probability functions for expansion and contraction, as described in the appendix.
Both models, M and Mα, were fitted to sized single-molecule distributions of DM1 blood DNA and HD buccal DNA, from the individuals described above. The prior ranges for Bayesian parameter estimation were chosen to represent DM1 blood/HD buccal cells: expansion per CTG/CAG unit per year (models M and Mα), contraction per CTG/CAG unit per year (models M and Mα), a threshold measured in CTG/CAG units (model M) and a distance constraint measured in CTG/CAG units (model Mα; table 1). For both datasets, the inherited number of repeats, n0, was treated as an unknown parameter and its value inferred from the data along with the other parameters. The maximum likelihood was calculated using a grid search over the parameter space, modified respectively for DM1 blood cells and HD buccal cells.
Table 1.
Uniform prior ranges for parameter estimation, models M and Mα, for small alleles from DM1 blood and HD buccal cells.
| model | parameters | prior ranges |
|
|---|---|---|---|
| DM1 blood | HD buccal | ||
| M, Mα | contraction rate per repeat unit per year (μ) | 0–1.2 | 0–0.005 |
| M, Mα | net expansion rate per repeat unit per year (λ − μ) | 0.001–0.5 | 0.0001–0.1 |
| M | threshold number of repeat units (a) | 0–50 | 0–40 |
| Mα | length parameter number of repeat units (α) | 0–90 | 0–40 |
| M, Mα | inherited repeat length, number of repeat units (n0) | 51–100 | 38–50 |
The relative goodness of fit of the basic model M and the new model Mα was assessed using the Akaike information criterion (AIC) [24]. The models have the same number of parameters and are not nested, so AIC is an appropriate method to rank the models through a relative measure of the goodness of fit. Application of AIC involved calculating the maximum-likelihood value using a grid search over the parameter space, as outlined in table 1. Further details about model comparison and parameter estimation are found in the appendix.
3. Results
3.1. Repeat length distributions among individuals with small alleles have relatively low variance-to-mean ratios
We observed that the variance-to-mean ratios of the repeat length distribution among the subgroup of 14 DM1 individuals with inherited repeat lengths less than 100 CTGs are very low, much lower than predicted under the basic model M, especially when age is also taken into account. In terms of the difference between the predicted and the observed ratio per year (figure 1), the fact that all 14 DM1 individuals lie at the low end (15th percentile) of this distribution is highly significant (p < 10−5 using a permutation test). These results inform our hypothesis that a length-specific effect, not accounted for in the model, M, results in proportionally less mutation within the small alleles.
Figure 1.

Small alleles have lower variance over mean ratios than predicted. Comparison of the observed variance over mean ratio (adjusted for the threshold effect) by age (circles) among 142 DM1 individuals (blood DNA) and the predicted variance over mean path under model M (solid line). DM1 individuals with mean repeat lengths less than 100 are indicated by a filled circle.
3.2. Model comparison supports a role for a length-specific effect suppressing mutational rates in DM1
In order to test the hypothesis that a length-specific effect suppresses mutational rates among individuals with small alleles, we introduced a length constraint, α, into the basic model and used a model comparison method (AIC) to compare the extended model Mα with the basic model M in terms of goodness of fit.
Model Mα (maximum-likelihood value = −4779 and AIC = 9670) ranks higher than model M (maximum-likelihood value = −4805 and AIC = 9721; table 2). The difference in AIC values (51) indicates that the relative likelihood of model M compared with Mα is very low (6.90 × 10⁻¹²), and so we conclude that model Mα fits the data significantly better than model M among individuals with repeat lengths at the lower end of the DM1 range. The model fit can be visualized as a distribution curve or a cumulative distribution curve. The fits of models M and Mα compared with the data and each other are shown for two representative DM1 individuals (figure 2a,b), and for all DM1 individuals, see electronic supplementary material (figures S2.1–S2.14). Model Mα is seen to be better than model M at tracking the initially steep ascent of the cumulative distribution that is typical for these individuals.
Table 2.
Model comparison summary for DM1 blood and HD buccal cells. The models, listed in column 1, were compared using AIC.
| model |
DM1 (n = 14 individuals) |
HD (n = 12 individuals) |
|||
|---|---|---|---|---|---|
| maximized log-likelihood (number of parameters) | AIC | maximized log-likelihood (number of parameters) | AIC | ||
| Mα | expansion and contraction with a length-specific effect | −4779 (56) | 9670 | −1312 (48) | 2746 |
| M | expansion and contraction over a threshold number of repeats | −4805 (56) | 9721 | −1343 (48) | 2781 |
Figure 2.

Model fit. Distribution of repeat lengths (top) and model fitting results (bottom) for representative DM1 individuals CR8 (a) and CR27 (b); representative HD individual HD10 (c); and an unusual DM1 individual BC19 (d). The fit of model Mα (grey solid line) and model M (black dashed line) are compared with the cumulative distribution (black jagged line) of repeat lengths.
The average maximum-likelihood value of α among these 14 DM1 individuals was 51 CTGs (153 base pairs), but there was considerable variation (s.d. = 22 CTGs). With a fixed length parameter, α = 51 CTGs, we estimate that the length-specific effect would be strongest between 51 CTGs and 173 CTGs. These results provide support for a length-specific effect operating below 200 CTGs in DM1. By suppressing the mutation rate per repeat unit, the length-specific effect makes a big difference to the shape of the repeat length distribution below 200 CTGs but its significance rapidly decreases beyond this level.
3.3. Model comparison supports a role for a length-specific effect suppressing mutational rates in Huntington disease
As for DM1 blood, the results from AIC for HD buccal cells indicate that model Mα (maximum-likelihood value = −1312 and AIC = 2746) ranks higher than model M (maximum-likelihood value = −1343 and AIC = 2781; table 2). The difference in AIC values (35) indicates that the relative likelihood of model M compared with Mα is very low (2.06 × 10⁻⁸), so we conclude that model Mα fits the buccal DNA data significantly better than model M among individuals with repeat lengths at the lower end of the range. As was the case for DM1, model Mα is better than model M at tracking the initially steep ascent of the cumulative distribution (figure 2c). For the fits of models M and Mα for all HD individuals, see electronic supplementary material (figures S3.1–S3.12).
Among these 12 HD individuals, there were three individuals for whom the two models, M and Mα, were equally likely and the estimates for the fixed length parameter were below three CAGs. These three individuals had low levels of somatic mosaicism and hence it may not be possible to distinguish between the models and estimate the length-specific factor in this instance. Among the other nine HD individuals, the average value of α associated with the maximum-likelihood value was 26 CAGs (s.d. = 11 CAGs). These results provide support for a length-specific effect, suppressing the mutation rate per repeat unit, over the whole range of observed repeat lengths in this HD dataset (59 CAGs or less).
We also considered a model with global parameters for the mutation rates and length effect and individual-specific parameters only for the inherited length (results not shown). However, as reported for DM1 in reference [16], global parameters did not capture the variation seen in the data, indicating that individual-specific factors play a major role in HD somatic instability. Inclusion of contraction events, i.e. decreases in repeat length of one CAG unit for HD, was also justified statistically, as there was no support for the contraction rates being zero.
3.4. Estimates of inherited repeat length under model Mα are in agreement with original predictions
In our study, we treated inherited repeat length, n0, as an unknown parameter to be inferred from the data. Our estimates of the value of n0 are in agreement (correlation coefficient = 0.93) with those estimated using the lower bound of the distribution as seen with small pool PCR, discussed in reference [14]. Further, our estimates of the value of n0 are in complete agreement (correlation coefficient > 0.99) with the estimates by Veitch et al. [8], which for the HD individuals in this study were based on the lower boundary of their highly skewed distributions.
3.5. Mutational levels are higher in DM1 blood cells than in Huntington disease buccal cells
The parameter values associated with the maximum-likelihood value provide a point estimate for mutation rates, in terms of expansion per repeat unit and contraction per repeat unit for each individual. Comparing parameter values under model Mα for DM1 blood with those for HD buccal cells, the median expansion rate for DM1 (9.1 × 10⁻² per CTG per year) is significantly higher (p = 8.28 × 10⁻⁵ using the Mann–Whitney U-test) than for HD (8.5 × 10⁻⁴ per CAG per year). Similarly, the median contraction rate is significantly higher (p = 1.32 × 10⁻⁵ using the Mann–Whitney U-test) for DM1 (7.0 × 10⁻² per CTG per year) than for HD (1.5 × 10⁻⁴ per CAG per year), see figure 3 for comparison. The number of individuals is small, but there appears to be a correlation between expansion and contraction rates within DM1 (correlation coefficient > 0.99) and within HD (correlation coefficient = 0.70) suggesting a link between expansion and contraction, within the mutational mechanism, in both diseases. Interestingly, the ratio of contraction to total mutation (expansion and contraction) is higher for DM1 (0.40) than for HD (0.18), and this most probably reflects biological differences between DM1 blood cells and HD buccal cells.
Figure 3.
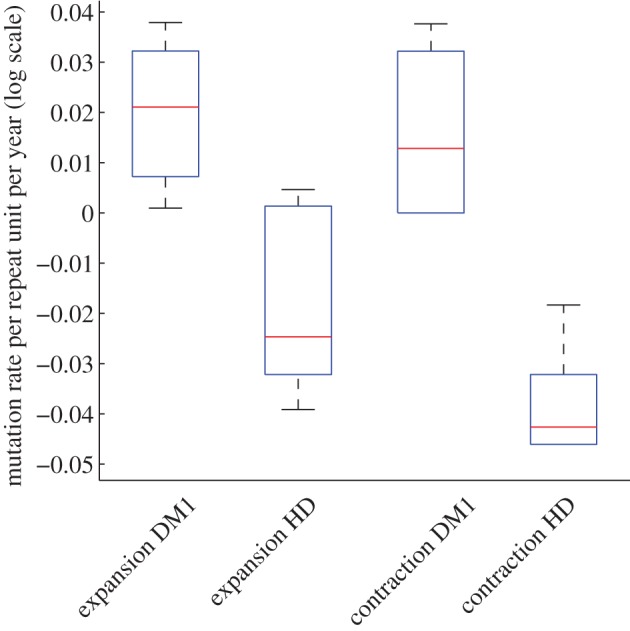
Mutation rates are higher in DM1 blood cells than in HD buccal cells. Comparison of mutation rates, under model Mα, between DM1 (14 individuals) and HD (12 individuals). (Online version in colour.)
3.6. For some DM1 individuals, effective length is lower than inherited repeat length
We have shown that model Mα better explains the distinctive distributions among DM1 individuals with smaller alleles than model M. A length-specific effect may operate in other unusual individuals, particularly those with low variance-to-mean ratios (figure 1). Application of the extended model, Mα, to the data from unusual individuals in order to infer a value for α, may establish whether, and if so, when, this effect operates.
We therefore fitted model Mα to distributions of repeat lengths (blood DNA) from eight DM1 individuals with low variance-to-mean ratios (figure 1). Five of the eight DM1 individuals have estimates for α of 80 repeat units or more and an improvement in fit (likelihood gain of 2 or more). The improvement in fit can be seen by comparing the fit of both models to the data for representative individual BC19 (figure 2d). For the fits of models, M and Mα for other DM1 individuals (likelihood gain of 9 or more), see the electronic supplementary material, figures S4.1–S4.10. As seen before, (figure 2a–c), model Mα is better than model M at capturing the steep rise at the beginning of the cumulative distribution. We then fitted model Mα to distributions of repeat lengths (blood DNA) from the rest of the cohort (120 DM1 individuals with estimated inherited repeat length, n0, over 100 CTGs). There were 16 DM1 individuals, with estimated values for α over 100 CTGs (table 3b). For most of these individuals, there is an improvement in fit (likelihood gain of 2 or more).
Table 3.
DM1 individuals with unusual repeat length distributions. Individuals with a low variance mean ratio (15th percentile) and an inherited/progenitor allele length (PAL) > 100 CTGs (a). Individuals with a high estimated α (maximum-likelihood) value (b).
| code | age at sampling | PAL | likelihood gain | α |
|---|---|---|---|---|
| (a) | ||||
| CR12 | 49 | 132 | 13 | 110 |
| CR28 | 35 | 107 | 0 | 20 |
| CR70 | 50 | 102 | 18 | 80 |
| BC6 | 51 | 279 | 2 | 110 |
| BC19 | 27 | 229 | 9 | 175 |
| SCO4 | 39 | 114 | 14 | 90 |
| SCO99 | 36 | 140 | 0 | 10 |
| SCO117 | 29 | 134 | 14 | 120 |
| (b) | ||||
| CR10 | 29 | 197 | 3 | 120 |
| CR11 | 31 | 160 | 9 | 110 |
| CR18 | 38 | 225 | 0 | 130 |
| CR26 | 44 | 160 | 4 | 120 |
| CR35 | 30 | 353 | 4 | 140 |
| CR39 | 21 | 194 | 8 | 175 |
| CR69 | 13 | 471 | 0 | 130 |
| BC8 | 50 | 152 | 26 | 120 |
| BC10 | 42 | 261 | 3 | 140 |
| BC11 | 43 | 341 | 1 | 130 |
| BC16 | 34 | 342 | 0 | 150 |
| BC47 | 36 | 160 | 9 | 120 |
| SCO95 | 51 | 184 | 9 | 110 |
| SCO96 | 29 | 431 | 2 | 200 |
| SCO115 | 35 | 134 | 39 | 130 |
| SCO134 | 36 | 225 | 5 | 130 |
In defining effective length, we use inherited repeat length as a point of reference as it is both the initial repeat length and the major modifier of age of onset. Hence, we define effective length as the difference between inherited repeat and α, that is n0 − α. Consequently, higher α values imply lower effective lengths (table 3). Interestingly, BC6 and BC19 (father and son) were previously noted for two reasons. First, they have unusually mild symptoms given their estimated inherited repeat lengths (see fig. 2 in [25], BC6 = II.2 and BC19 = III.2). Second, the germline transmission from father (BC6) to son (BC19) resulted in a relatively rare apparent contraction [25].
3.7. Effective length is better than inherited repeat length at explaining age of onset
We would expect the effective length to align more closely and better predict age of onset and disease progression than inherited repeat length. To test this prediction, we obtained an estimate for effective length by adjusting inherited repeat length (by subtracting α) in the individuals with lower than expected variance-to-mean ratios (15th percentile) and setting α equal to zero in the other individuals (16th–100th percentile), 128 DM1 individuals in total. We then compared inherited repeat length and effective length, in 128 DM1 individuals, in terms of explaining age of onset using linear regression analysis. Effective length (adjusted R2 = 50.6%, p < 10−15, n = 128) was better than inherited repeat length (adjusted R2 = 46.8%, p < 10−15, n = 128) at explaining variance in age of onset, confirming our expectation. Using model Mα, we remove some of the bias in mutation rates, mentioned above, making them less length-dependent. Under model M, the mutation rates were correlated with inherited repeat length (correlation coefficient = 0.64, p < 10−5), whereas under model Mα, correlation between mutation rates and inherited repeat length was much lower (correlation coefficient = 0.30, p < 10−5).
4. Discussion
In DM1, small inherited repeat lengths (less than 100 CTGs) are associated with late-onset and less disease severity. Model M assumed that expansion and contraction were linearly dependent on the number of repeats over a threshold number of repeats. However, estimated rates of mutation per repeat unit per year for individuals with small alleles were lower than the rest of the cohort [16]. While this does not affect our ability to describe the changes in repeat length and hence the levels of somatic mosaicism over time, the implication that individuals with small inherited repeat lengths also have low absolute rates of mutation (taking into account inherited repeat length) does not have an obvious biological basis. It is more plausible that model M does not take repeat length correctly into account.
We introduced a length constraint into the expressions for expansion and contraction as an extension of the original mathematical model. This approach is sufficiently general to cover a wide range of possible constraints on the mutational mechanism that act by suppressing mutation rates as alleles decrease in size. Here, we have determined that relative to longer alleles, the mutation rate in shorter alleles less than approximately 200 repeats is suppressed. This effect can be quantified and corrected for in our mathematical model of repeat dynamics by defining a new length factor, α. An obvious question that arises is what is the biological interpretation of α? The precise mechanism by which somatic mosaicism arises remains unknown, but it is assumed that it must involve the misalignment of repeats to generate small loops, hairpins or other alternative non-B-DNA structures [1,17,18]. Although the repeats may be unstable during replication, the lack of a correlation between tissue-specific somatic mosaicism and cell proliferation and the accumulation of high levels of somatic mosaicism in post-mitotic tissues such as brain and muscle [11,12,20,26–29], suggest the primary mechanism is cell division independent. Evidence from transgenic mouse models also implicates a major role for several of the DNA mismatch repair proteins [30–33], and inappropriate DNA mismatch repair of alternative structures presents as an attractive mechanism [34]. A length effect could be envisioned to operate at multiple steps along this pathway (figure 4). Consistent with a length effect mediated by the formation of alternative structures, Gellibolian et al. revealed from the biophysical examination of DNA mis-pairing CTG repeat tracts, that the number of mis-pairings per repeat unit was length-dependent with relatively fewer mis-pairings per repeat unit below 200 CTGs and reaching a constant rate over 200 CTGs [36]. Mis-aligned alternative DNA conformations can be formed readily in vitro [37], and may arise spontaneously in vivo owing to thermal fluctuations (DNA breathing) [38,39]. The rate at which alternative structures form would be expected to be strongly influenced by the local chromatin environment, an effect that is assumed to underlie the major modifying effect that cis-acting flanking sequences have on inter-locus repeat instability [40]. Local DNA breathing [38,39] and/or chromatin remodelling could mediate lateral diffusion of loop-outs along the duplex. Lateral diffusion could lead, in some cases, to resolution of the secondary structures, or alternatively lead to further separation of complementary loop-outs. Allele length effects could reasonably be expected to modify the initial distance between complementary loop-outs, which, in turn, would modify the probability of resolution by diffusion and/or limit the available space for lateral diffusion in opposing directions. Complementary loop-outs that are close together may interfere with each other [35]. Alternatively, complementary loop-outs that are close together may be more likely to be encompassed within the same repair domain, leading to no net change in allele length [34]. Whereas, complementary loop-outs separated by a greater distance may be more likely to be repaired as independent events giving rise to the opportunity to generate both expansions and contractions. Interestingly, the length of mismatch repair excision domains in human cells is estimated to be of the order of 60–230 base pairs [41], a distance that is consistent with our estimates of α. Of course, the above model(s) of expansions remain speculative, but it is easy to envisage how similar explanations for α could be incorporated into other expansion models.
Figure 4.

Possible biological interpretations of the allele length effect α (a). The figure shows a schematic of the repeated region (narrow lines) and the immediate flanking DNA (thick lines) and possible mutational pathways. A primary step in the mutation mechanism is assumed to be the transition from duplex DNA (i) to mis-aligned structures containing loop-outs or hairpins (ii). α Might represent the propensity for such structures to form, possible interference from the flanking DNA (ii) or interference between nearby loop-outs (iii). Once formed, complimentary loop-outs may be able to diffuse along the duplex. Loop-outs that diffuse towards each other may meet, regenerating the original duplex without length change (iv). Alternatively, complementary loop-outs may diffuse apart from each other (x). Loop-outs are expected to be recognized by components of the DNA mismatch repair pathway (shaded circles) (vi,xi). Repair may then proceed by excision of the loop-out (not shown, see [34] for more detail) or excision of DNA opposite the loop-out (vii,xii) and gap filling (viii,xiii). If α is small, then complementary loop-outs may interfere with each other [35] (iii) or be encompassed within the same repair domain, resulting in no net change in repeat length (v–ix). If α is large, then complementary loop-outs may be repaired as separate events and depending on whether individual loop-outs are incorporated or deleted (deletions not shown, see [34] for more detail) leading to net expansions (xi–xvii), no change events (xviii) or net contractions (xix). Please note that how excision domains are defined in replication-independent mismatch repair is not known and that excision domains extending only 5′ from site of the mismatch are shown for illustrative purposes only. Possible biological interpretations of the allele length effect α and β (b). In alleles containing repeat interruptions (white boxes), then the effective allele may be reduced by length β effectively increasing any flanking DNA effect (i) and/or reducing the possibilities for expanding the inter-loop distance (ii) via effects as in (a).
Models M and Mα were also adapted for HD and fitted to repeat length distributions from HD buccal cells [8]. Overall, 14 DM1 blood datasets and 12 HD buccal datasets, model Mα with its length-specific effect fitted better than the thresholded model, M (table 2). This result suggests that there is a constraint on the mutational mechanism at the lower end of the allele range in DM1 blood cells and HD buccal cells. Our estimate for the length parameter in HD (average = 26 CAGs) is lower than for DM1 (average = 51 CTGs) which may reflect differences in flanking GC content and possibly explain differences in the disease threshold, which is lower for HD (35 CAGs) than for DM1 (50 CTGs). These results place α within the DNA repair domain 60–230 base pairs suggested by Genschel et al. [41] and thus is consistent with a hypothesis implicating inappropriate DNA repair, as outlined in figure 4.
As well as quantifying the length-specific effect, we inferred the parameter values underlying the best fit and associated with the maximum-likelihood value. For model Mα, the parameters comprised expansion rate per repeat per year (λ), contraction rate per repeat per year (μ), length parameter (α) and inherited repeat length (n0). For small alleles, in both DM1 and HD, we found statistical support for expansion and contraction (λ and μ both non-zero) and individual-specific parameters. Expansion and contraction rates were correlated in DM1 (correlation coefficient > 0.99) and in HD (correlation coefficient = 0.70) suggesting that expansion and contraction, in both DM1 and HD, may be different outcomes of the same underlying process or otherwise conserved components of the instability pathway. This result has direct relevance to therapies that target the mutations directly [15] in order to readdress the balance and/or reduce levels of instability. Targeting these common components may not affect the relative proportion of expansions and contractions. However, given that disease onset and progression are at least partially driven by absolute expansion rates, suppressing both expansions and contractions and hence overall net expansion rates, would still be expected to be therapeutically beneficial. Moreover, something must drive the net bias towards expansion and targeting this specific step in the expansion pathway provides a very attractive target as only a modest-specific suppression of expansions would result in a net contraction bias.
Estimated mutational rates, for both expansion and contraction, were significantly lower in HD buccal cells than in DM1 blood cells (figure 3) and were more weighted towards expansion in HD buccal cells (82%) than in DM1 blood cells (60%). These differences have implications for the shape of the repeat length distributions (more skewed to higher repeat lengths in HD and more spread out in DM1) and hence levels of somatic mosaicism. A clear difference between DM1 and HD is that the repeat length tract is found in a non-coding area in DM1 and a coding area in HD. However, the most likely explanation for differences in the estimated mutational rates is linked to cell type rather than linked to disease type. Repeat length distributions measured in both blood cells and buccal cells from the same DM1 individuals (F. Morales et al. 2013, unpublished data) show similar differences. Here, the variance-to-mean ratio was found to be higher in blood than in buccal cells reflecting a higher percentage of contraction and hence a lower percentage of expansion in blood than in buccal cells. Differences other than those linked to cell type may have a molecular basis related to flanking GC content that differ in DM1 and HD with a slightly higher percentage of GCs in HD. As there is a strong correlation between the relative germline expandability of these repeats and the flanking GC content [40,42], the higher percentage of GCs in HD might explain the weighting towards expansion in HD and further illuminate a modifying role for flanking GC content.
In addition to the 14 DM1 individuals with inherited repeat lengths less than 100 CTGs, we identified eight DM1 individuals with lower than predicted variance-to-mean ratios under model M (figure 1). We hypothesized that the repeat length distributions in these individuals may also have been affected by an individual-specific length constraint of biological origin. We, therefore, fitted model Mα using an extended range (0–200 CTGs) for the length constraint, α, to an additional 128 DM1-sized single-molecule blood DNA datasets. We found that for six of the eight DM1 individuals, mentioned above, model Mα fitted the data better than model M (likelihood gain greater than or equal to 2; table 3). The explanation for this lies with high estimated values for α (80 CTGs and above) and a correspondingly better fit at the low end of the repeat length distributions in these individuals (figure 2d) whose likelihood remarkably increased. An improvement in fit (greater than or equal to 2) and a high estimated value for α (greater than 100 CTGs) were also observed for a further 12 individuals listed in table 3b, notably individuals BC8 and SCO115. These results suggest that length-specific effect may operate in some individuals over higher repeat length ranges (greater than 200 CTGs). These individuals are candidates for further investigation to establish the biological basis. For individuals whose variance-to-mean ratios conform to expectation, models M and Mα fit equally well, reflecting the decreasing significance of α over 200 CTGs.
As mutation rates are assumed negligible in the repeat lengths less than α under model Mα, the effective length of the repeat length tract, with respect to mutation, can be considered to be the complementary number of repeats in the tract. We thus defined the difference between the inherited repeat length and α as the effective length of an individual. In this context, individuals with either small inherited repeat lengths (less than 100 CTGs) and/or high estimated values for α are predicted to have effective lengths much smaller than their actual lengths. The length of α may be determined by individual-specific cis-acting and or trans-acting factors. One such plausible cis-acting factor could be an interruption in the pure CTG tract such as CGG or CCG whose physical presence extends the effect of a length constraint [43,44]. A rule where the length constraint of α applies only on one side of an interruption at position β from the other side would be entirely consistent with the uninterrupted version. We would simply infer α + β in the first instance and α in the second instance. High inferred α values correspond to low effective lengths and potentially less instability and disease (figure 4).
Inherited repeat length explains a large proportion of variance in age of onset. Recently, levels of somatic instability have been shown to modify age of onset in DM1 [14] and HD [13]. However, the relationship between inherited repeat length, level of somatic instability and age of onset is not straightforwardly linear. By quantifying length-specific effects, we can now suggest a biologically plausible explanation for this nonlinear component, namely that levels of somatic mosaicism do not progress in a linear manner. Levels of somatic mosaicism appear to be relatively lower in small alleles than in long alleles owing to the length-specific effect. This gives rise to relatively later ages of onset in small alleles than in long alleles, resulting in the observed nonlinear relationship between age of onset and inherited repeat length [14,45].
We showed that effective length aligns more closely and better predicts age of onset and hence disease progression than inherited repeat length. Using model Mα, we also removed some of the bias in mutation rates, under model M, making them less length-dependent. Consequently, rates adjusted in this way will be better suited as quantitative traits to investigate trans- or cis-acting modifiers of somatic mosaicism, disease onset and progression.
Our findings that mutational rates may be suppressed in the region above the disease thresholds in both HD buccal DNA (most effective up to 60 CAGs on average) and DM1 blood DNA (most effective up to 173 CTGs on average) are encouraging from a clinical perspective. Individuals with alleles in this range generally have reduced levels of somatic mosaicism, less severe phenotypes and later age of onset. Longer DM1 alleles transmitted to the next-generation result in more severe symptoms and an earlier age at onset, an effect compounded by somatic expansion. Suppression of somatic expansion is therefore expected to be therapeutically beneficial and induction of contractions potentially curative [1,15]. However, the feasibility of suppressing expansions/inducing contractions remains largely undetermined. Our results show that, in principle, therapies aimed at reducing the length of disease DNA tracts, if successful, should result in lower levels of somatic mosaicism which should slow down disease progression.
5. Conclusion
Inherited repeat length and somatic instability are emerging as key modifiers of disease onset and progression in DM1 and HD [13,14]. However, the relationship between inherited repeat length, somatic instability and age of onset appears complex. Our work unravels some of this complexity by formalizing biological hypotheses mathematically and using statistical inference to compare models and calibrate biological parameters that drive levels of somatic mosaicism. Through mathematical modelling and data-driven quantification, we can better assess the relative importance of these parameters within an individual, between individuals and between cell types and diseases. We find similarities in the underlying mechanism, as evidenced by strong correlation between expansion and contraction rates in both DM1 and HD. However, we also find high levels of variation in these rates suggesting that individual-specific factors modify levels of somatic mosaicism to a large degree. In addition, as illustrated here, some variant repeats or other polymorphisms may further modify repeat length distributions and disease progression. Finding factors that modify disease is an important next step that will be facilitated by the use of biologically relevant quantitative traits, such as those established here.
Acknowledgements
The authors thank the members of their laboratory for their comments and support.
Appendix A
A.1. Basic model M
Representing the expansion rate per year, the contraction rate per year and inherited repeat length by λn, μn and n0, respectively, and letting Pn(t) denote the probability that an allele has length n at time t, the rate of change of Pn(t) with respect to time is governed by the master equation of the form
| A1 |
Given the allele length at time zero, n0, we may approximate this infinite system of ordinary differential equations numerically by truncating at a suitably large value of n = N and setting Pn(t) = 0 for all n ≥ N + 1.
To specify the functional form of λn and μn for model M, we depart from the traditional linear model by introducing a threshold, a, for the birth and death process. No activity takes place for repeat lengths below this threshold, and the general propensity for expansion or contraction is proportional to the excess length above the threshold, consistent with the inherent stability observed in non-diseased individuals. Hence, the functional forms of λn and μn are λn = λ(n − a) and μn = μ(n − a), respectively, for n > a.
A.2. Mathematical model with length-specific effect Mα
To derive the new variation of this model, Mα, we formulate a length-specific factor, denoted Rn, as follows. Let the total repeat length be n. Consider now a length constraint on the mutational mechanism. A and B are locations where repair is needed (e.g. loop-outs). We hypothesize that subsequent mutation requires |A − B| > α, where α is an unknown number of repeat units to be inferred from the data. The length parameter α is therefore interpreted as the minimum separation between repeats required for mutation to occur. We relate the likelihood that mutation occurs to the proportion of all possible distances that result in |A − B| > α, assuming that A and B occur at arbitrary uniformly random positions along n, and that these occurrences are independent. There are n2 possible complementary pairs. Using combinatorial counting methods, it can be shown that there are (n − α) (n − α + 1) pairs separated by distance |A − B| > α. Hence, the ratio, Rn, of possible mutation events, is given by
| A2 |
We note that for fixed α, Rn → 1 as n → ∞. This corresponds to the intuitively reasonable notion that the finite length constraint is negligible for very large repeat lengths.
Rn can be considered as the biophysical capacity of a repeat length to undergo expansion and contraction. We would expect smaller alleles to have a lower capacity than larger alleles to expand and contract.
Based on these considerations, we modify our basic model, equation (A 1), as follows
| A3 |
and
| A4 |
for n > α, where λ and μ are now the constant rates of expansion and contraction per repeat unit per year, respectively. For 0 ≤ n ≤ α, we have λn = μn = 0.
This introduces a nonlinearity into our equations and hence we cannot derive closed forms for the mean and variance. However, the equations can of course still be solved numerically.
A.3. Model comparison and parameter estimation
We use likelihood methods to carry out model comparison and parameter estimation. The likelihood is defined to be the probability that a repeat length has reached the length observed given the model and its parameters. We can solve equation (A 1) numerically in order to obtain the probability distribution function components Pn(t) which give the probability that repeat length is n at time t. The likelihood L[i] is then the product over all the data  , which denotes the repeat length for the jth observation from individual i, of the probability
  , where θ[i] are the model parameters for that individual and t[i] the age of the individual when the data sample was taken. This gives the likelihood for individual i,
| A5 |
and the overall likelihood L is the product over all individuals in the population,
| A6 |
The AIC is used to assess the goodness of the fit of the model [24]. AIC uses the maximized value of the likelihood of the model, Lmax, penalized by the number of model parameters, k, to rank models thus
| A7 |
with the model with the smallest AIC value being ranked highest.
We obtain the maximum value of the likelihood by evaluating the likelihood over a broad parameter space described in table 1. Maximization of the likelihood L in equation (A 6) is essentially the maximization of each L[i] in equation (A 5) using each dataset from an individual. For further statistical analysis, it was useful to have point estimates for the parameters. These were taken to be the maximum-likelihood values.
The relative likelihood of two models with AIC values denoted AIC1 and AIC2 respectively, where AIC1 < AIC2, is
| A8 |
Funding statement
This work was supported by a University of Glasgow Kelvin Smith PhD Scholarship awarded to C.F.H.
References
- 1.Gomes-Pereira M, Monckton DG. 2006. Chemical modifiers of unstable expanded simple sequence repeats: what goes up, could come down. Mutat. Res. 598, 15–34. ( 10.1016/j.mrfmmm.2006.01.011) [DOI] [PubMed] [Google Scholar]
- 2.Buxton J, et al. 1992. Detection of an unstable fragment of DNA specific to individuals with myotonic dystrophy. Nature 355, 547–548. ( 10.1038/355547a0) [DOI] [PubMed] [Google Scholar]
- 3.Fu YH, et al. 1992. An unstable triplet repeat in a gene related to myotonic muscular dystrophy. Science 255, 1256–1258. ( 10.1126/science.1546326) [DOI] [PubMed] [Google Scholar]
- 4.Brook JD, et al. 1992. Molecular basis of myotonic dystrophy: expansion of a trinucleotide (CTG) repeat at the 3‘ end of a transcript encoding a protein kinase family member. Cell 68, 799–808. ( 10.1016/0092-8674(92)90154-5) [DOI] [PubMed] [Google Scholar]
- 5.The Huntington's Disease Collaborative Research Group. 1993. A novel gene containing a trinucleotide repeat that is expanded and unstable on Huntington's disease chromosomes. Cell 72, 971–983. ( 10.1016/0092-8674(93)90585-E) [DOI] [PubMed] [Google Scholar]
- 6.Harley HG, et al. 1993. Size of the unstable CTG repeat sequence in relation to phenotype and parental transmission in myotonic dystrophy. Am. J. Hum. Genet. 52, 1164–1174. [PMC free article] [PubMed] [Google Scholar]
- 7.Tsilfidis C, MacKenzie AE, Mettler G, Barcel J, Korneluk RG. 1992. Correlation between CTG trinucleotide repeat length and frequency of severe congenital myotonic dystrophy. Nat. Genet. 1, 192–195. ( 10.1038/ng0692-192) [DOI] [PubMed] [Google Scholar]
- 8.Veitch NJ, Ennis M, McAbney JP, Shelbourne PF, Monckton DG. 2007. Inherited CAG·CTG allele length is a major modifier of somatic mutation length variability in Huntington disease. DNA Repair 6, 789–796. ( 10.1016/j.dnarep.2007.01.002) [DOI] [PubMed] [Google Scholar]
- 9.Lavedan C, et al. 1993. Myotonic dystrophy: size-and sex-dependent dynamics of CTG meiotic instability, and somatic mosaicism. Am. J. Hum. Genet. 52, 875. [PMC free article] [PubMed] [Google Scholar]
- 10.Wong LJ, Ashizawa T, Monckton DG, Caskey CT, Richards CS. 1995. Somatic heterogeneity of the CTG repeat in myotonic dystrophy is age and size dependent. Am. J. Hum. Genet. 56, 114–122. [PMC free article] [PubMed] [Google Scholar]
- 11.Ashizawa T, Dubel JR, Harati Y. 1993. Somatic instability of CTG repeat in myotonic dystrophy. Neurology 43, 2674–2678. ( 10.1212/WNL.43.12.2674) [DOI] [PubMed] [Google Scholar]
- 12.Kennedy L, Evans E, Chen C, Craven L, Detloff PJ, Ennis M, Shelbourne PF. 2003. Dramatic tissue-specific mutation length increases are an early molecular event in Huntington disease pathogenesis. Hum. Mol. Genet. 12, 3359–3367. ( 10.1093/hmg/ddg352) [DOI] [PubMed] [Google Scholar]
- 13.Swami M, Hendricks AE, Gillis T, Massood T, Mysore J, Myers RH, Wheeler VC. 2009. Somatic expansion of the Huntington's disease CAG repeat in the brain is associated with an earlier age of disease onset. Hum. Mol. Genet. 18, 3039–3047. ( 10.1093/hmg/ddp242) [DOI] [PMC free article] [PubMed] [Google Scholar]
- 14.Morales F, et al. 2012. Somatic instability of the expanded CTG triplet repeat in myotonic dystrophy type 1 is a heritable quantitative trait and modifier of disease severity. Hum. Mol. Genet. 21, 3558–3567. ( 10.1093/hmg/dds185) [DOI] [PubMed] [Google Scholar]
- 15.Castel AL, Cleary JD, Pearson CE. 2010. Repeat instability as the basis for human diseases and as a potential target for therapy. Nat. Rev. Mol. Cell Biol. 11, 165–170. ( 10.1038/nrm2854) [DOI] [PubMed] [Google Scholar]
- 16.Higham CF, Morales F, Cobbold CA, Haydon DT, Monckton DG. 2012. High levels of somatic DNA diversity at the myotonic dystrophy type 1 locus are driven by ultra-frequent expansion and contraction mutations. Hum. Mol. Genet. 21, 2450–2463. ( 10.1093/hmg/dds059) [DOI] [PubMed] [Google Scholar]
- 17.McMurray CT. 2010. Mechanisms of trinucleotide repeat instability during human development. Nat. Rev. Genet. 11, 786–799. ( 10.1038/nrg2828) [DOI] [PMC free article] [PubMed] [Google Scholar]
- 18.Mirkin SM. 2007. Expandable DNA repeats and human disease. Nature 447, 932–940. ( 10.1038/nature05977) [DOI] [PubMed] [Google Scholar]
- 19.Monckton DG, Wong LJ, Ashizawa T, Caskey CT. 1995. Somatic mosaicism, germline expansions, germline reversions and intergenerational reductions in myotonic dystrophy males: small pool PCR analyses. Hum. Mol. Genet. 4, 1–8. ( 10.1093/hmg/4.1.1) [DOI] [PubMed] [Google Scholar]
- 20.Fortune MT, Vassilopoulos C, Coolbaugh MI, Siciliano MJ, Monckton DG. 2000. Dramatic, expansion-biased, age-dependent, tissue-specific somatic mosaicism in a transgenic mouse model of triplet repeat instability. Hum. Mol. Genet. 9, 439–445. ( 10.1093/hmg/9.3.439) [DOI] [PubMed] [Google Scholar]
- 21.Martorell L, Monckton D, Gamez J, Baiget M. 2000. Complex patterns of male germline instability and somatic mosaicism in myotonic dystrophy type 1. Eur. J. Hum. Genet. 8, 423–430. ( 10.1038/sj.ejhg.5200478) [DOI] [PubMed] [Google Scholar]
- 22.Libby RT, et al. 2003. Genomic context drives SCA7 CAG repeat instability, while expressed SCA7 cDNAs are intergenerationally and somatically stable in transgenic mice. Hum. Mol. Genet. 12, 41–50. ( 10.1093/hmg/ddg006) [DOI] [PubMed] [Google Scholar]
- 23.Fuchs E. 2008. Skin stem cells: rising to the surface. J. Cell Biol. 180, 273–284. ( 10.1083/jcb.200708185) [DOI] [PMC free article] [PubMed] [Google Scholar]
- 24.Akaike H. 1974. A new look at the statistical model identification. IEEE Trans. Automat. Control 19, 716–723. ( 10.1109/TAC.1974.1100705) [DOI] [Google Scholar]
- 25.Ashizawa T, et al. 1992. Anticipation in myotonic dystrophy. II. Complex relationships between clinical findings and structure of the GCT repeat. Neurology 42, 1877–1883. [DOI] [PubMed] [Google Scholar]
- 26.Lia AS, Seznec H, Hofmann-Radvanyi H, Radvanyi F, Duros C, Saquet C, Blanche M, Junien C, Gourdon G. 1998. Somatic instability of the CTG repeat in mice transgenic for the myotonic dystrophy region is age dependent but not correlated to the relative intertissue transcription levels and proliferative capacities. Hum. Mol. Genet. 7, 1285–1291. ( 10.1093/hmg/7.8.1285) [DOI] [PubMed] [Google Scholar]
- 27.Kennedy L, Shelbourne PF. 2000. Dramatic mutation instability in HD mouse striatum: does polyglutamine load contribute to cell-specific vulnerability in Huntington's disease? Hum. Mol. Genet. 9, 2539–2544. ( 10.1093/hmg/9.17.2539) [DOI] [PubMed] [Google Scholar]
- 28.Seznec H, Lia-Baldini A, Duros C, Fouquet C, Lacroix C, Hofmann-Radvanyi H, Junien C, Gourdon G. 2000. Transgenic mice carrying large human genomic sequences with expanded CTG repeat mimic closely the DM CTG repeat intergenerational and somatic instability. Hum. Mol. Genet. 9, 1185–1194. ( 10.1093/hmg/9.8.1185) [DOI] [PubMed] [Google Scholar]
- 29.Gomes-Pereira M, Fortune MT, Monckton DG. 2001. Mouse tissue culture models of unstable triplet repeats: in vitro selection for larger alleles, mutational expansion bias and tissue specificity, but no association with cell division rates. Hum. Mol. Genet. 10, 845–854. ( 10.1093/hmg/10.8.845) [DOI] [PubMed] [Google Scholar]
- 30.Manley K, Shirley TL, Flaherty L, Messer A. 1999. Msh2 deficiency prevents in vivo somatic instability of the CAG repeat in Huntington disease transgenic mice. Nat. Genet. 23, 471–473. ( 10.1038/70598) [DOI] [PubMed] [Google Scholar]
- 31.Kovtun IV, McMurray CT. 2001. Trinucleotide expansion in haploid germ cells by gap repair. Nat. Genet. 27, 407–411. ( 10.1038/86906) [DOI] [PubMed] [Google Scholar]
- 32.van den Broek WJAA, Nelen MR, Wansink DG, Coerwinkel MM, te Riele H, Groenen PJTA, Wieringa B. 2002. Somatic expansion behaviour of the (CTG)n repeat in myotonic dystrophy knock-in mice is differentially affected by Msh3 and Msh6 mismatch-repair proteins. Hum. Mol. Genet. 11, 191–198. ( 10.1093/hmg/11.2.191) [DOI] [PubMed] [Google Scholar]
- 33.Savouret C, Brisson E, Essers J, Kanaar R, Pastink A, te Riele H, Junien C, Gourdon G. 2003. CTG repeat instability and size variation timing in DNA repair-deficient mice. EMBO J. 22, 2264–2273. ( 10.1093/emboj/cdg202) [DOI] [PMC free article] [PubMed] [Google Scholar]
- 34.Gomes-Pereira M, Fortune MT, Ingram L, McAbney JP, Monckton DG. 2004. Pms2 is a genetic enhancer of trinucleotide CAG.CTG repeat somatic mosaicism: implications for the mechanism of triplet repeat expansion. Hum. Mol. Genet. 13, 1815–1825. ( 10.1093/hmg/ddh186) [DOI] [PubMed] [Google Scholar]
- 35.Panigrahi GB, Slean MM, Simard JP, Gileadi O, Pearson CE. 2010. Isolated short CTG/CAG DNA slip-outs are repaired efficiently by hMutSβ, but clustered slip-outs are poorly repaired. Proc. Natl Acad. Sci. USA 107, 12 593–12 598. ( 10.1073/pnas.0909087107) [DOI] [PMC free article] [PubMed] [Google Scholar]
- 36.Gellibolian R, Bacolla A, Wells RD. 1997. Triplet repeat instability and DNA topology: an expansion model based on statistical mechanics. J. Biol. Chem. 272, 16 793–16 797. ( 10.1074/jbc.272.27.16793) [DOI] [PubMed] [Google Scholar]
- 37.Pearson CE, Sinden RR. 1996. Alternative structures in duplex DNA formed within the trinucleotide repeats of the myotonic dystrophy and fragile X loci. Biochemistry 35, 5041–5053. ( 10.1021/bi9601013) [DOI] [PubMed] [Google Scholar]
- 38.Altan-Bonnet G, Libchaber A, Krichevsky O. 2003. Bubble dynamics in double-stranded DNA. Phys. Rev. Lett. 90, 138101 ( 10.1103/PhysRevLett.90.138101) [DOI] [PubMed] [Google Scholar]
- 39.Kühner F, Morfill J, Neher RA, Blank K, Gaub HE. 2007. Force-induced DNA slippage. Biophys. J. 92, 2491–2497. ( 10.1529/biophysj.106.095836) [DOI] [PMC free article] [PubMed] [Google Scholar]
- 40.Brock GJ, Anderson NH, Monckton DG. 1999. Cis-acting modifiers of expanded CAG/CTG triplet repeat expandability: associations with flanking GC content and proximity to CpG islands. Hum. Mol. Genet. 8, 1061–1067. ( 10.1093/hmg/8.6.1061) [DOI] [PubMed] [Google Scholar]
- 41.Genschel J, Modrich P. 2003. Mechanism of 5‘-directed excision in human mismatch repair. Mol. Cell 12, 1077–1086. ( 10.1016/S1097-2765(03)00428-3) [DOI] [PubMed] [Google Scholar]
- 42.Nestor CE, Monckton DG. 2011. Correlation of inter-locus polyglutamine toxicity with CAG·CTG triplet repeat expandability and flanking genomic DNA GC content. PLoS ONE 6, e28260 ( 10.1371/journal.pone.0028260) [DOI] [PMC free article] [PubMed] [Google Scholar]
- 43.Braida C, et al. 2010. Variant CCG and GGC repeats within the CTG expansion dramatically modify mutational dynamics and likely contribute toward unusual symptoms in some myotonic dystrophy type 1 patients. Hum. Mol. Genet. 19, 1399–1412. ( 10.1093/hmg/ddq015) [DOI] [PubMed] [Google Scholar]
- 44.Musova Z, et al. 2009. Highly unstable sequence interruptions of the CTG repeat in the myotonic dystrophy gene. Am. J. Med. Genet. A 149, 1365–1374. ( 10.1002/ajmg.a.32987) [DOI] [PubMed] [Google Scholar]
- 45.Andresen JM, et al. 2007. The relationship between CAG repeat length and age of onset differs for Huntington's disease patients with juvenile onset or adult onset. Ann. Hum. Genet. 71, 295–301. ( 10.1111/j.1469-1809.2006.00335.x) [DOI] [PubMed] [Google Scholar]